


fig8
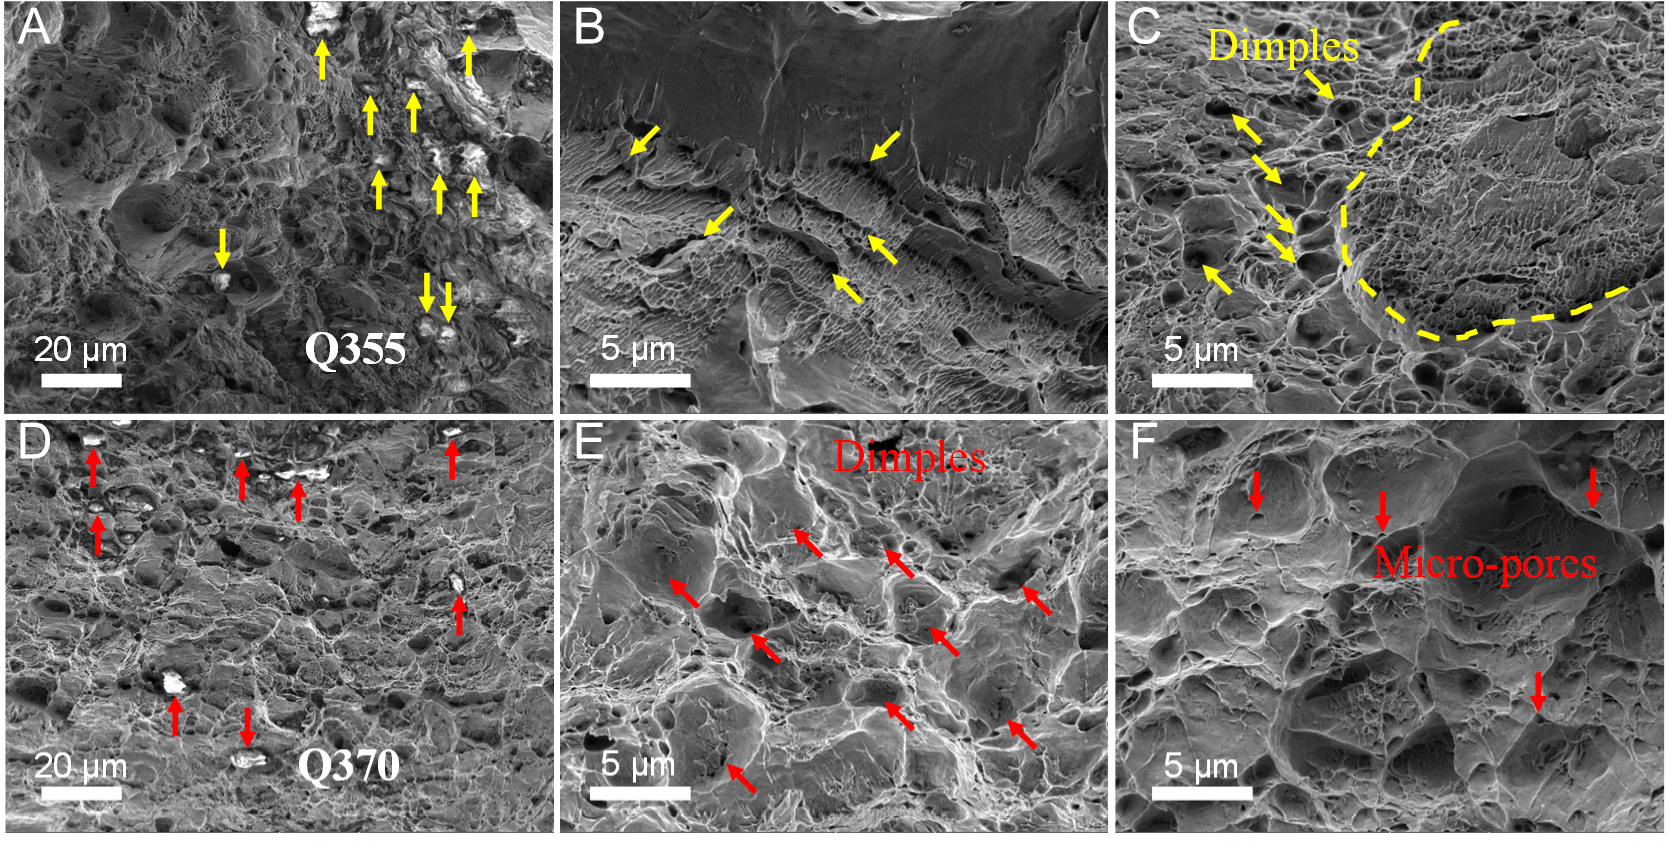
Figure 8. SEM micrographs of the top-view fracture surfaces of the Q355 and Q370 samples. (A and D) Inclusions on the fracture surfaces of the Q355 and Q370 samples indicated by contrast differences. (B) River-like patterns and layer splitting in the Q355 sample. (C) Dimples around river-like features in the Q355 sample. (E) Dimples on the fracture surface of the Q355 sample. (F) Microscale pores at the edges of dimples in the Q370 sample.


