


fig3
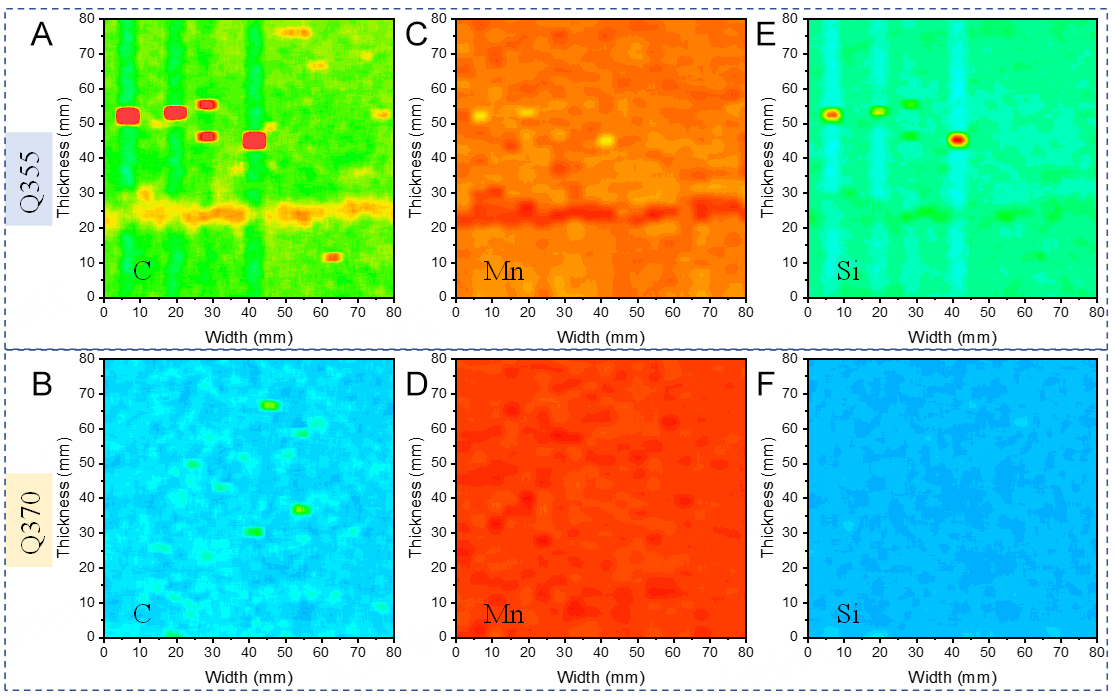
Figure 3. Original position statistic distribution analysis of C, Mn, and Si over an 80 × 80 mm2 area taken from the center thickness region of Q355 and Q370 samples. Comparisons of elements C (A and B), Mn (C and D), and Si (E and F) between the Q355 and Q370 samples show the distinct strip-like segregation along the width direction and island-like segregation along the thickness direction. The heavily concentrated spots in (A, C, E) were caused by sparks from oxide inclusions.


