


fig2
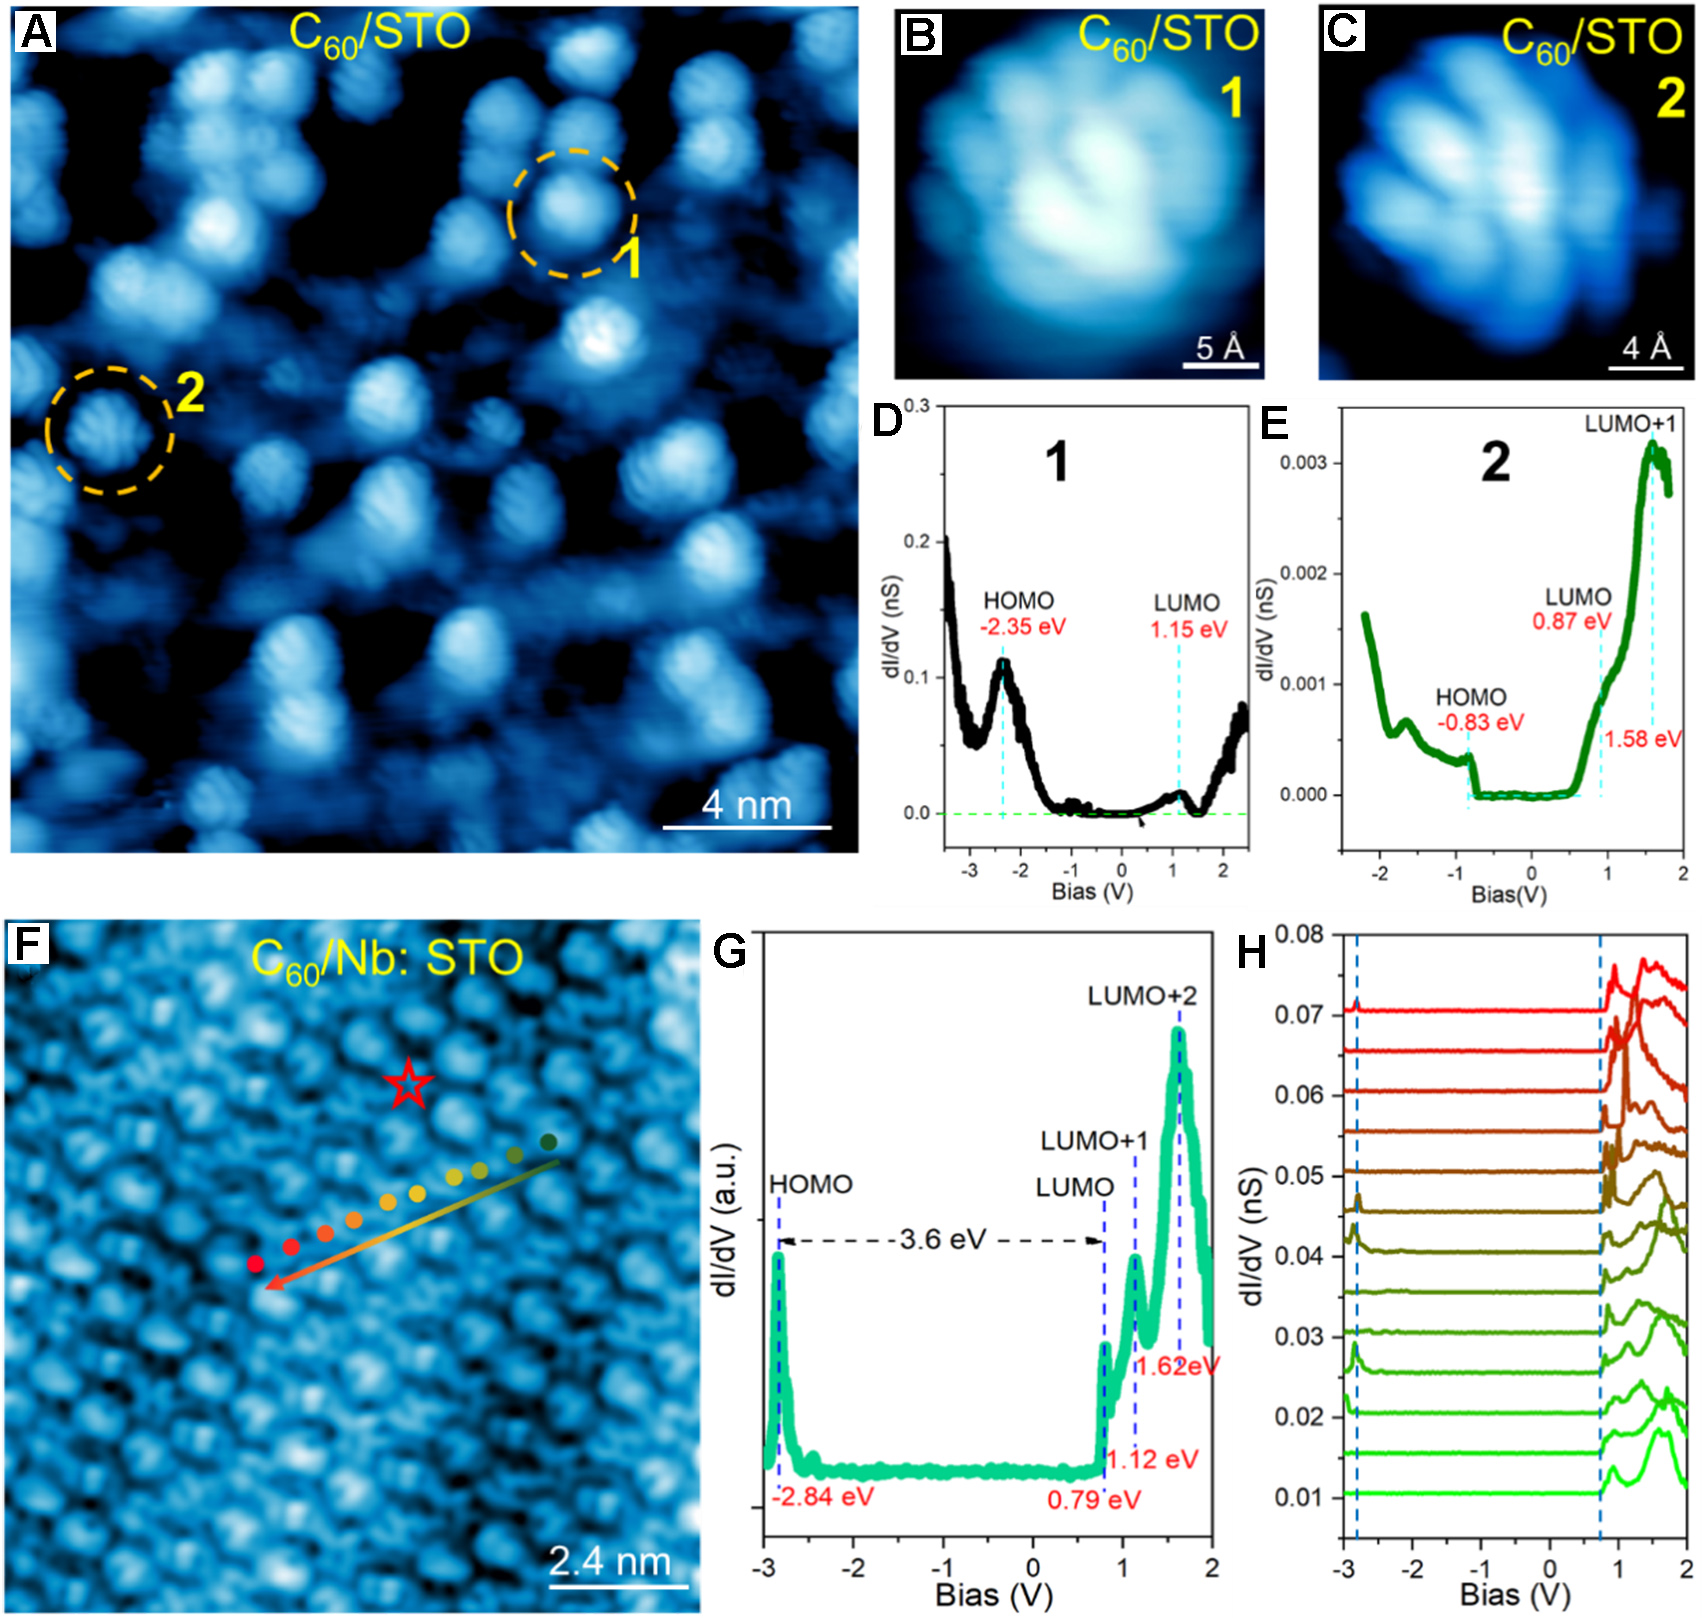
Figure 2. Topographic image and spectroscopy of C60 on undoped STO and Nb-STO substrates. (A) STM image of C60 monomers on undoped STO substrate. Image size is 20 × 20 nm2 with UB: +1.0 V and IT: 10 pA; (B and C) High-resolution image of a single C60 monomer with different internal structures. Image size is 2 × 2 nm2 with UB: +1.0 V and IT: 10 pA; (D and E) Point STS measured on top of the C60 monomer in panels (B) and (C), respectively. STS are taken by the setpoint of UB: +1.5 V, IT: 10 pA and bias modulation of 20 mV; (F) Orbital-resolved STM image of C60 monolayer on Nb-STO substrate. Image size is 12 × 12 nm2 with UB: +1.5 V and IT: 100pA; (G) STS curve measured at the location marked by red star; (H) A linear spectroscopic survey taken along the dotted line in panel (F). STS are taken by the setpoint of UB: +1.5 V, IT: 100 pA and bias modulation of 20 mV. The color gradient from green to red corresponds directly to the gradient in the (H) panel, representing the one-to-one relationship between the atomic sites in the (F) panel and the STS data in the (H) panel. All STS are taken at 4.2 K. C60: Fullerene; STO: SrTiO3; STM: scanning tunneling microscopy; STS: scanning tunneling spectroscopy; HOMO: highest occupied molecular orbital; LUMO: lowest unoccupied molecular orbital.


