


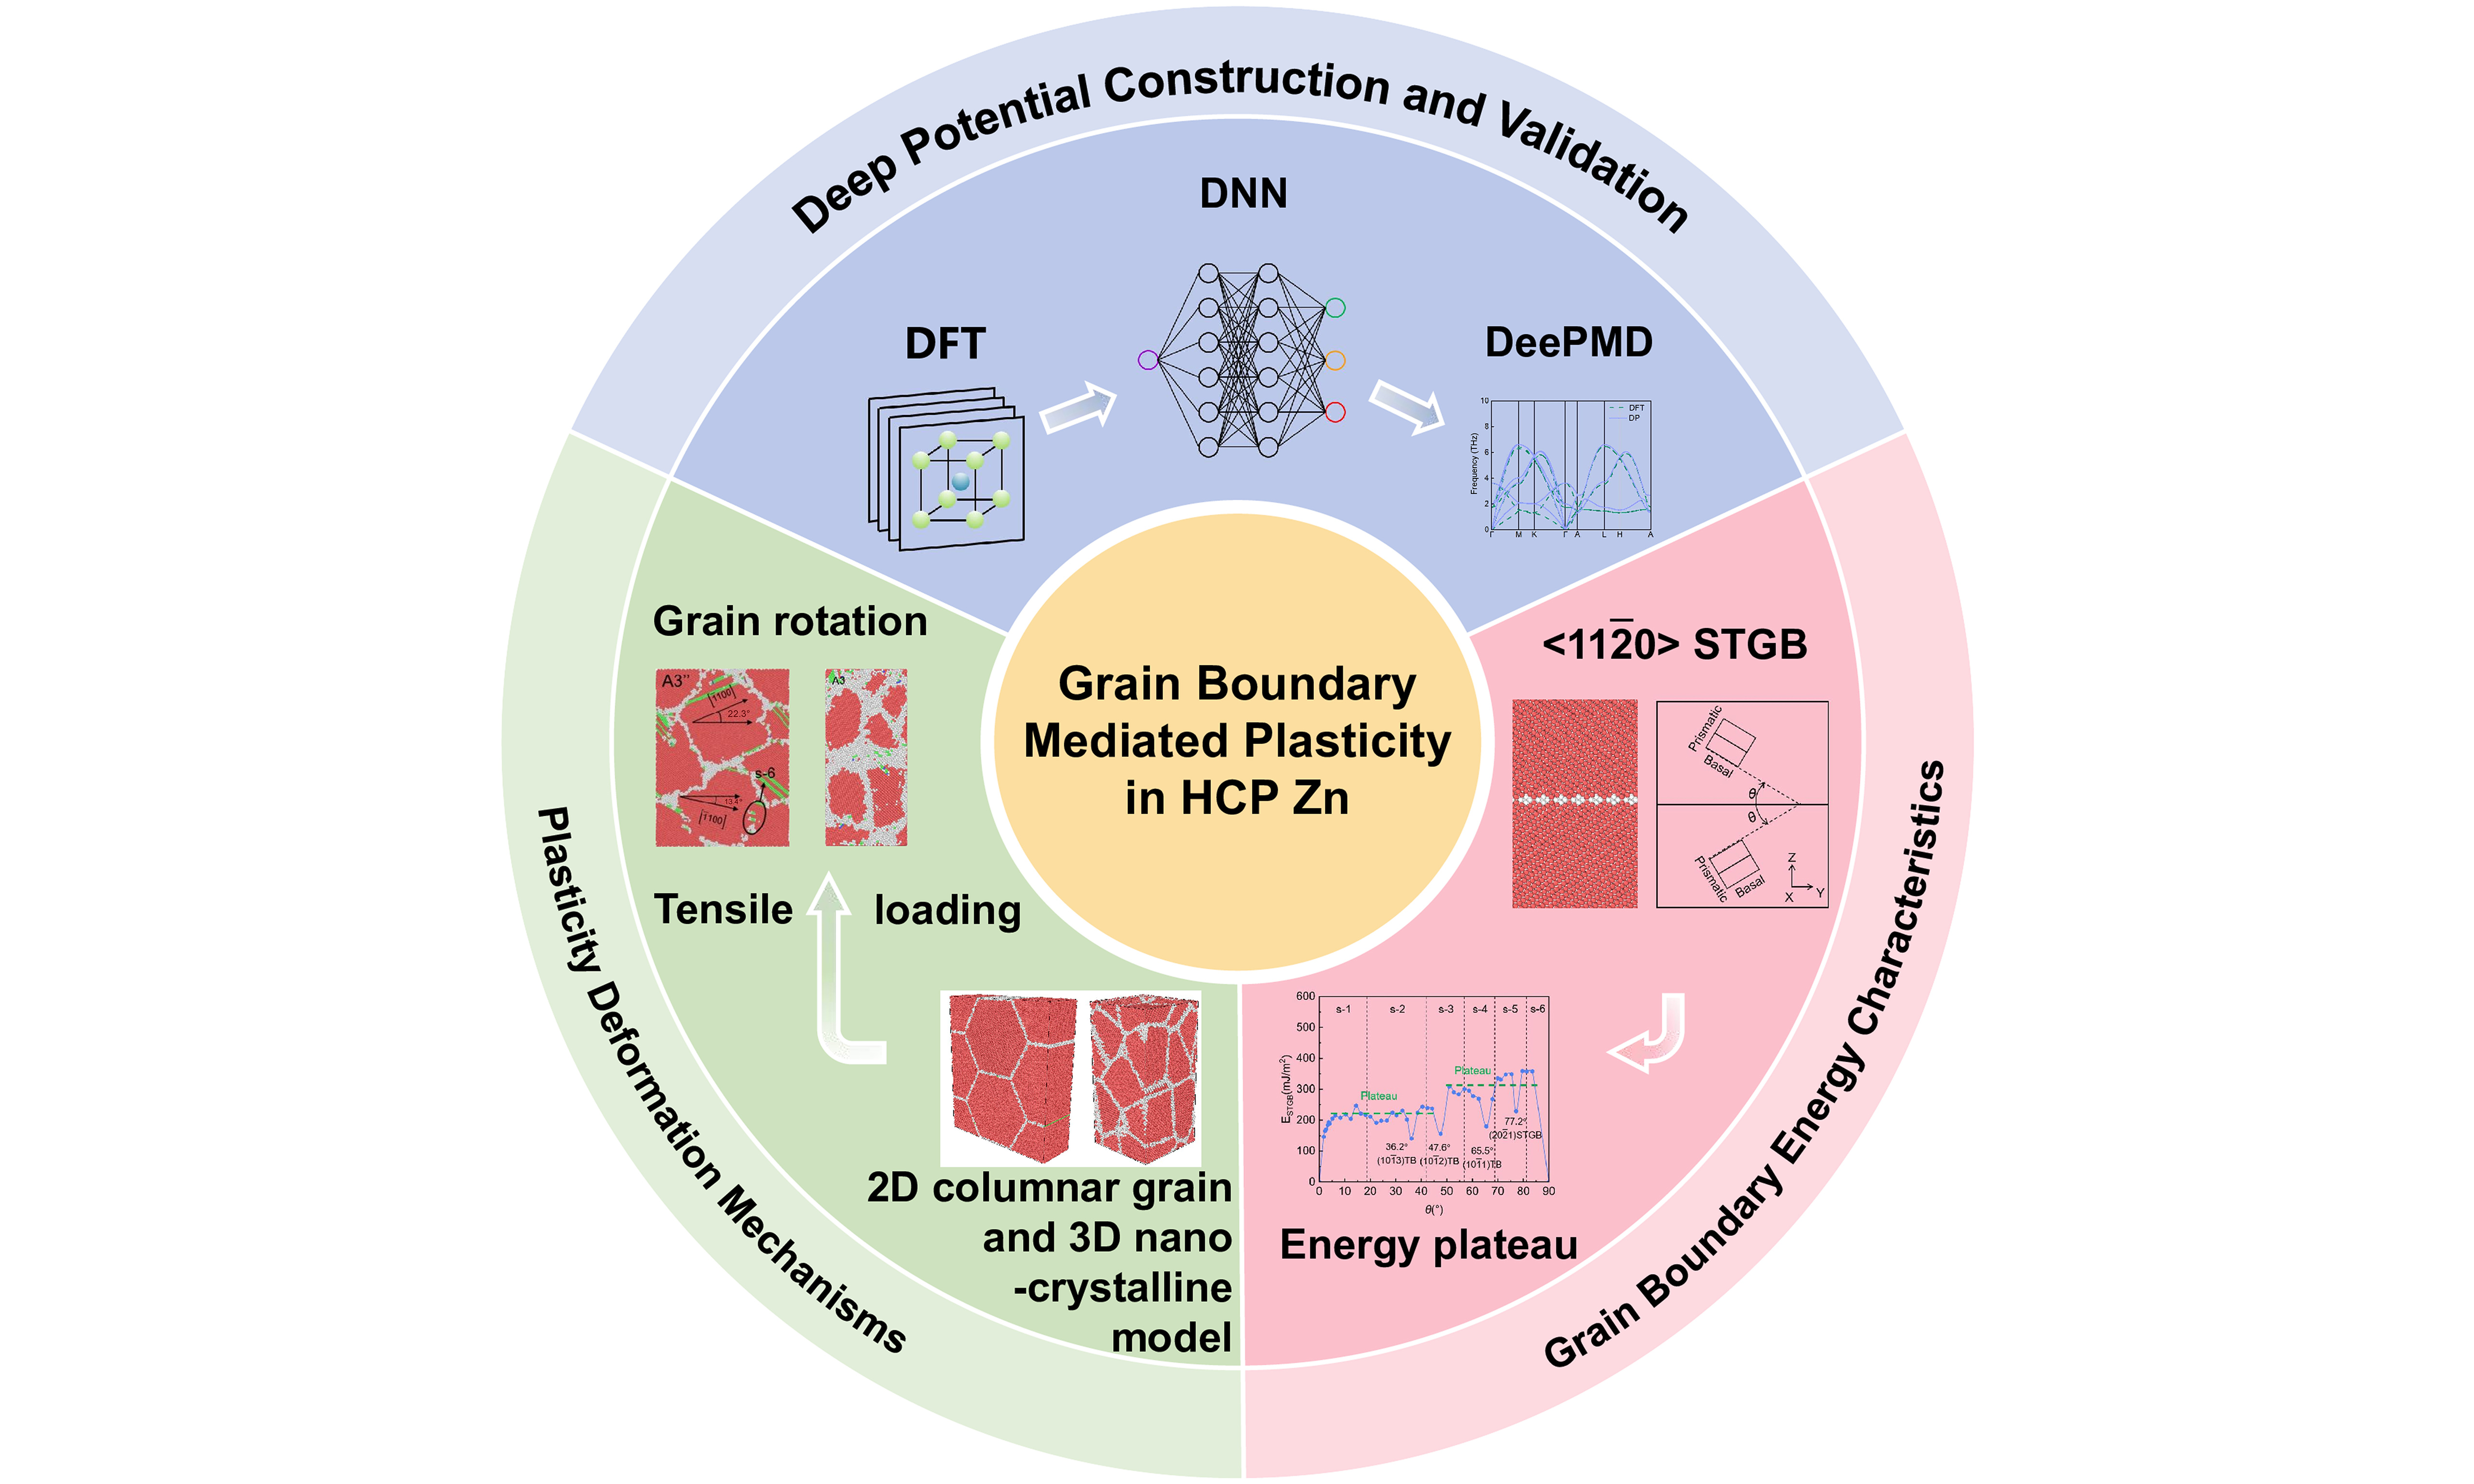
Unique grain-boundary mediated plasticity: Deep Potential MD insights in HCP zinc
 0
0 Abstract
Zinc (Zn) alloys are promising candidates for biodegradable medical applications. Their in-service performance depends critically on mechanical properties, particularly strain hardening/softening driven by grain boundary (GB) characteristics. Since the c/a ratio of hexagonal close-packed (HCP) Zn exceeds 1.8, classical interatomic potentials fail to accurately capture GB energetics and structures. In this work, a machine-learning Deep Potential (DP) model for Zn was developed. Using DP molecular dynamics (DeePMD), the energetics and structures of
Keywords
INTRODUCTION
Zinc (Zn) alloys are emerging as promising metallic biomaterials due to their excellent degradability and biocompatibility[1]. However, their applications are currently constrained by insufficient strength and pronounced strain softening[2,3]. Superplasticity, frequently observed in Zn, is intrinsically linked to grain boundary (GB) characteristics[4]. Previous studies[5,6] have attributed strain softening primarily to dynamic recrystallization, while noting that solute elements segregated at GBs can significantly modulate strain hardening/softening behaviors. The plastic deformation of Zn alloys involves a complex interplay of grain rotation, GB sliding, dislocation slip, and twinning[7]. Nevertheless, the unresolved atomic-scale coupling between GB features and these deformation mechanisms hinders the targeted microstructural design of Zn alloys for enhanced plasticity.
The GB structures in hexagonal close-packed (HCP) Zn alloys are inherently complex, involving a multitude of ground and metastable states[8,9]. Despite advances in the state-of-the-art microscopy[10], relying solely on experimental techniques for comprehensive GB characterization remains inefficient and challenging[11]. With the rapid development of computational materials science, molecular dynamics (MD) and first-principles calculations have become important tools for investigating the atomic characteristics of GBs[12,13]. However, a significant gap remains: Density Functional Theory (DFT) is restricted by spatiotemporal scales, typically limited to systems well below 105 atoms, whereas the accuracy of MD simulations depends heavily on the quality of interatomic potentials employed[14].
This challenge is particularly acute for Zn. Given that the c/a ratio of HCP Zn exceeds 1.8, classical interatomic potentials, fitted to various first-principles and experimental properties, often fail to accurately describe the highly anisotropic bonding environment[15]. Due to the complexity of GB structures[16], the subtle energy variations induced by the reconstruction of atomic structures are beyond the resolution of classical potentials[17]. To address this, the Deep Potential (DP) method, a machine learning-based interatomic potential (MLIP), offers a compelling solution. By leveraging DFT data to construct high-dimensional potential energy surfaces[18], DP effectively captures ordered and disordered structures in single- and multi-component complex systems[19,20]. It achieves predictive accuracy comparable to DFT while retaining the computational efficiency required for large-scale MD simulations[21].
Dislocations, twinning[22], and grain rotation[23] are critical deformation modes in HCP metals, and the competition among them governs macroscopic mechanical properties [24,25]. For instance, under large c-axis compression, submicron single-crystal Mg has been experimentally shown to fragment into multiple grains, reactivating widespread dislocation slip and twinning[26,27]. In Zn alloys, increasing grain size shifts the dominant deformation mechanisms from GB sliding and dynamic recrystallization to pyramidal slip and unconventional twinning[7]. While MD simulations have successfully elucidated plastic mechanisms in face-centered cubic columnar grains (2D)[28] and nanopolycrystalline Al-Er alloys[29], the simulations of Zn and its alloys remain limited. Specifically, there is a lack of studies linking GB energetics and structures directly to plastic responses.
In this study, a robust DP for Zn was developed, trained on a dataset generated by Perdew-Burke-Ernzerhof (PBE)-based DFT calculations. The DP accuracy was rigorously validated against DFT data, existing potentials, and experimental results. Subsequently, Deep Potential molecular dynamics (DeePMD) simulations were employed to systematically analyze the energetic and structural characteristics of
MATERIALS AND METHODS
Deep potential and DeePMD framework
To ensure reliability, an MLIP must satisfy strict requirements regarding extensivity, symmetric invariance, and smoothness[30]. The DeePMD method constructs such an MLIP by training a deep neural network on DFT-calculated datasets using the DeePMD-kit package. The workflow is illustrated in Figure 1. Initially, DP-GEN software and ab-initio molecular dynamics (AIMD) are employed to generate the preliminary dataset. To enrich the configurational space, atomic positions within supercells are perturbed prior to AIMD simulations. Since manually curating a comprehensive dataset for complex systems is impractical, an active learning strategy is adopted. This approach continuously explores and supplements the phase space of the target system during training, enabling automated dataset expansion[31].
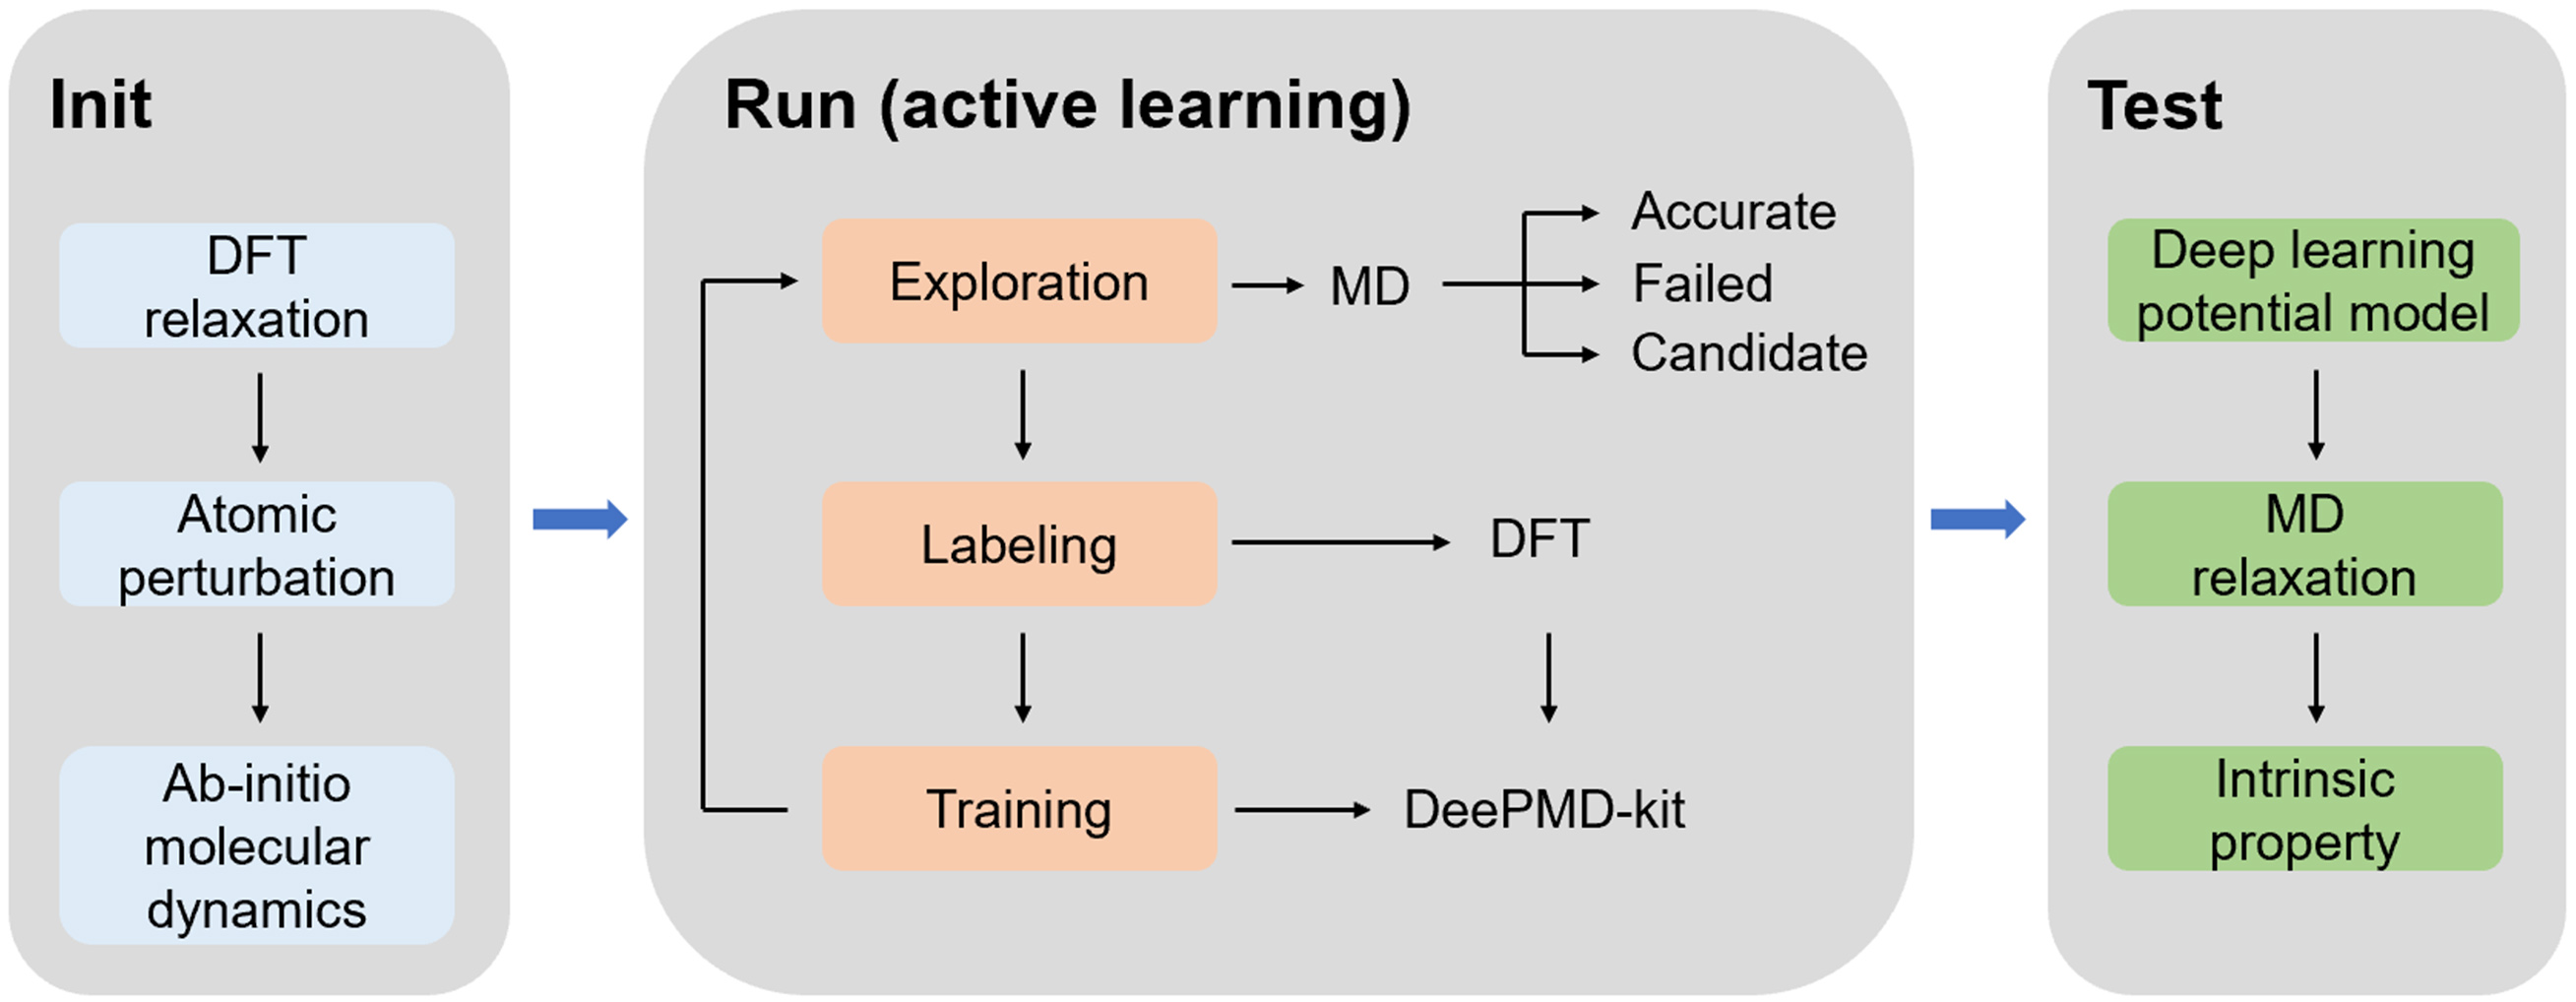
Figure 1. Flowchart of Deep Potential molecular dynamics (DeePMD). DFT: Density Functional Theory; MD: molecular dynamics.
During the running stage, active learning is implemented via DP-GEN[32], which invokes DeePMD-kit[33] to train the MLIP model. The process operates iteratively, with each cycle consisting of three stages: exploration, labeling, and training. Configurations exhibiting significant deviations between the MLIP predictions and DFT benchmarks (in terms of energy and force) are identified and re-labeled via DFT calculations. These new data points are then added to the training set to refine the model, ultimately yielding a deep learning potential with high predictive accuracy. In the test stage, the developed potential is introduced into LAMMPS software to predict various intrinsic properties for performance assessment.
To construct the training dataset, DFT calculations were performed for Zn using the VASP software[34,35]. The dataset comprised diverse configurations, including body-centered cubic (BCC), face-centered cubic (FCC), and hexagonal close-packed (HCP) supercells, as well as defect structures containing interstitials, vacancies, surfaces, and twin boundaries (TBs). Calculations employed the plane-wave projector augmented wave (PAW) method with the PBE[36] exchange-correlation functional under the generalized gradient approximation (GGA). The standard PAW-PBE pseudopotential (PAW_PBE Zn 06Sep2000) was used. A kinetic energy cutoff of 650 eV was applied, and Brillouin zone integration was performed using Monkhorst-Pack[37] k-point grids with a spacing of 0.1 Å-1. Convergence criteria for self-consistent field (SCF) iterations and structural relaxations were set to 10-6 eV and 0.01 eV/Å, respectively. The final dataset contained 21,505 samples. Detailed procedures for DP construction and training parameters are provided in Section 1 of Supplementary Materials, and the DP-GEN iteration statistics are summarized in Supplementary Table 1.
This developed DP model is tailored specifically for pure Zn, providing accurate descriptions of intrinsic properties (e.g., elastic constants, melting temperature), interfacial properties (e.g., surface energy, TB energy), and mechanical properties (e.g., stacking fault energy). Consequently, it is highly suitable for investigating grain-boundary-mediated plasticity.
Supercell configurations of STGBs for MD
MD simulations of the STGB energy and structure were based on a bicrystal model. The crystallographic character of an STGB is defined by two parameters: the tilt axis and tilt angle (2θ)[38].
In Figure 2, the selected tilt axis was the
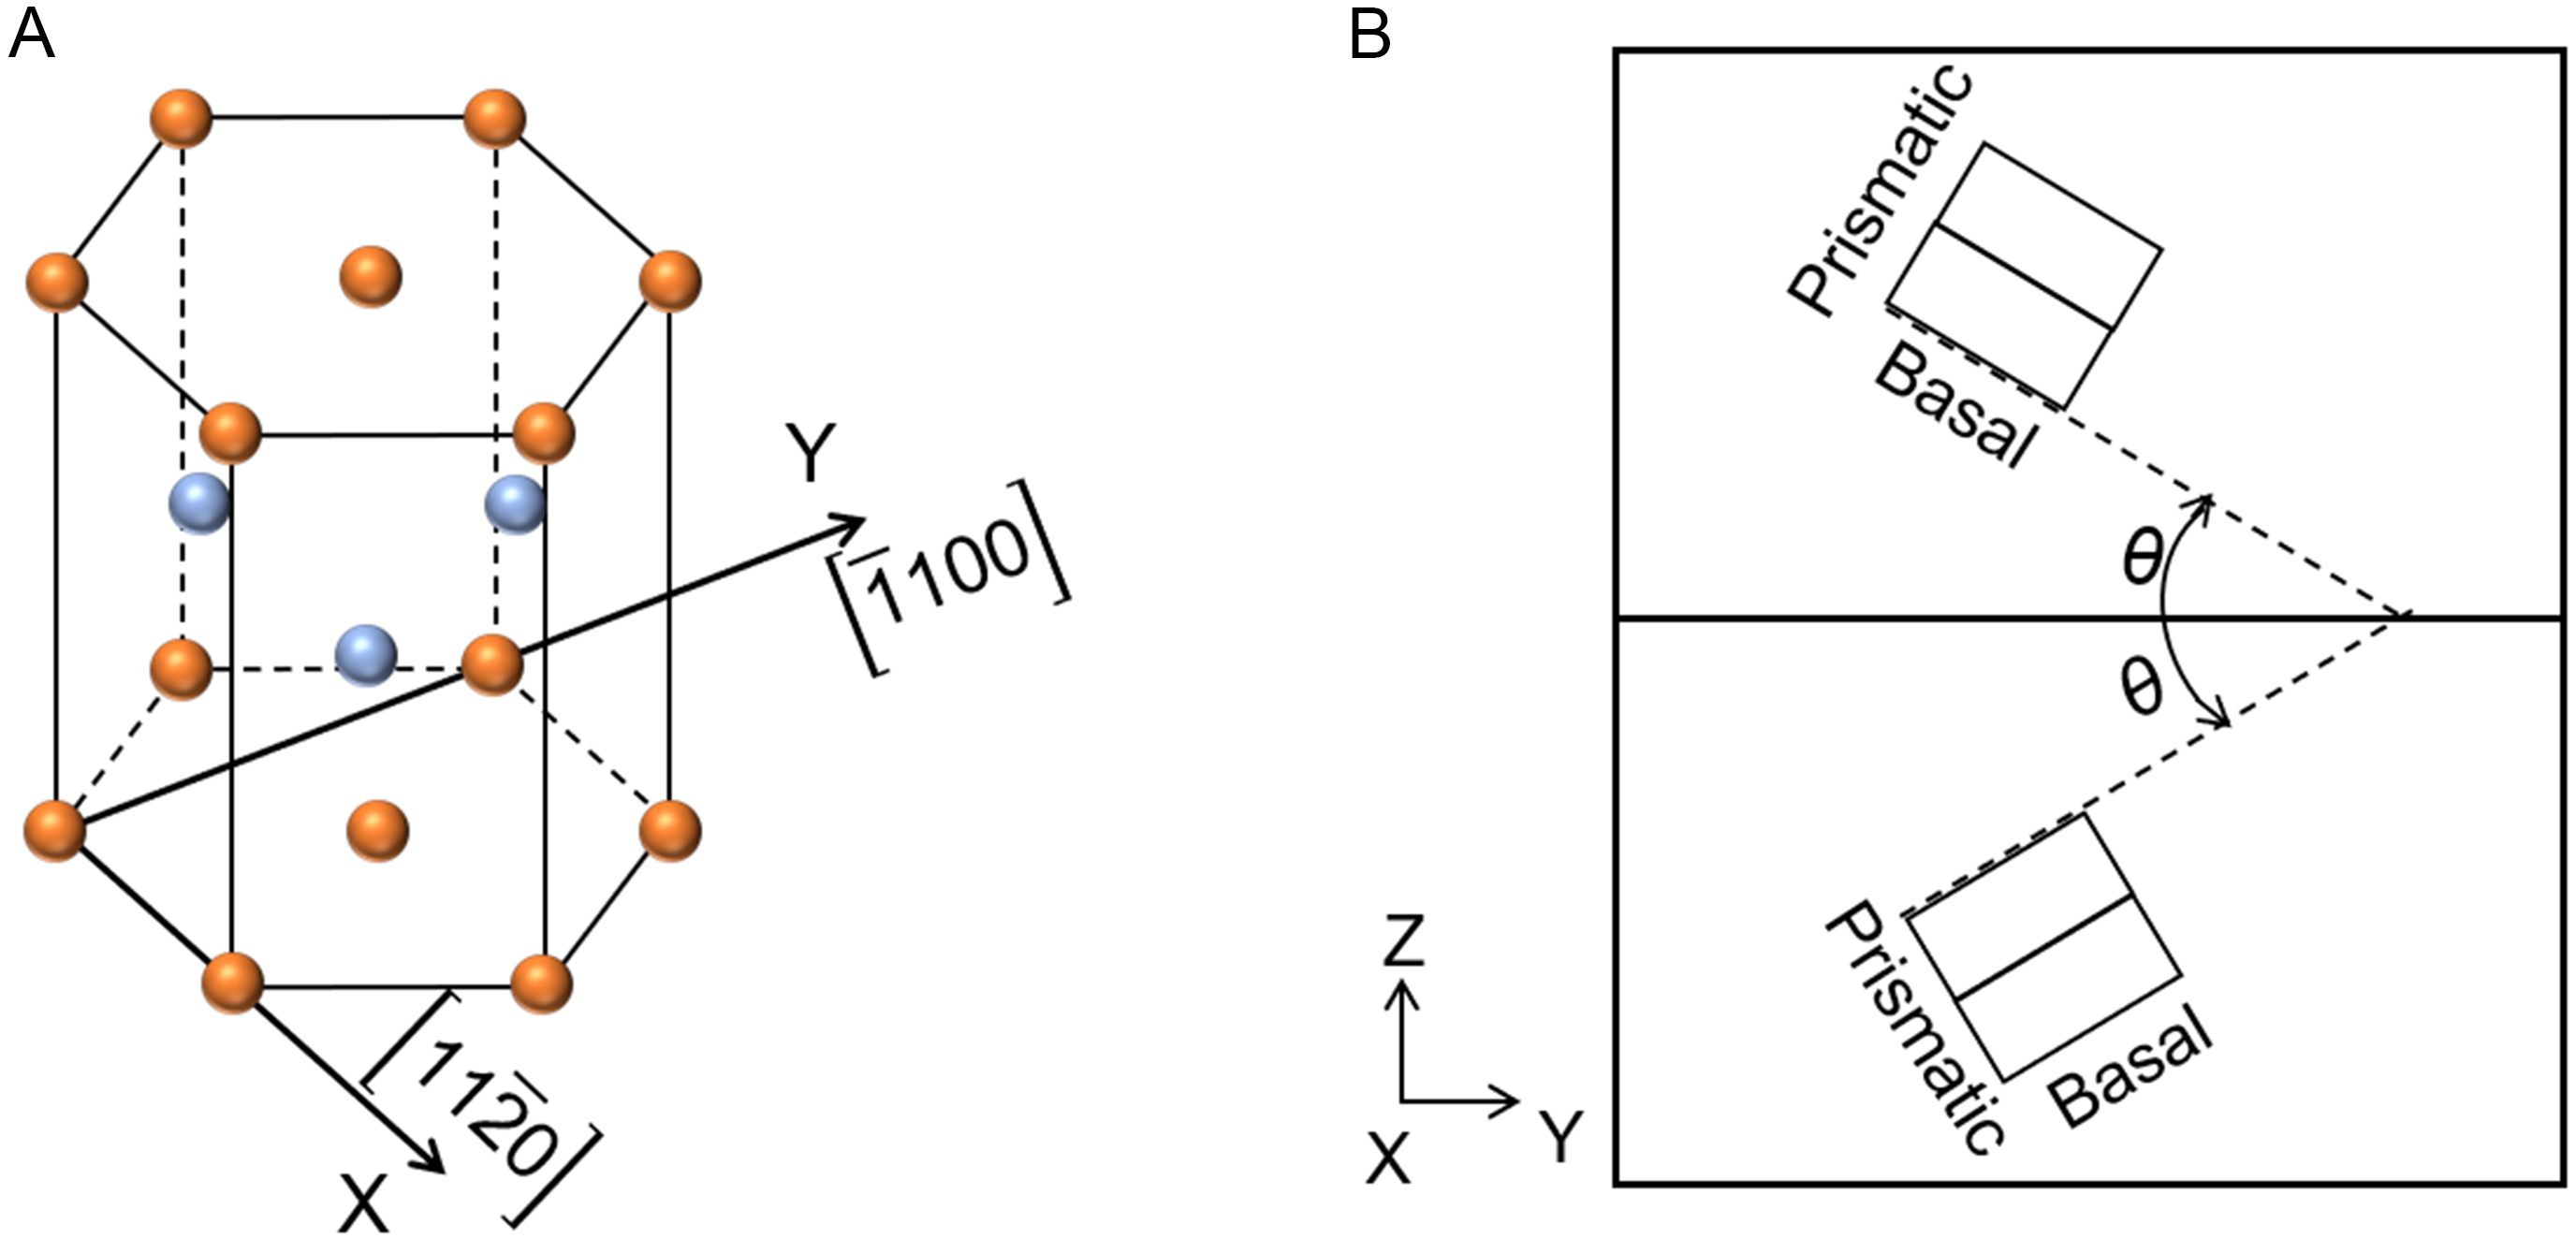
Figure 2. Schematic of (A) the HCP structure and (B) a bicrystal model containing a
MD simulation cell configurations of nano-sized columnar and multiple grains
A nano-sized columnar grain (semi-2D) simulation cell containing
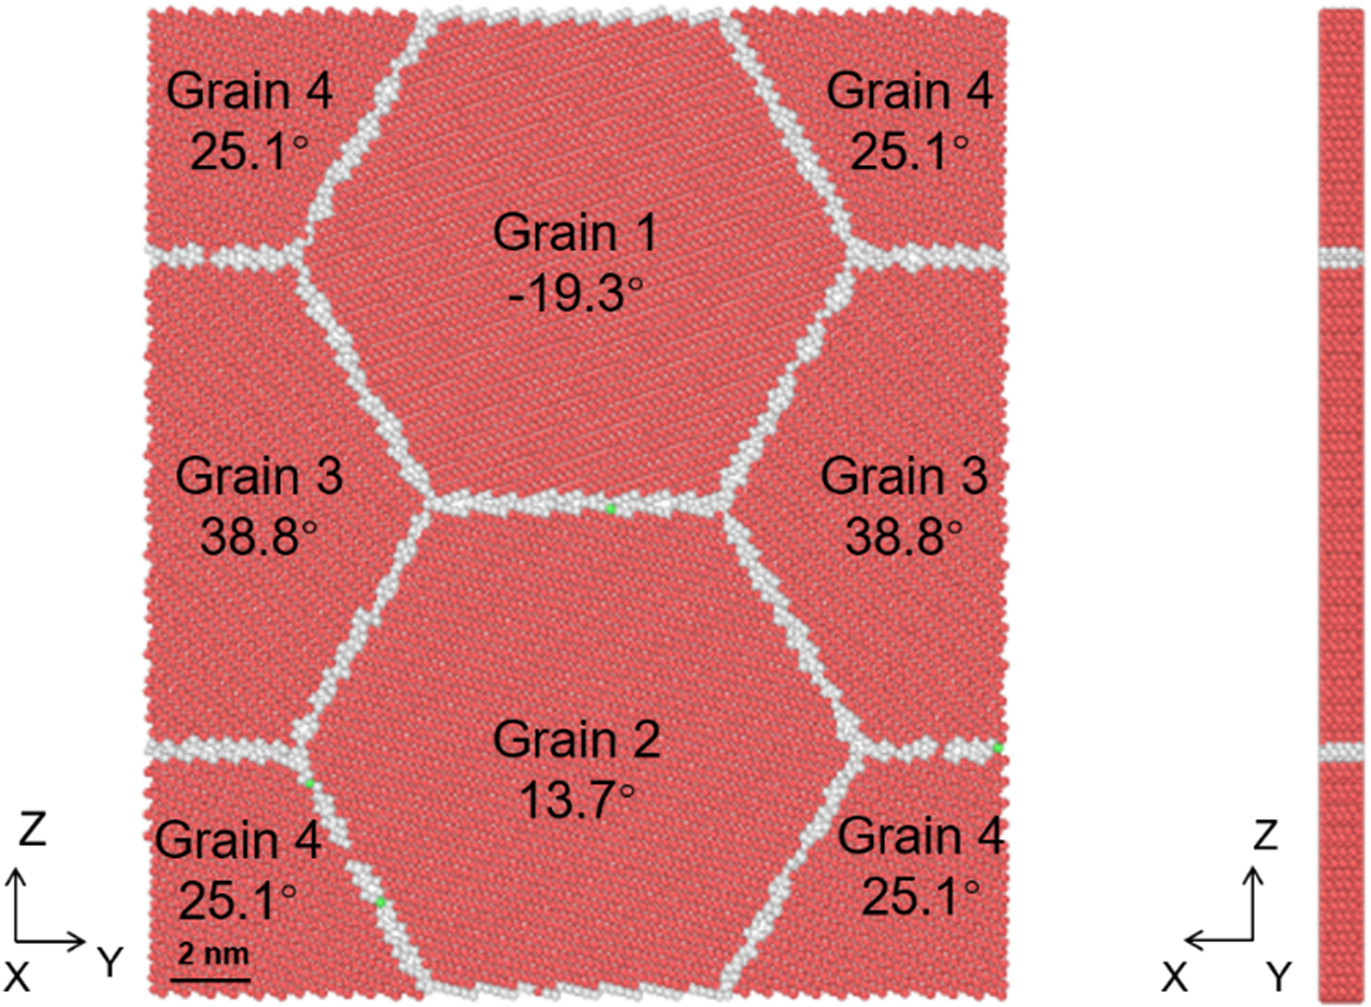
Figure 3. Atomic structure of
A nanopolycrystalline (3D) model was also constructed using Atomsk. Figure 4 illustrates the atomic structure of the Zn system. PBCs were applied in all directions. The simulation cell (10 × 10 × 20 nm3) contained 12 randomly oriented nanograins, totaling 131,744 atoms (31,927 GB atoms), with an average grain size of 6.8 nm. Due to random orientation, this model incorporated various general GB types. For comparison, analogous nanopolycrystalline models for Mg and Be were constructed using identical dimensions and grain topology. These systems contained a total of 87,282 atoms (23,689 GB atoms) and 256,455 atoms (51,117 GB atoms), respectively. Tensile loading was applied to these models to analyze stress-strain responses and atomic structural evolution.
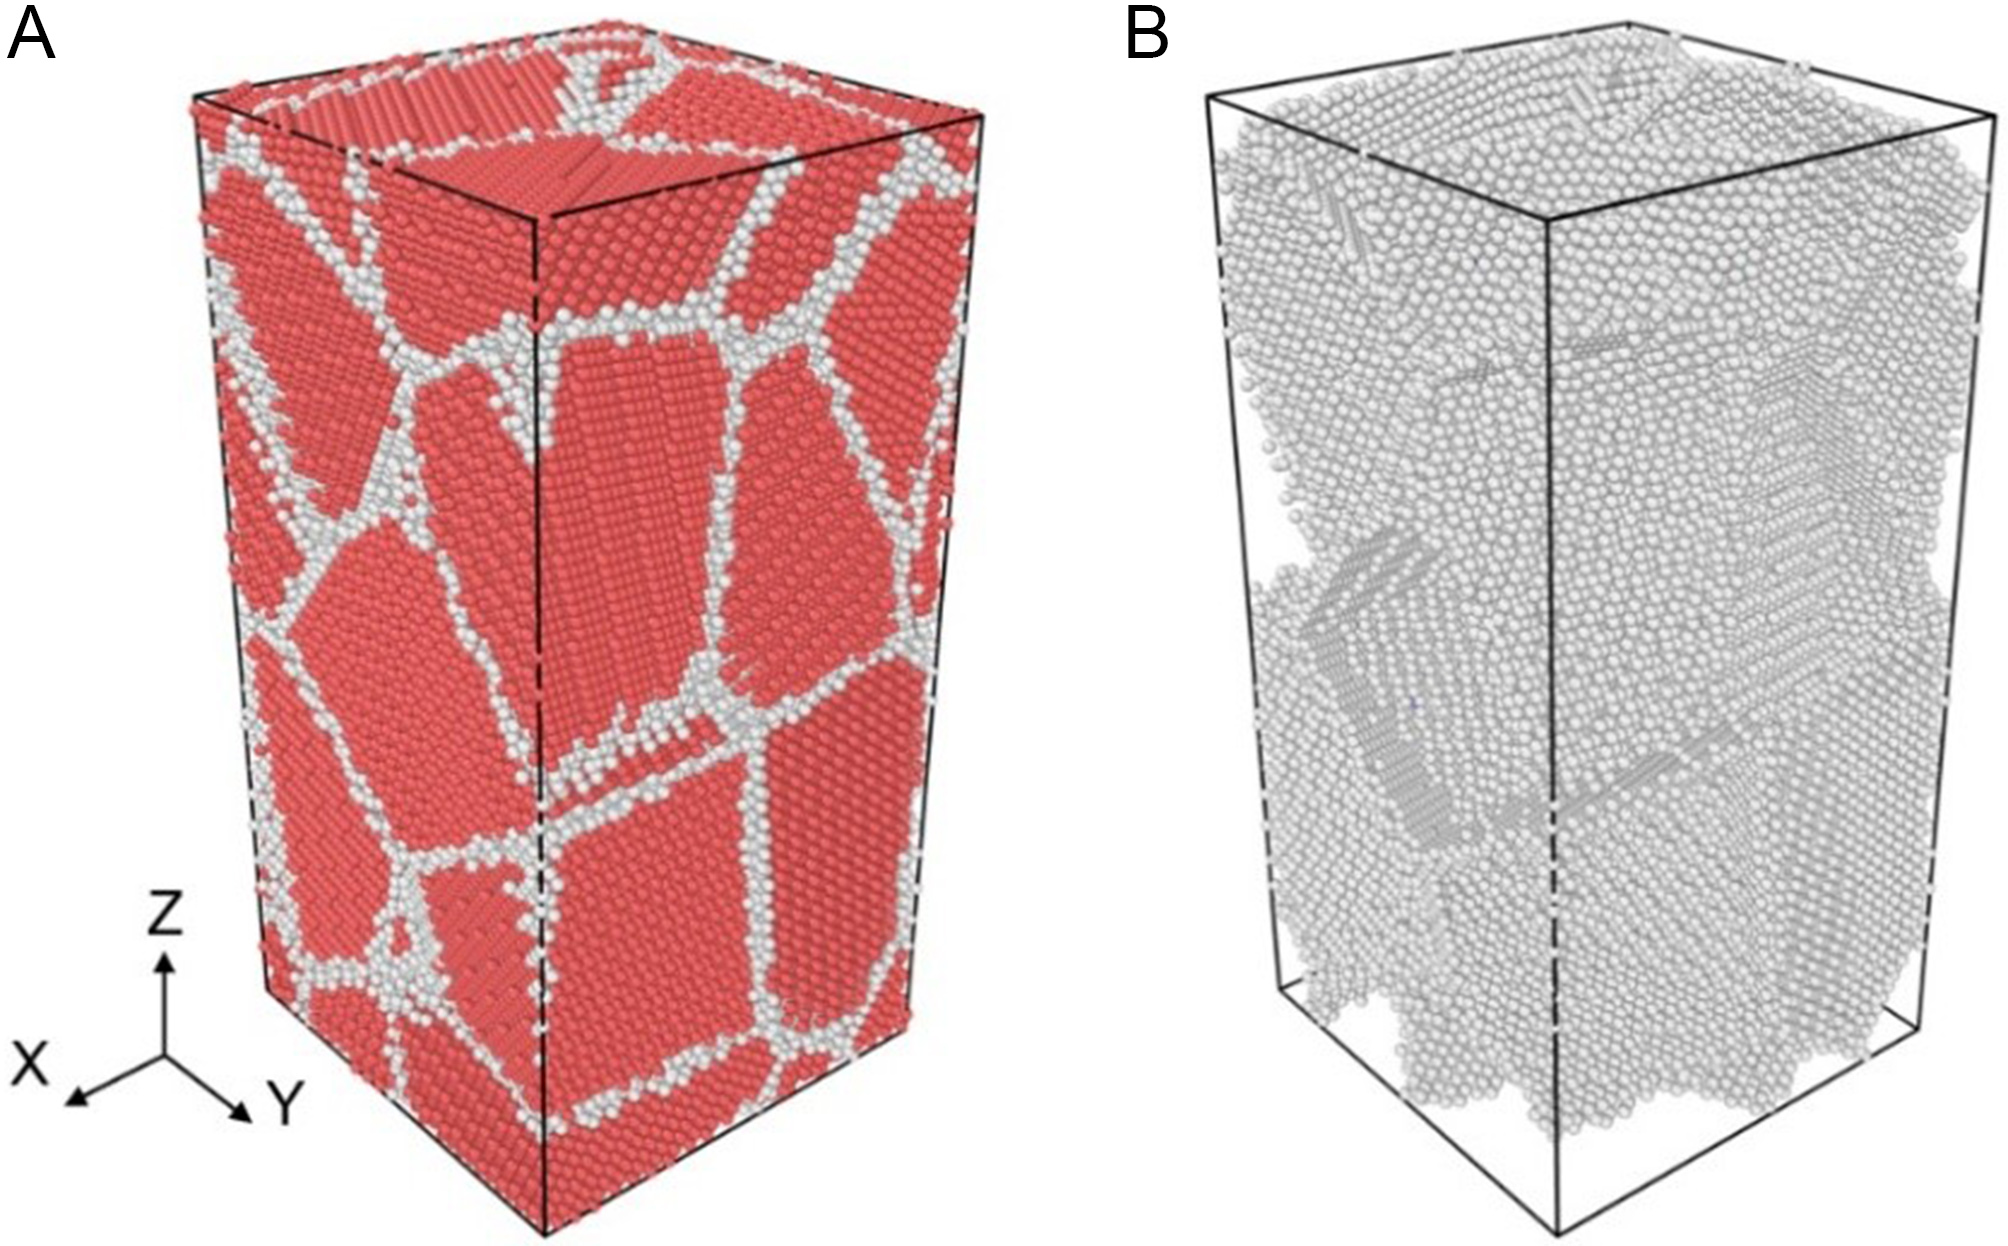
Figure 4. Atomic structure of (A) nanopolycrystalline (3D) model and (B) GB atomic distribution, where the red and white atoms represent HCP and GB atoms, respectively. 3D: Three-dimensional; GB: grain boundary; HCP: hexagonal close-packed.
Setup of MD simulations
MD simulations were performed using the LAMMPS code[42], with visualization through OVITO software[43]. For the bicrystal model, both the DP and Modified Embedded Atom Method (MEAM) potential[44] were used to compare GB energies and structures. The relaxation setups followed those used in a previous study on GBs in HCP Mg[45]. To prevent the system from being trapped in local energy minima, a three-stage relaxation process was adopted: (i) a rigid translation search in the X-Y plane with a grid spacing of 0.025 nm to optimize relative grain positions and interfacial separation; (ii) thermal annealing at 300 K (NPT ensemble) for full atomic relaxation; and (iii) quenching from 300 to 1 K over 20 ps to obtain the ground-state structure. Structural optimization was considered converged when the maximum force on any atom fell below 5 pN.
The DeePMD method[18] was employed to investigate the mechanical responses of columnar grain (2D) and nanopolycrystalline (3D) pure HCP Zn at room temperature (300 K). The relaxation process followed the same procedure as that of bicrystal models. After equilibration at 300 K (NPT), uniaxial tensile loading was applied to a maximum strain of 30%. Strain rates of 1 × 10¹⁰, 1 × 10⁹, and 5 × 10⁸ s-1 were applied to the columnar grain models, while 1 × 10¹⁰ s-1 was used for nanopolycrystalline models. The time step was set to
RESULTS AND DISCUSSION
Evaluation of accuracy and performance of Deep Potential for Zn
Figure 5 compares the energies and forces predicted by the DP model with DFT calculations for the 21,505 training samples. The energy is defined as the per-atom energy in supercells with varying lattice constants and structures, while force components are evaluated along the X, Y, and Z directions. The DP predictions show excellent agreement with DFT results, yielding a root mean square error (RMSE) of 2.4 meV/atom for energy and 18.9 meV/Å for force. The dense distribution of data points along the diagonal confirms that the training data is reproduced with high fidelity and that the DP model accurately captures the underlying potential energy surface.
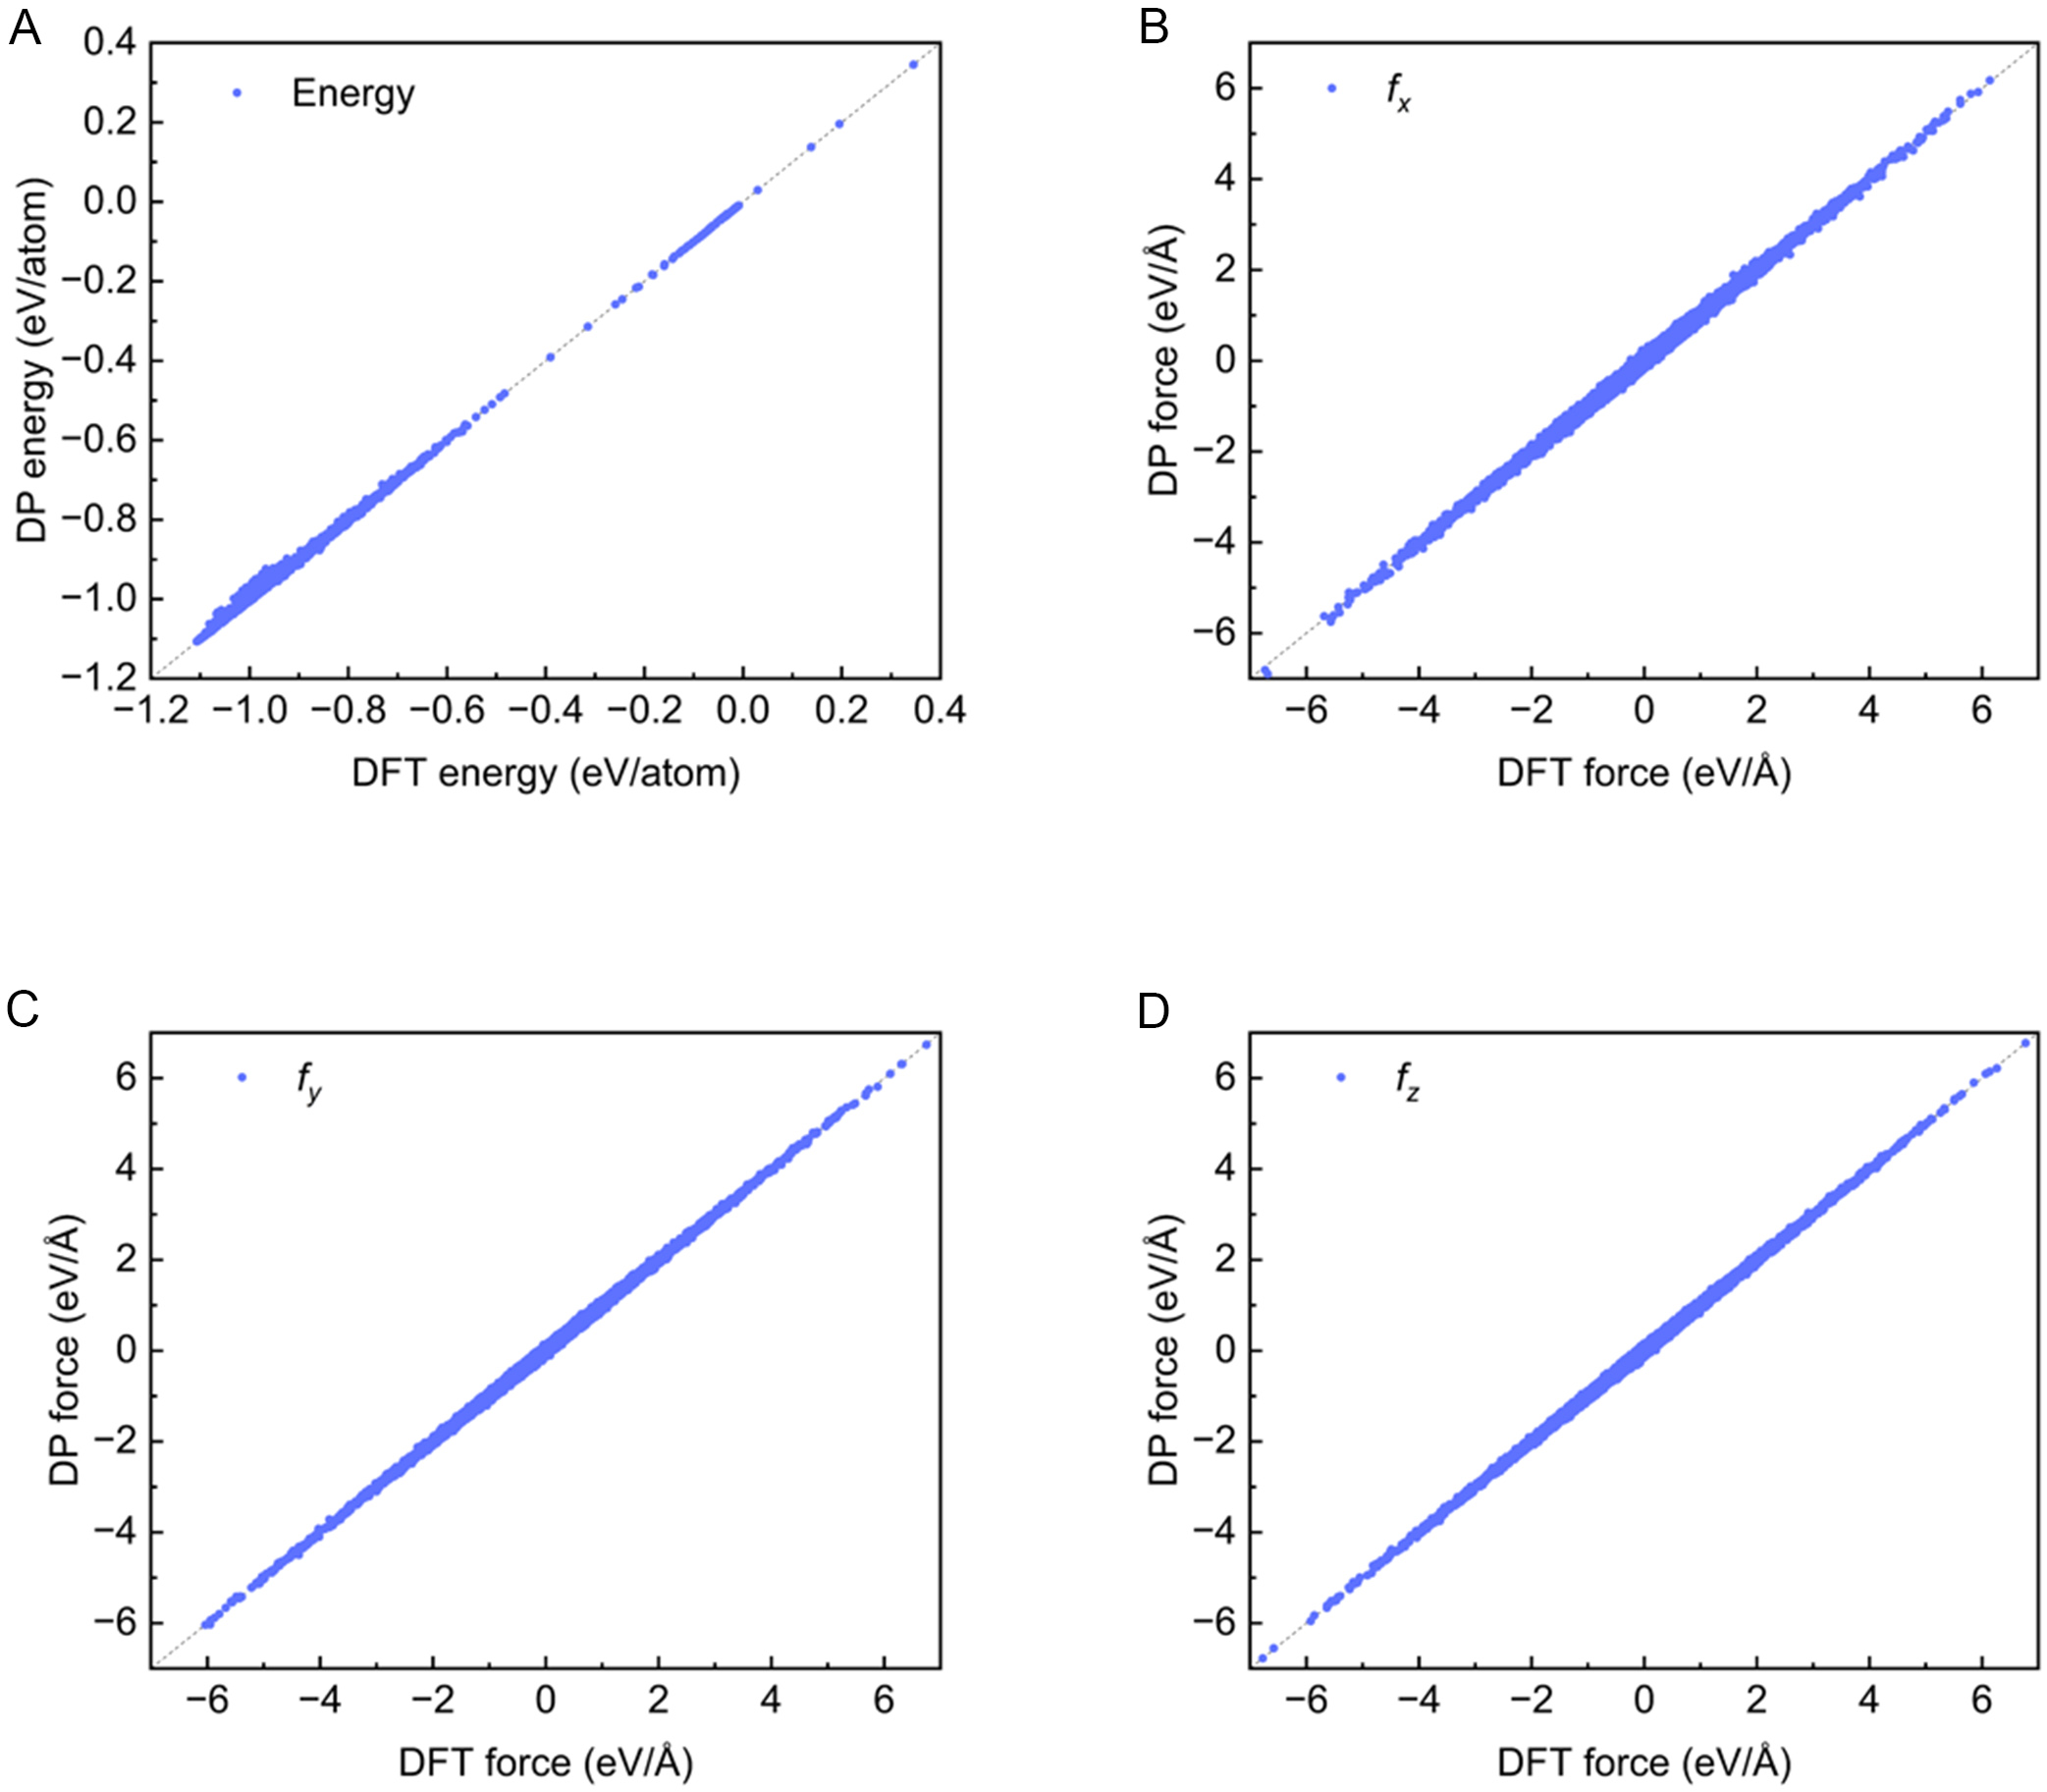
Figure 5. DP model predictions of (A) energies and (B-D) force components for all structures in the training dataset versus DFT calculations. DP: Deep Potential; DFT: Density Functional Theory.
The intrinsic properties of Zn calculated by the DP model are presented in Table 1, alongside the values from DFT, experiments, MEAM, and other MLIPs developed by Nitol et al. [artificial neural network (ANN)][48] and Mei et al. [moment tensor potential (MTP)][49]. The lattice constants predicted by DP are a = 2.65 Å and c/a = 1.92, aligning closely with DFT, ANN, and MTP values. In contrast, the MEAM potential[44] predicts a significantly lower c/a ratio of 1.62. Furthermore, the elastic constants (Cij) calculated by DP are 176.4, 46.5, 47.3, 63.6, and 33.8 GPa, respectively. These values match DFT and experimental benchmarks more closely than those from MEAM, ANN, and MTP models. The surface energies for the (0001),
Comparison of fundamental properties of Zn from DFT, experimental data, and different potentials, respectively
| Properties | DFT-PBE | DFT-PBEsol[48] | MEAM[44] | ANN[48] | MTP[49] | DP | Exp. |
| a (Å) | 2.65 | 2.62 | 2.78 | 2.65 | 2.64 | 2.65 | 2.66[50] |
| c (Å) | 5.07 | 4.74 | 4.50 | 4.81 | 5.10 | 5.07 | 4.95[50] |
| c/a | 1.92 | 1.81 | 1.62 | 1.81 | 1.94 | 1.92 | 1.86[50] |
| Ec (eV) | -1.11 | -1.31 | -1.09 | -1.35 | -1.35 | -1.11 | -1.35[50] |
| ΔEHCP→FCC (eV) | 0.028 | 0.025 | 0.0092 | 0.025 | 0.025 | 0.023 | - |
| ΔEHCP→BCC (eV) | 0.089 | 0.092 | 0.079 | 0.089 | 0.089 | 0.084 | - |
| C11 (GPa) | 177.7 | 217.38 | 133.4 | 175.52 | 170.4 | 176.4 | 163.0[51] |
| C12 (GPa) | 45.8 | 43.96 | 47.0 | 79.41 | 51.5 | 46.5 | 30.6[51] |
| C13 (GPa) | 39.3 | 58.59 | 41.5 | 63.15 | 42.3 | 47.3 | 48.1[51] |
| C33 (GPa) | 59.7 | 79.56 | 122.4 | 76.28 | 76.8 | 63.6 | 60.3[51] |
| C44 (GPa) | 23.6 | 46.35 | 34.1 | 32.21 | 18.1 | 33.8 | 39.4[51] |
| | 0.85 | 0.61 | 0.44 | 0.72 | 0.49 | 0.84 | 0.54[51] |
| Eoct (eV) | 1.33 | 1.04 | 2.66 | 1.02 | 1.22 | 1.42 | - |
| Esurf (0001) (mJ/m2) | 412 | 478.3 | 446 | 463.5 | 424.0 | 407.2 | - |
| Esurf | 897 | 1547.3 | 433 | 1485.0 | 835.0 | 810.8 | - |
| Esurf | 1112 | - | 461 | - | 1031.0 | 1007.8 | - |
| | 50 | 64.84 | 41.6 | 70.39 | 19 | 51.0 | - |
| | 116 | 120.14 | 169.4 | 123.29 | 36 | 102.8 | |
| Tmelt (K) | - | - | 690 | 558.59 | 542 | 697 | 692[50] |
Figure 6A shows the cohesive energy-volume curves for the HCP Zn structure predicted by MEAM, ANN, and DP models. All curves exhibit the characteristic potential well shape. DP predictions agree remarkably well with DFT results, outperforming the ANN model. In contrast, the MEAM deviates from the DFT benchmark when the volume exceeds 20 Å3. Figure 6B confirms that the ground state predicted by DP is correctly identified as the HCP structure. The energy differences for HCP→FCC and HCP→BCC transformations are 0.023 and 0.084 eV, closely matching the DFT values of 0.028 and 0.089 eV, respectively.
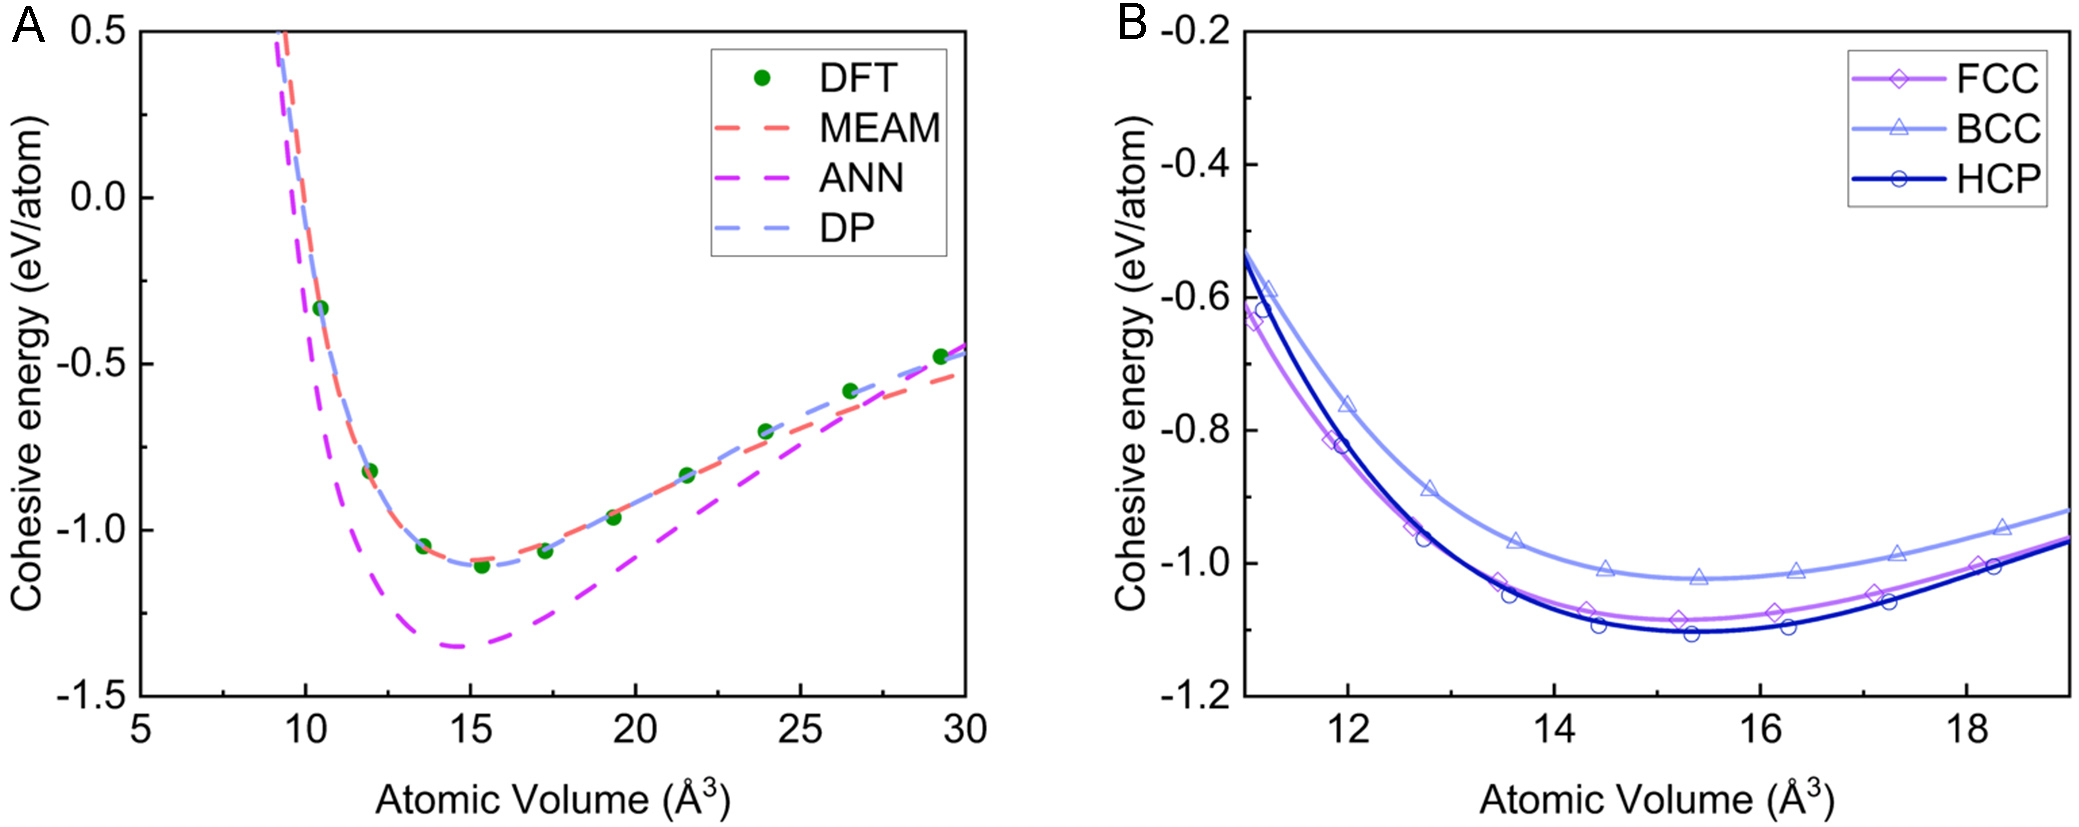
Figure 6. (A) Cohesive energy as a function of atomic volume for HCP structure and (B) cohesive energy for BCC, FCC, and HCP structures using the DP model. HCP: Hexagonal close-packed; BCC: body-centered cubic; FCC: face-centered cubic; DP: Deep Potential; DFT: Density Functional Theory; MEAM: Modified Embedded-Atom Method; ANN: artificial neural network.
To further assess the reliability of the DP model, the phonon dispersion curves were calculated and compared with PBE-based DFT results, the MEAM potential[44], the ANN model[48], and experimental data[52], as shown in Figure 7. These curves reflect the thermal vibrational properties of the system. Phonon calculations for DP, MEAM, and ANN potentials were performed using Phonopy[53] based on the finite displacement method[54] on a 6 × 6 × 6 supercell (432 atoms). In contrast, DFT results were obtained using density functional perturbation theory (DFPT)[55-57] on a 2 × 2 × 2 supercell. The phonon dispersion predicted by DP shows excellent agreement with the DFT results. This contrasts with the MEAM potential, where phonon branches along the Γ→M→K and A→L→H paths deviate significantly from DFT benchmarks. Additionally, since the ANN dataset was originally generated using PBEsol[48], its phonon dispersion curves deviate notably from the DFT (PBE) results, as shown in Figure 7C.
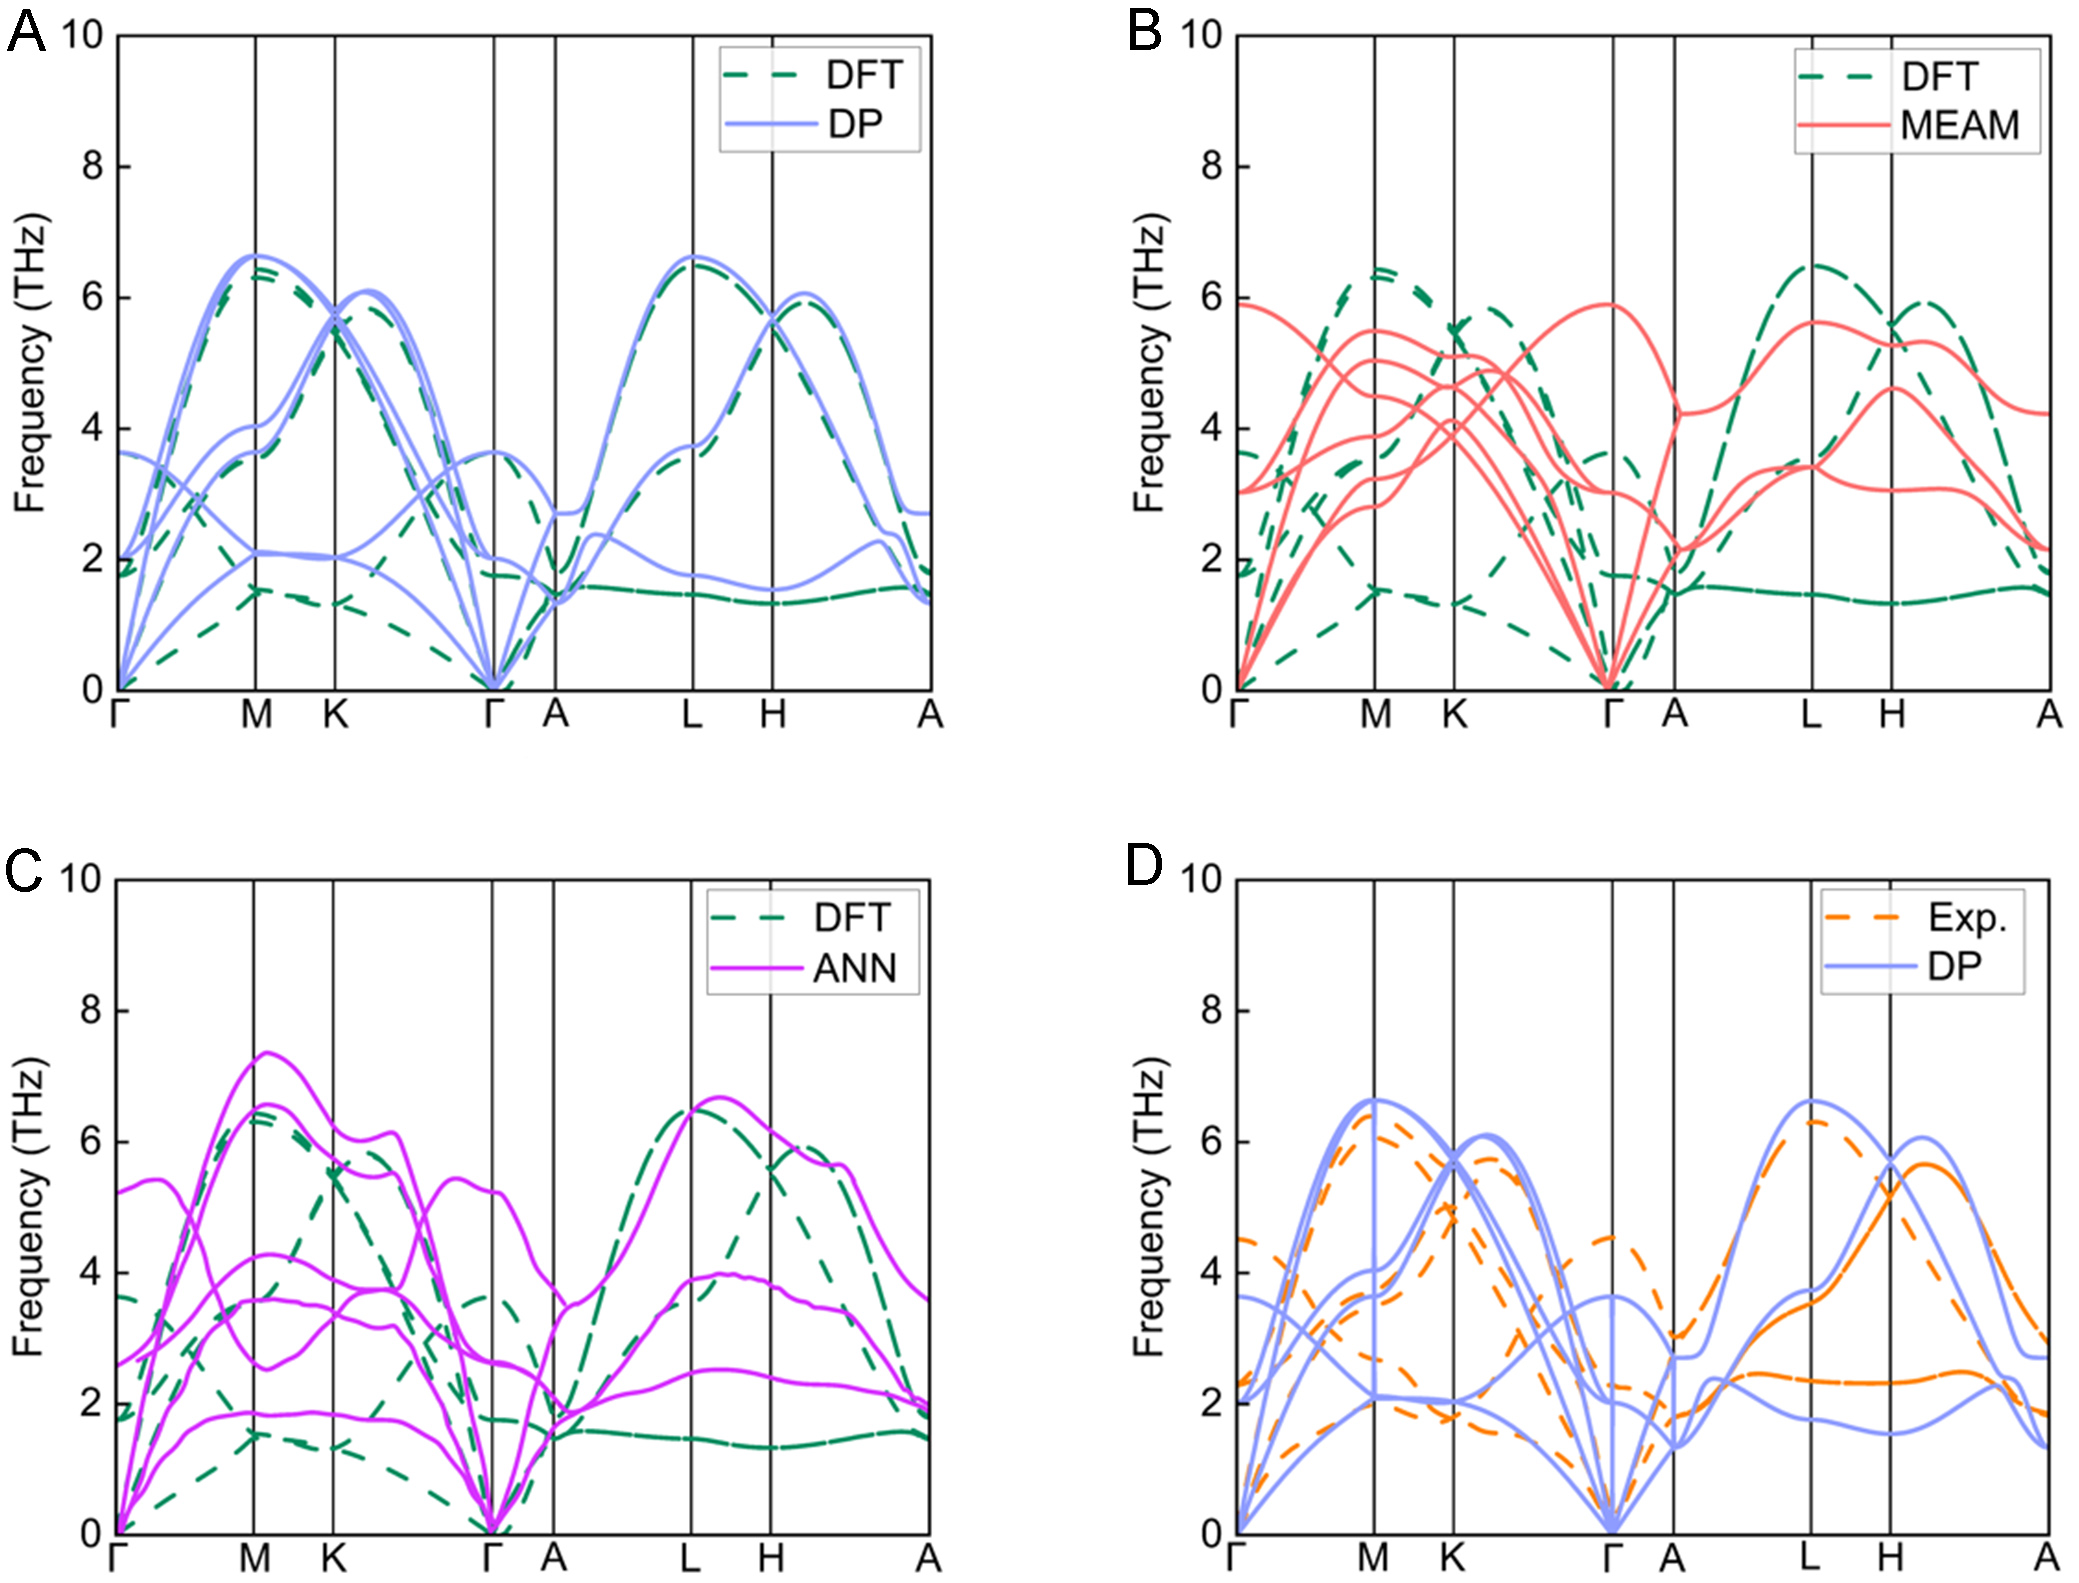
Figure 7. Comparison of the phonon dispersion of HCP Zn calculated from (A) DP, (B) MEAM, and (C) ANN, compared with the DFT (PBE) and (D) experimental values. HCP: Hexagonal close-packed; DP: Deep Potential; MEAM: Modified Embedded-Atom Method; ANN: artificial neural network; DFT: Density Functional Theory; PBE: Perdew-Burke-Ernzerhof; Exp.: experimental.
Furthermore, the GB energies of typical TBs in HCP Zn were also calculated to validate the DP model. When the 2θ is 72.4°, 95.2°, and 131.0°, they correspond to the
where UGB is the potential energy of the system containing GBs, U0 is the potential energy of the bulk material, and A is the GB area.
The energies of various TBs calculated by MEAM[44], ANN[48], and DP are listed in Table 2, along with reference DFT values[58,59]. The results indicate that the
Comparison of twin boundary energies of Zn from the MEAM, ANN, DP, and two DFTs
The primary goal of this work is to investigate STGBs across the full range of tilt angles. Conducting such extensive screening with DFT is computationally infeasible due to system size limitations. The DeePMD-kit implements a unique compression algorithm that increases simulation speed by over 10 times and supports system sizes up to 20 times larger than other MLIPs like ANN[60]. Consequently, MEAM is selected as the primary classical reference for comparison across the full STGB range, highlighting the DP model’s superior balance of DFT-level accuracy and the computational efficiency required for large-scale screening.
In Figure 8, a comprehensive comparison of atomic structures at three TBs is provided. For the
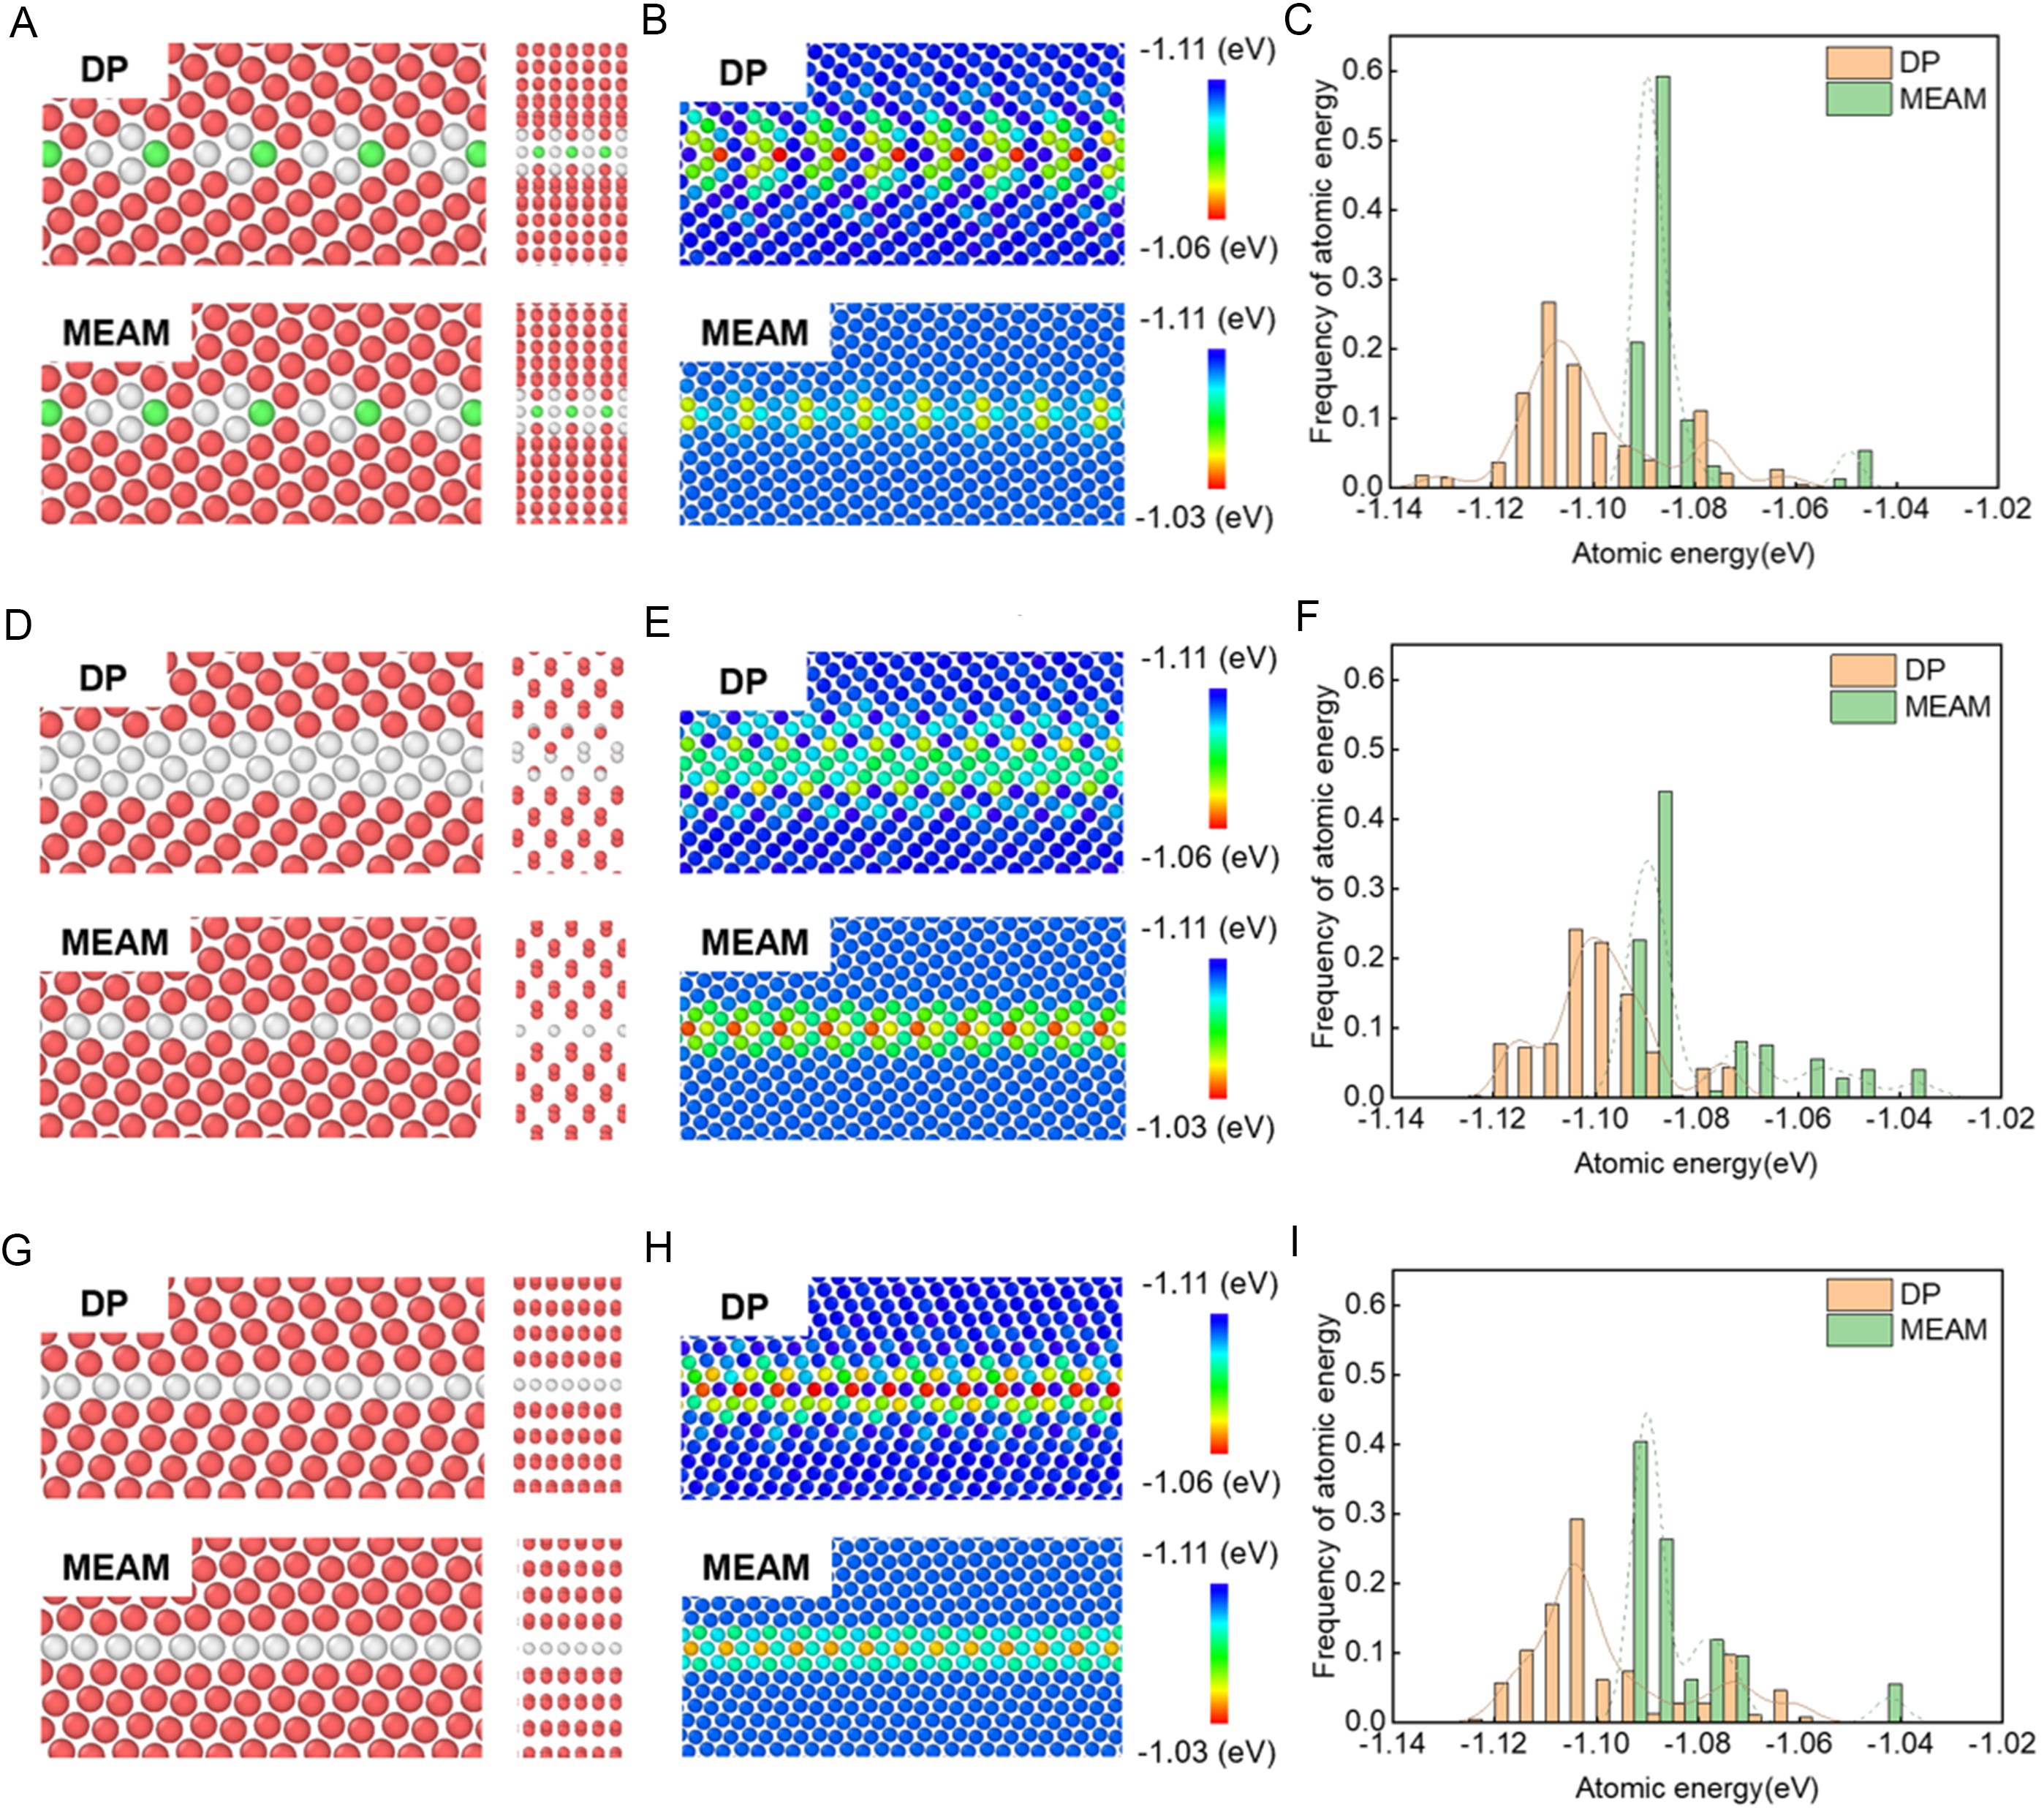
Figure 8. Atomic structure, atomic energy and energy distribution histograms of (A-C)
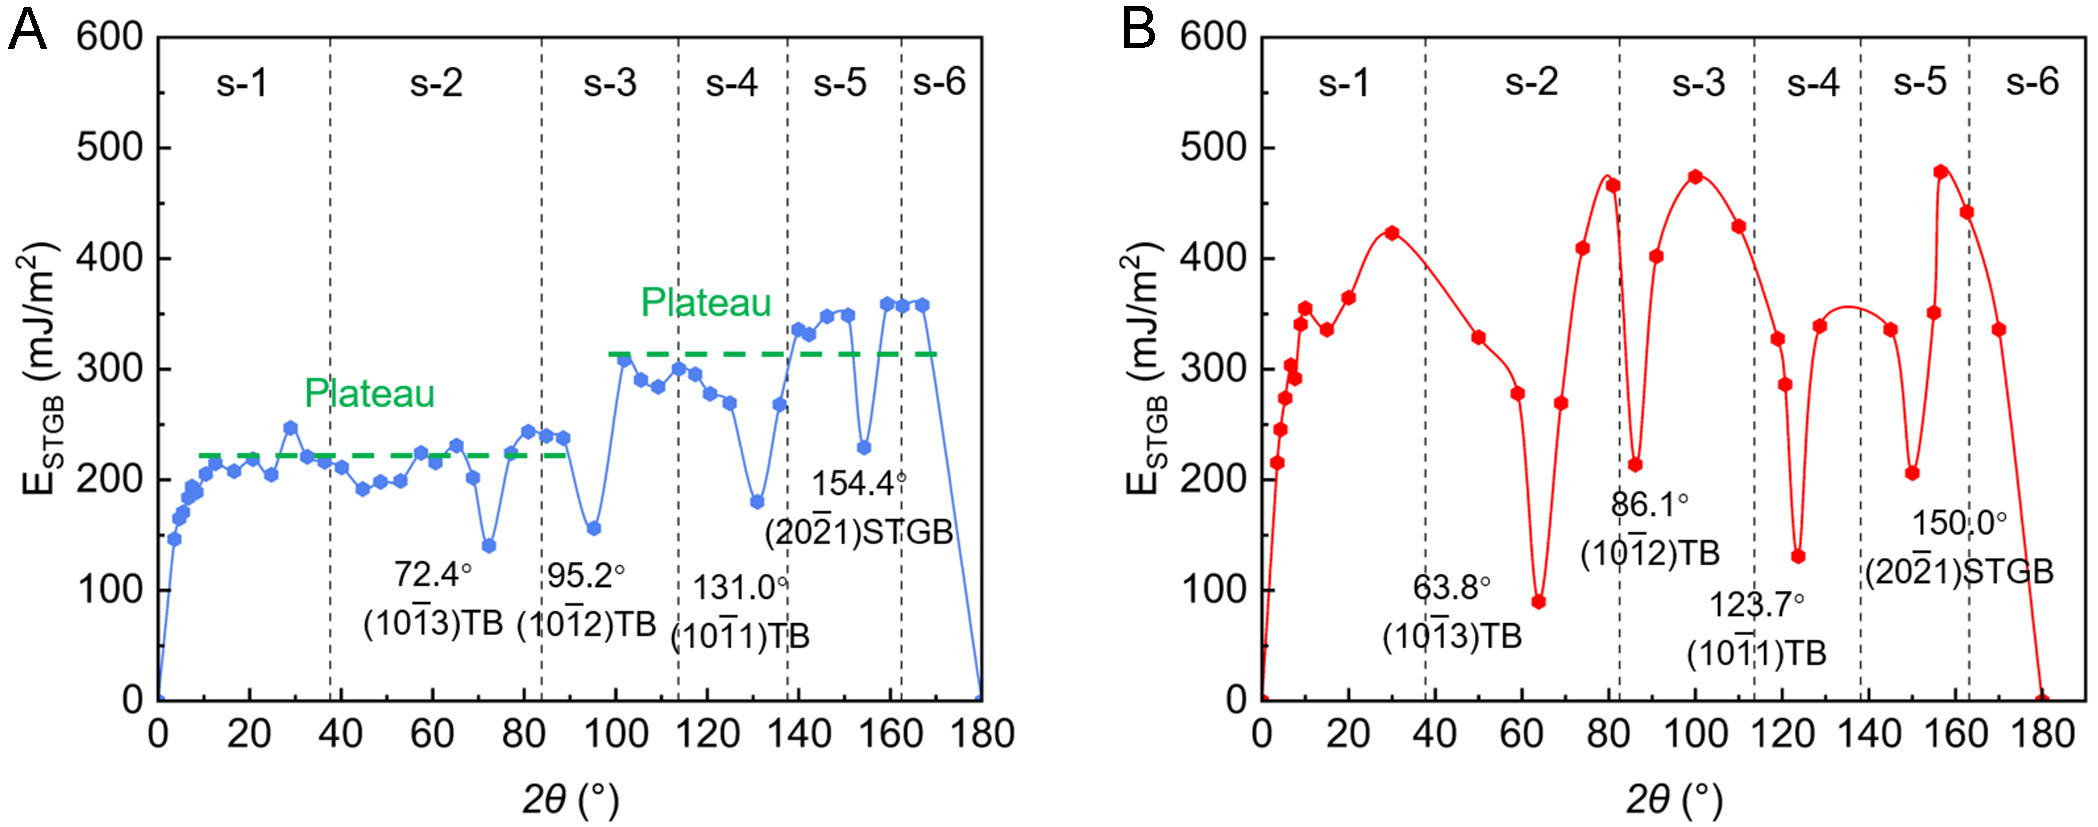
Figure 9. Variation of grain boundary energy (ESTGB) with the tilt angle (2θ) predicted from (A) DeePMD and (B) MEAM-MD. STGB: Symmetrical tilt grain boundary; DeePMD: Deep Potential molecular dynamics; MEAM: Modified Embedded-Atom Method; MD: molecular dynamics; TB: twin boundary.
In summary, the developed DP model exhibits high fidelity in reproducing the fundamental properties of Zn, including lattice constants, elastic moduli, and phonon dispersion, showing excellent agreement with DFT data. Crucially, it accurately describes defect energetics such as surface, stacking fault, and GB energies, significantly outperforming the classical MEAM potential. This validates the DP model as a robust and reliable tool for the subsequent investigation of GB-mediated plasticity in Zn.
GB energy and structure of STGBs with different tilt angles
STGB energy analysis
In this section, MD simulations are employed to compute the STGB energies (ESTGB) over the range of 0° < 2θ < 180° using DP and MEAM[44]. The predicted GB energies are presented in Figure 9. Overall, the GB energies calculated by MEAM are significantly higher than those from DP. Based on the variation of GB energy with respect to 2θ, the GBs can be categorized into six distinct regions, each associated with specific crystallographic features: (s-1) low-angle STGBs (0° < 2θ ≤ 38°); (s-2) the
In Figure 9A, when the tilt angle 2θ is in the range of 10°~90° (covering regions s-1 and s-2), the STGB energy remains on a relatively stable plateau, with fluctuations of only 27.6 mJ/m2 (excluding the TB cusp). As 2θ increases further into the range of 96° < 2θ < 170° (regions s-3 to s-6), the energy plateaus rise to a higher stage with energetic fluctuation of 45.4 mJ/m2. In contrast, the STGB energy predicted by MEAM does not display this stepwise pattern but instead varies strongly with 2θ, as shown in Figure 9B. This comparison demonstrates that the DP model captures smooth, stable energy plateaus, distinctly different from MEAM predictions.
Atomic structure analysis of STGBs
Since low- and high-angle GBs exhibit different structural characteristics, the STGBs were classified into two categories. The common neighbor analysis (CNA)[61] method was employed to quantitatively analyze the atomic structures of these interfaces.
Given that DP predictions show superior agreement with DFT benchmarks compared to MEAM (as discussed in Section 3.1 “Evaluation of accuracy and performance of Deep Potential for Zn”), the DP model was exclusively selected to analyze
● Atomic structure of low-angle STGBs (0° < 2θ < 10°)
Figure 10 shows typical atomic structures of low-angle tilt GBs as predicted by the DP model. The GBDs, belonging to the 1/2<0001> type, are uniformly distributed and spontaneously dissociate into two 1/6<2203> partials with an SF ribbon between them. For 2θ = 3.6°, 4.6°, and 5.4°, the distances between dislocation cores along the y-direction are 76.8 Å, 60.8 Å, and 51.7 Å, respectively. As 2θ increases, both GBD density and GB energy rise significantly. When 2θ reaches 7.4°, SFs emerge between adjacent dislocations, eventually forming a continuous large dislocation chain.
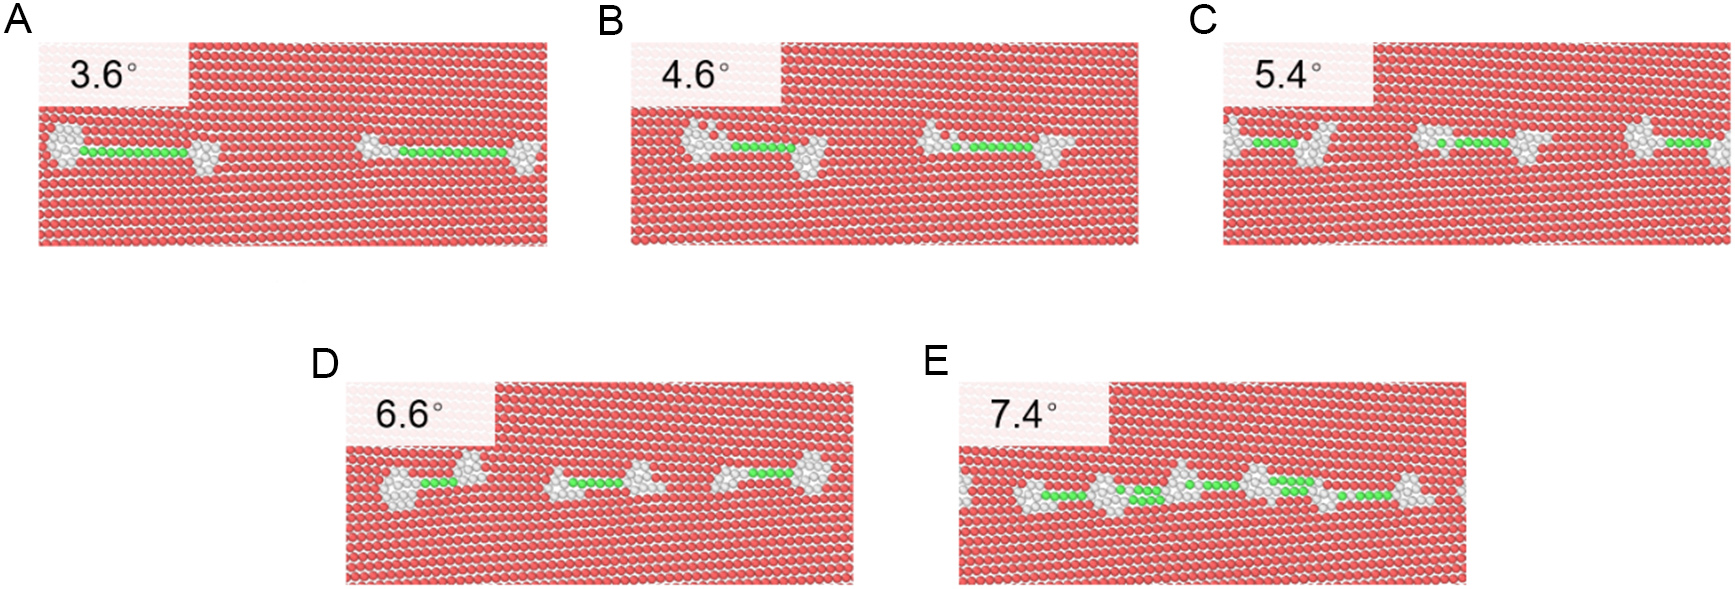
Figure 10. Atomic structure of the low-angle tilt (0° < 2θ < 10°) grain boundaries predicted from DeePMD, where red, green, and white atoms represent HCP, FCC, and other structures, respectively. The tilt angle 2θ is (A) 3.6°, (B) 4.6°, (C) 5.4°, (D) 6.6°, and (E) 7.4°, respectively. DeePMD: Deep Potential molecular dynamics; HCP: hexagonal close-packed; FCC: face-centered cubic.
● Atomic structure of high-angle STGBs (10° < 2θ < 180°)
Atomic structures of high-angle tilt GBs predicted from the DP model are presented in Figure 11.
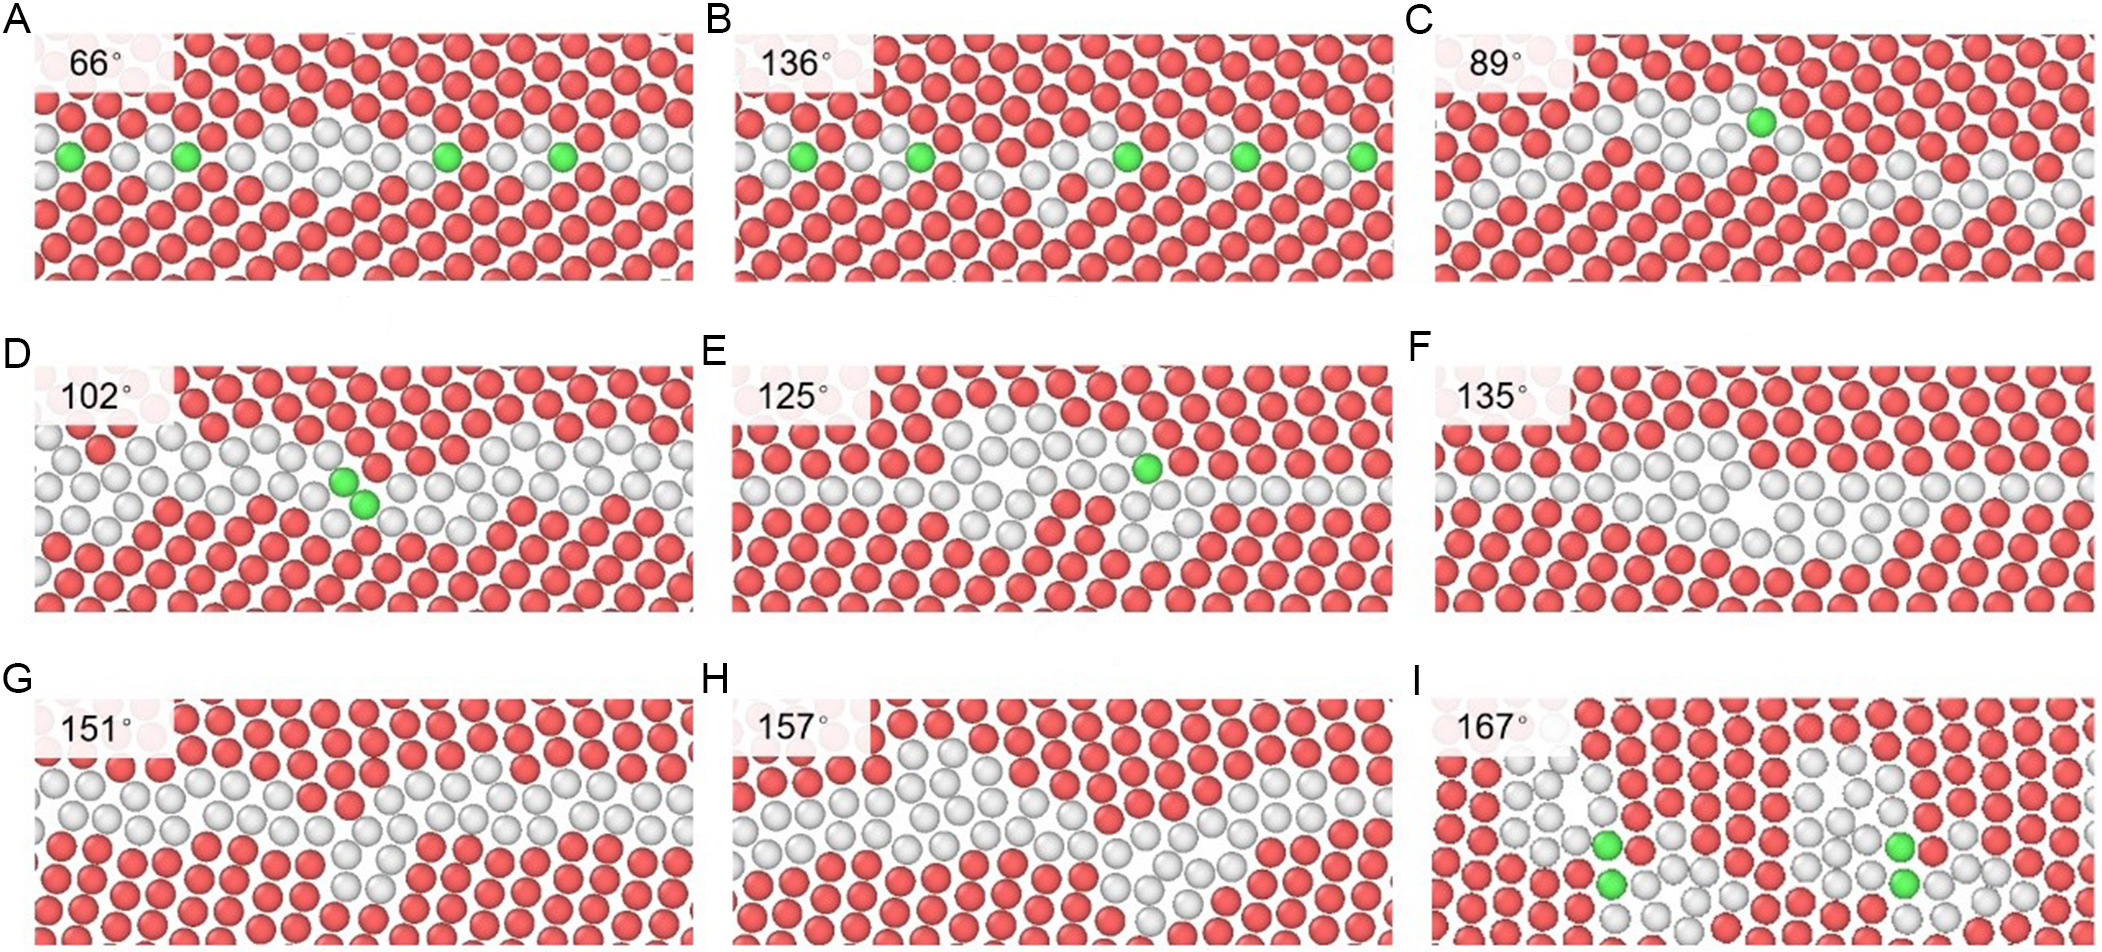
Figure 11. Atomic structure of high-angle tilt grain boundaries predicted from DeePMD, where red, green, and white atoms represent HCP, FCC, and other structures, respectively. The tilt angle 2θ is (A) 66°, (B) 136°, (C) 89°, (D) 102°, (E) 125°, (F) 135°, (G) 151°, (H) 157°, and (I) 167°. DeePMD: Deep Potential molecular dynamics; HCP: hexagonal close-packed; FCC: face-centered cubic.
(1) In the s-2 region (2θ = 67° and 76°), GBs consist mainly of well-ordered dislocation arrays with few extrinsic dislocations [Figure 11A and B]. Under these conditions, the GB energy remains low and stable due to weak dislocation interactions.
(2) In the s-3 region (2θ = 89° and 102°), dislocation density increases notably, leading to core overlap and irregular arrangements within the GB [Figure 11C and D]. This disorder is associated with the low symmetry of the
(3) In the s-4 region (2θ = 125° and 134°), GBs regain partial symmetry, and periodic dislocation clusters appear on the GB plane [Figure 11E and F]. This corresponds to the higher symmetry of the
(4) In the s-5 region (2θ = 151° and 157°), GBs exhibit a highly disordered and amorphous-like structure [Figure 11G and H].
(5) In the s-6 region (2θ = 167°), HCP-coordinated atoms (colored red) are interspersed within the interface, creating a fragmented arrangement, where discrete GBDs are no longer continuous [Figure 11I].
The observed energy plateaus are likely linked to specific microstructural descriptors, such as boundary excess free volume (BFV) and structural unit (SU) transformations. To investigate this, we analyzed the atomic ratios of GB and stacking fault (SF) atoms (representing GBD cores) as well as the BFV for various tilt angles using both DP and MEAM potentials, as shown in Figure 12. The BFV was calculated as follows[62]:
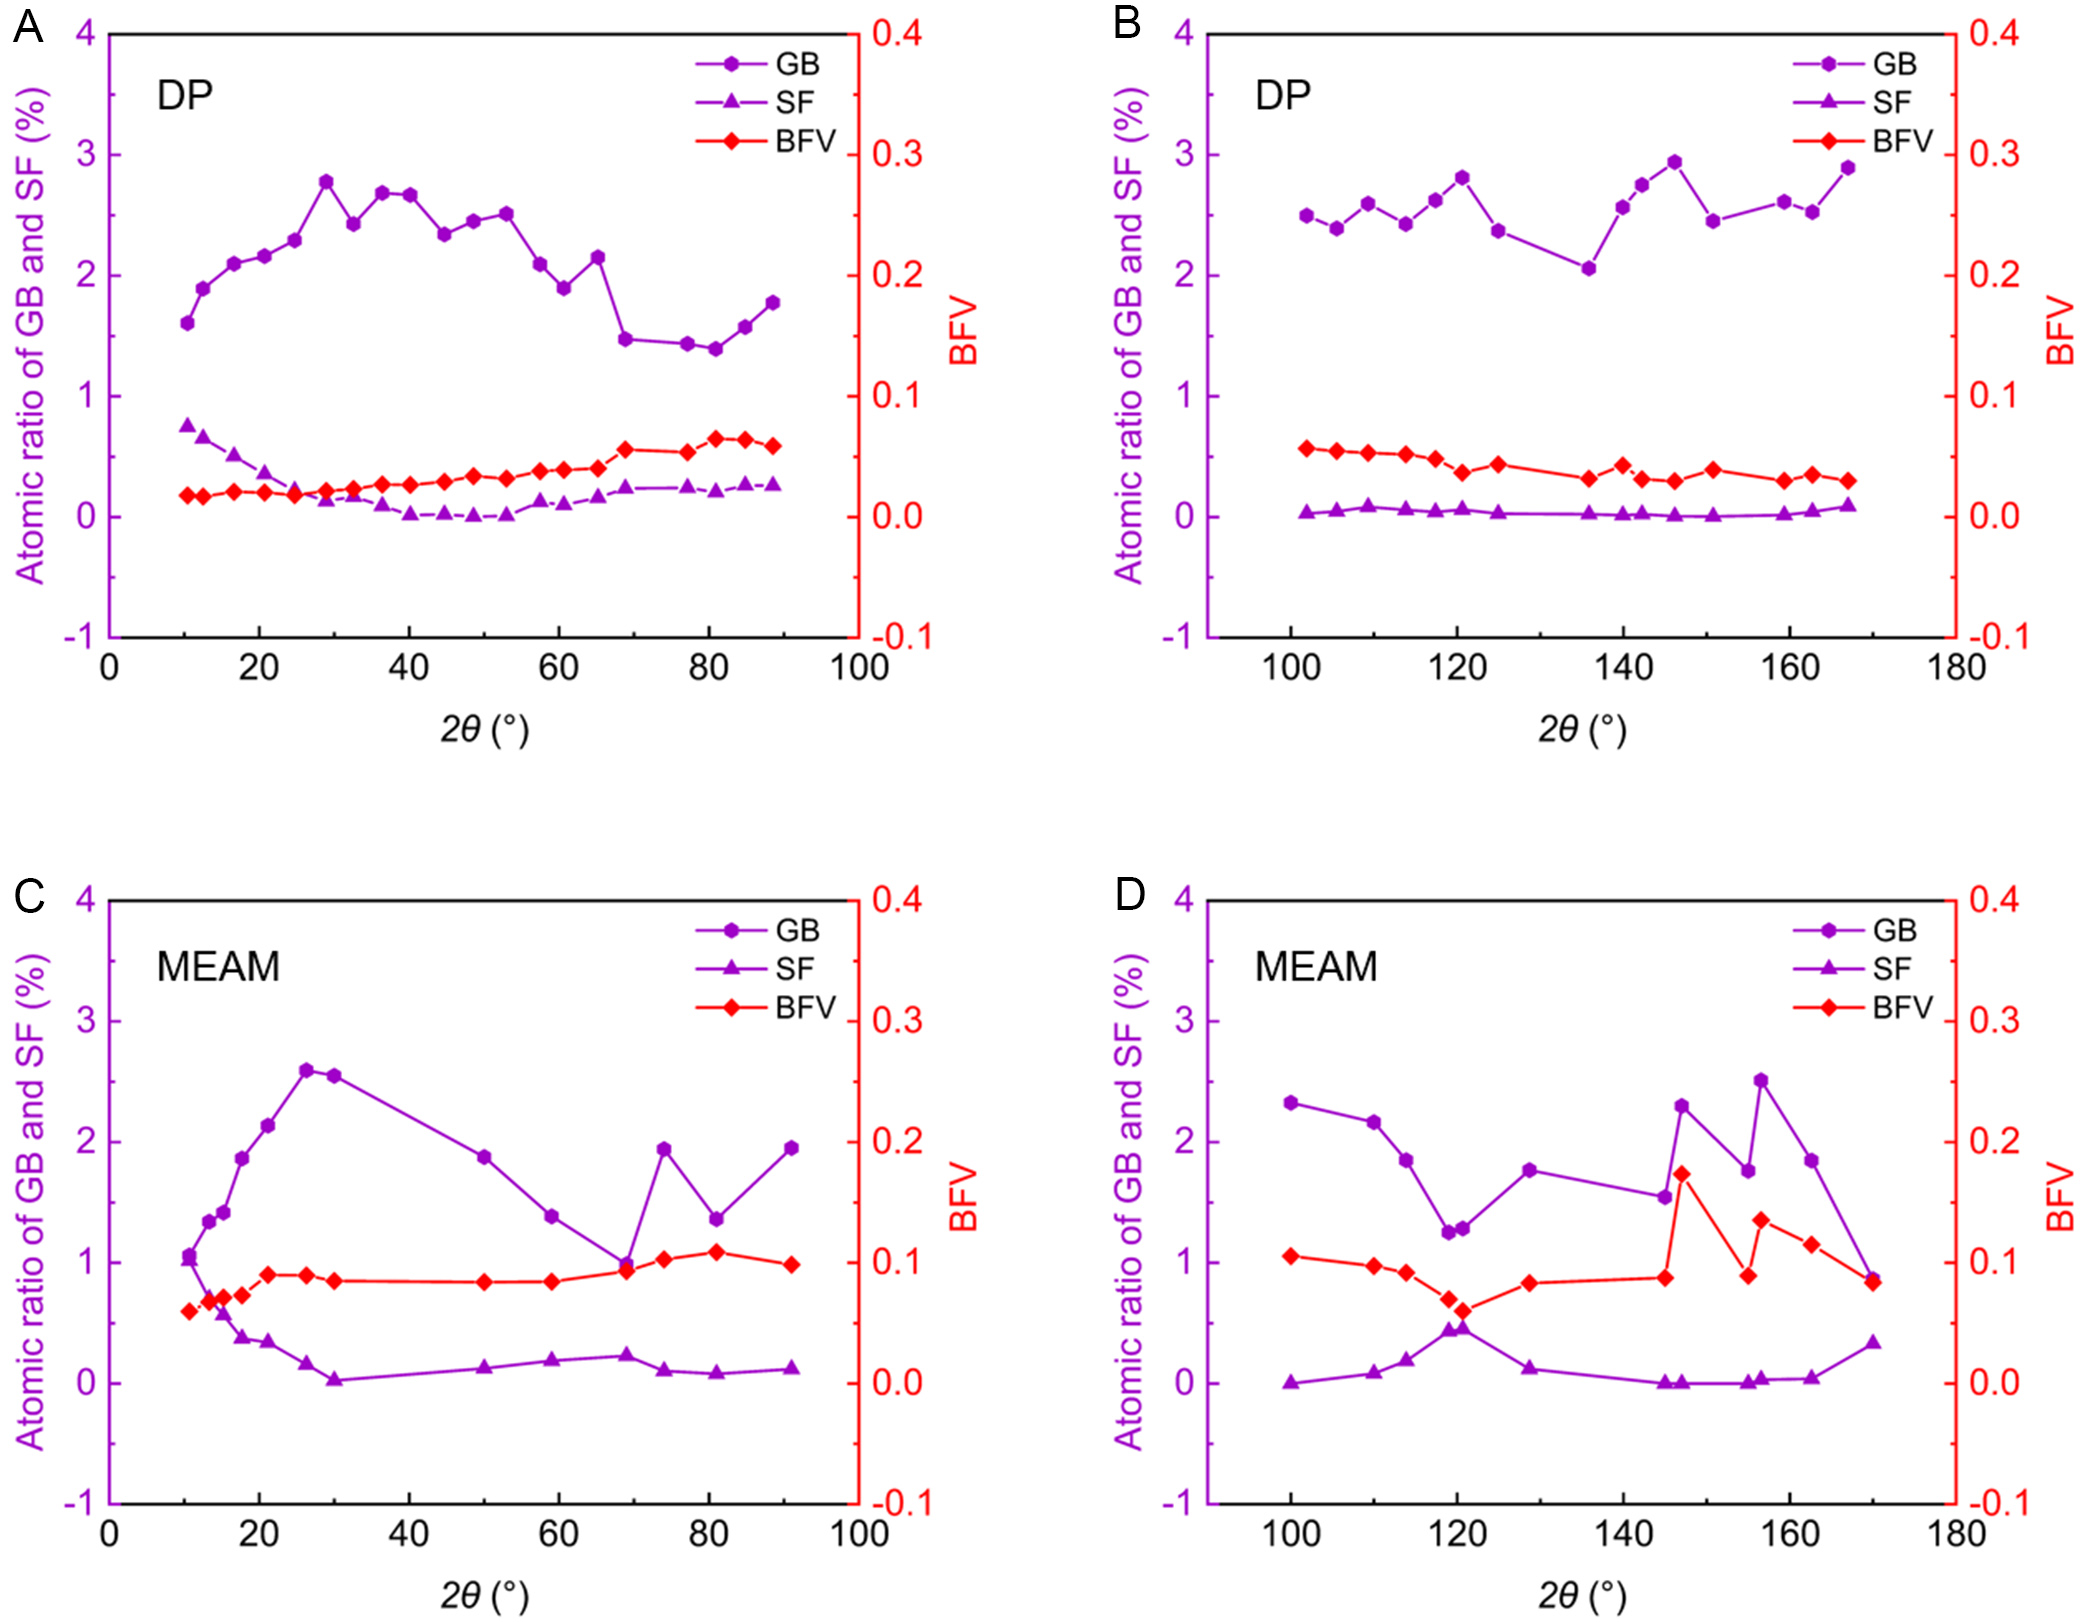
Figure 12. Atomic ratios of grain boundary (GB) and stacking fault (SF) atoms and boundary excess free volume (BFV)[62] for DP (A and B) and MEAM (C and D) models at different tilt angles in the Zn bicrystal system. DP: Deep Potential; MEAM: Modified Embedded-Atom Method.
where
The results show that these plateaus arise from the uniform structural stability predicted by DP, in contrast to the more significant GB structural changes in MEAM. In the first plateau regime (10°~90°), discrete dislocation cores overlap and transform into nearly periodic SUs [Figure 11A-C]. This plateau arises because the GB accommodates misorientation changes by adjusting the spacing of stable SUs rather than by introducing high-energy defects. Conversely, the second energy flattening is governed by the saturation of BFV rather than by simple geometric rotation.
In addition, the origin of the GB energy plateaus is further elucidated by comparing rotational barriers in unrelaxed (static minimization) and fully relaxed (thermally annealed) states, as detailed in Section 2 of Supplementary Materials [Supplementary Figure 1]. This analysis reveals a flat energy landscape where Zn’s exceptional structural relaxation capability enables low-resistance rotational pathways with negligible energetic cost.
Comparison of the $$ {<}1 1 \overline{2} 0{>} $$
To place the unique “energy plateau” features of Zn in a broader physical view, we compare our results with published EAM/MEAM data for other HCP metals. Figure 13 illustrates the
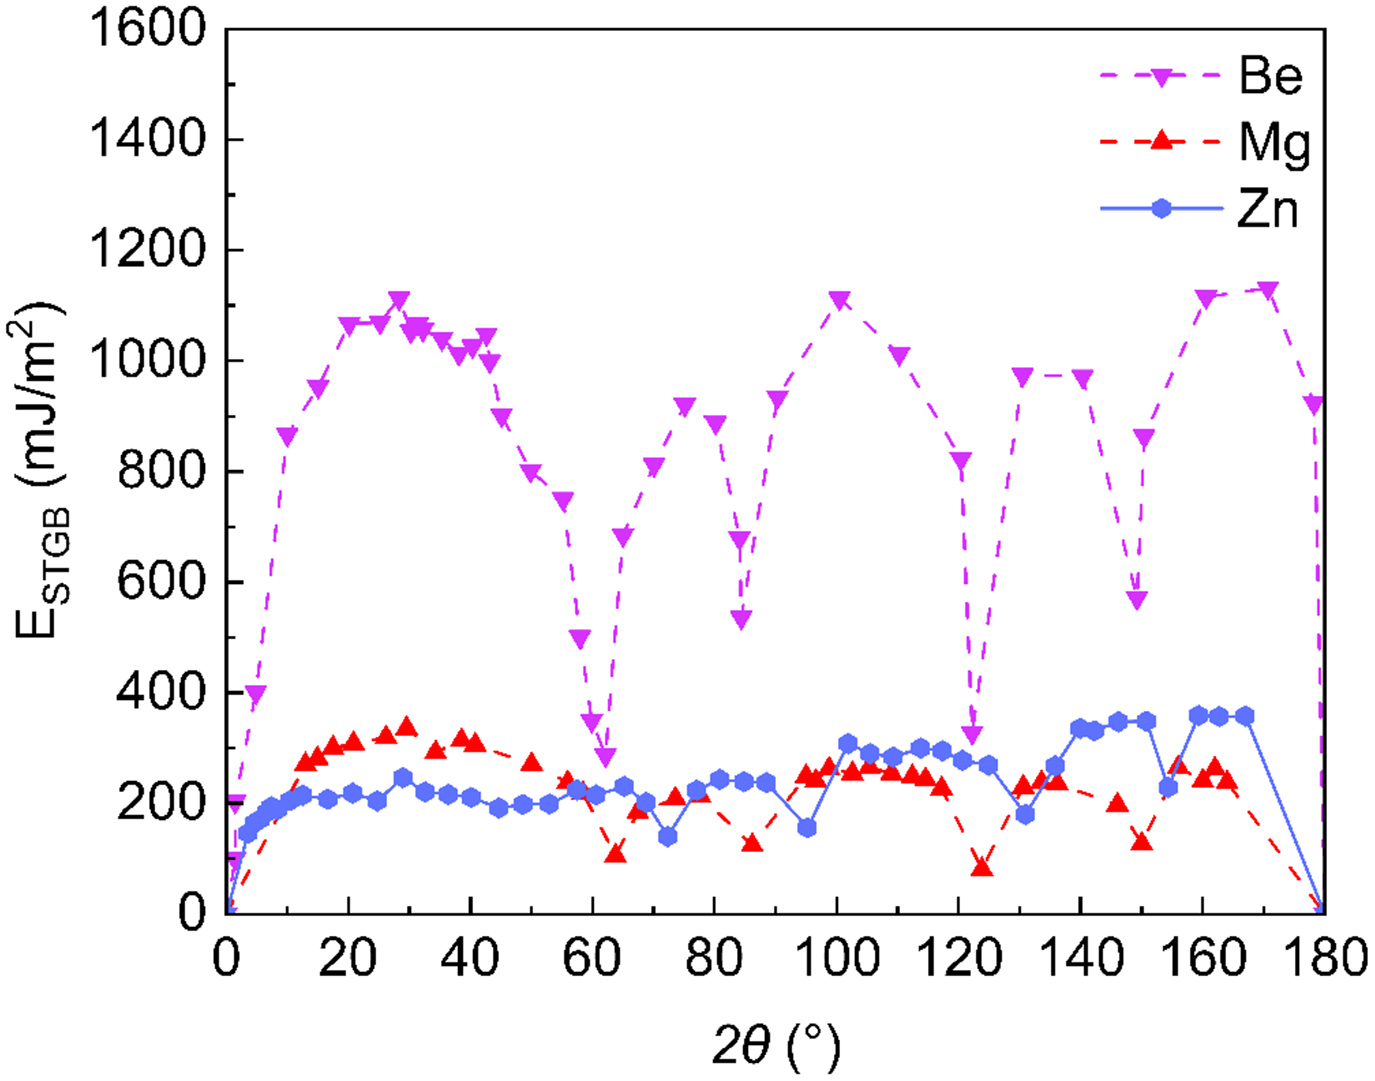
Briefly, DeePMD simulations reveal that the STGB energy of Zn exhibits a unique multi-plateau feature with increasing tilt angle, distinct from the significant fluctuations observed in Mg and Be. Detailed structural analysis indicates that these energy plateaus are governed by the stabilization of specific SUs and the saturation of BFV.
Plastic responses in columnar grain Zn containing $$ {<}1 1 \overline{2} 0{>} $$
Stress-strain responses and strain-rate sensitivity
Uniaxial tensile simulations along the Z-axis were performed on a columnar grain Zn system containing
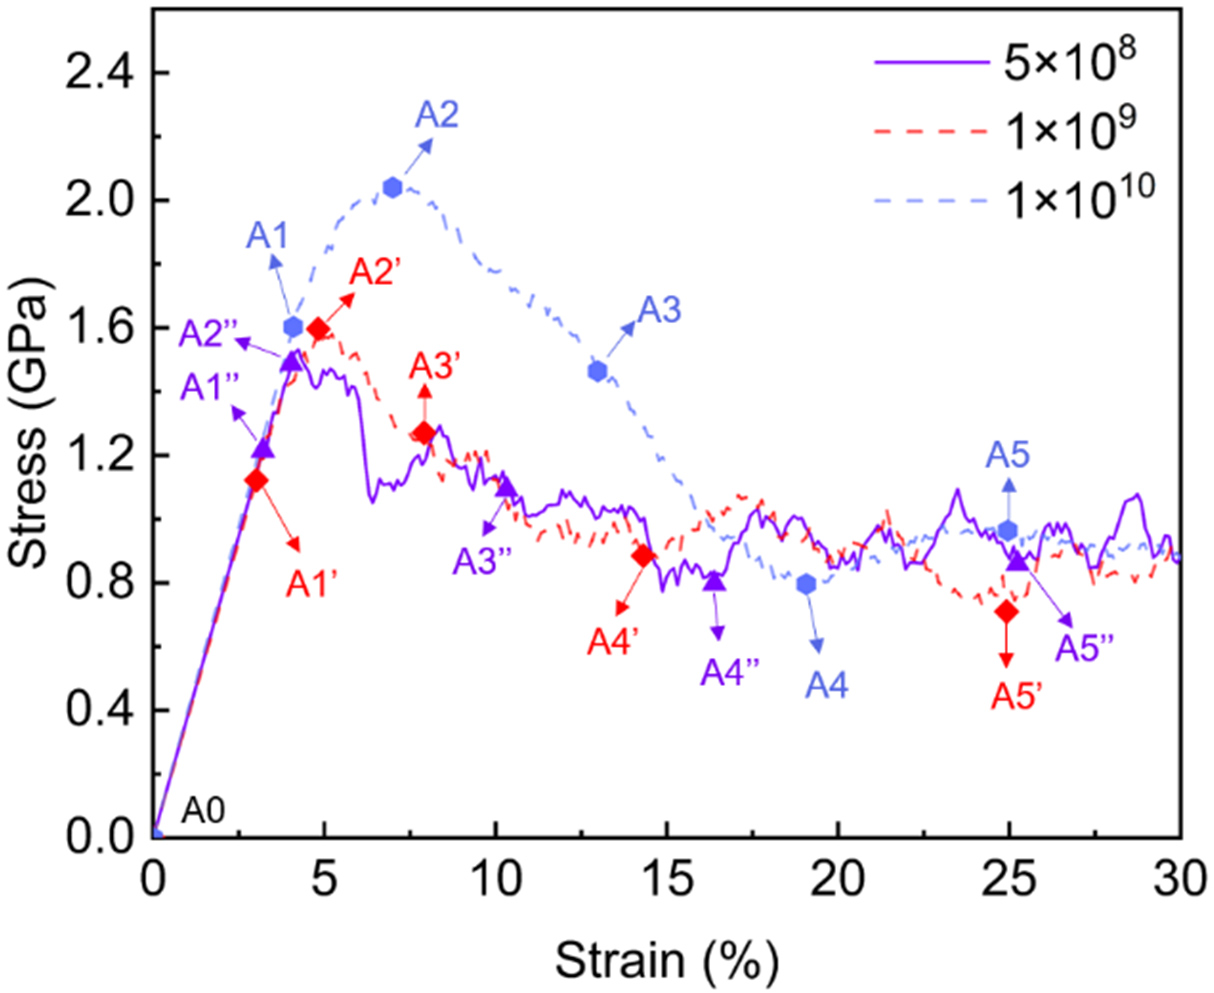
Figure 14. Simulated stress-strain curves of columnar grain Zn system containing
In the elastic regime, the three stress-strain curves overlap with a consistent modulus of ~40 GPa, indicating that the elastic response is strain-rate insensitive. Upon yielding, a clear strain-rate dependence is observed in the peak stress. At the highest strain rate of 1 × 10¹⁰ s-1, the material yields at 1.6 GPa (4.0% strain, A1) and reaches a peak stress of 2.04 GPa (7.0% strain, A2). Decreasing the strain rate to 1 × 10⁹ and 5 × 10⁸ s-1 reduces the peak stress to 1.60 GPa (A2’) and 1.49 GPa (A2’’), respectively. Following the peak stress, all curves exhibit a stress drop corresponding to the onset of plasticity. Notably, regardless of the initial strain rate and peak stress variations, all curves converge to a stable flow stress of approximately 0.80 GPa at larger strains.
Plastic deformation mechanisms: grain rotation vs. dislocation slip
To elucidate the atomic-scale mechanisms underlying the observed stress-strain behaviors, microstructural evolution was analyzed. Figures 15-17 illustrate the atomic configurations on the Y-Z plane under tensile loading at strain rates of 5 × 10⁸, 1 × 10⁹, and 1 × 10¹⁰ s-1, respectively. Comparison of these results reveals that the fundamental plastic deformation modes remain consistent across the studied strain rates.
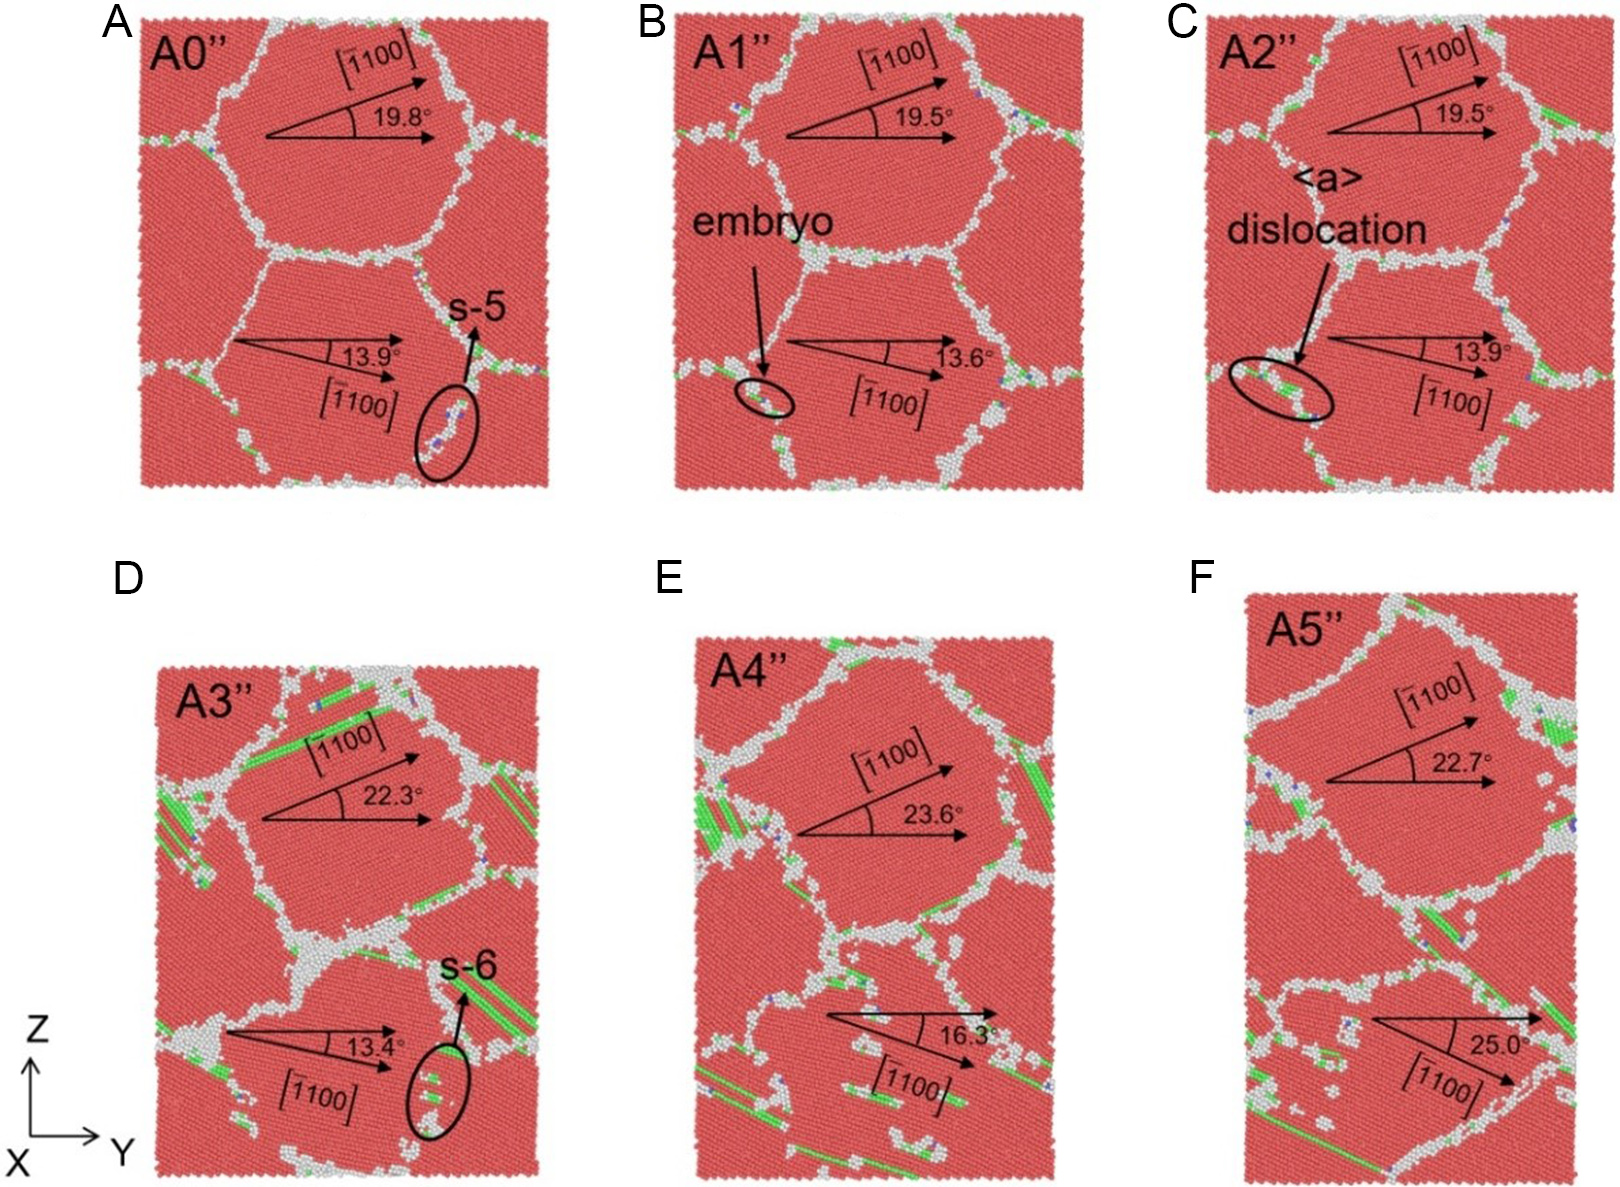
Figure 15. Atomic structures of columnar grain Zn system (Y-Z section) under different applied strains: (A) 0%, (B) 3.2%, (C) 4.0%, (D) 10.3%, (E) 16.4% and (F) 25.2% at the strain rate of 5 × 10⁸ s-1, where red, green, blue and white atoms represent HCP, FCC, BCC, and other structures, respectively. HCP: Hexagonal close-packed; FCC: face-centered cubic; BCC: body-centered cubic.
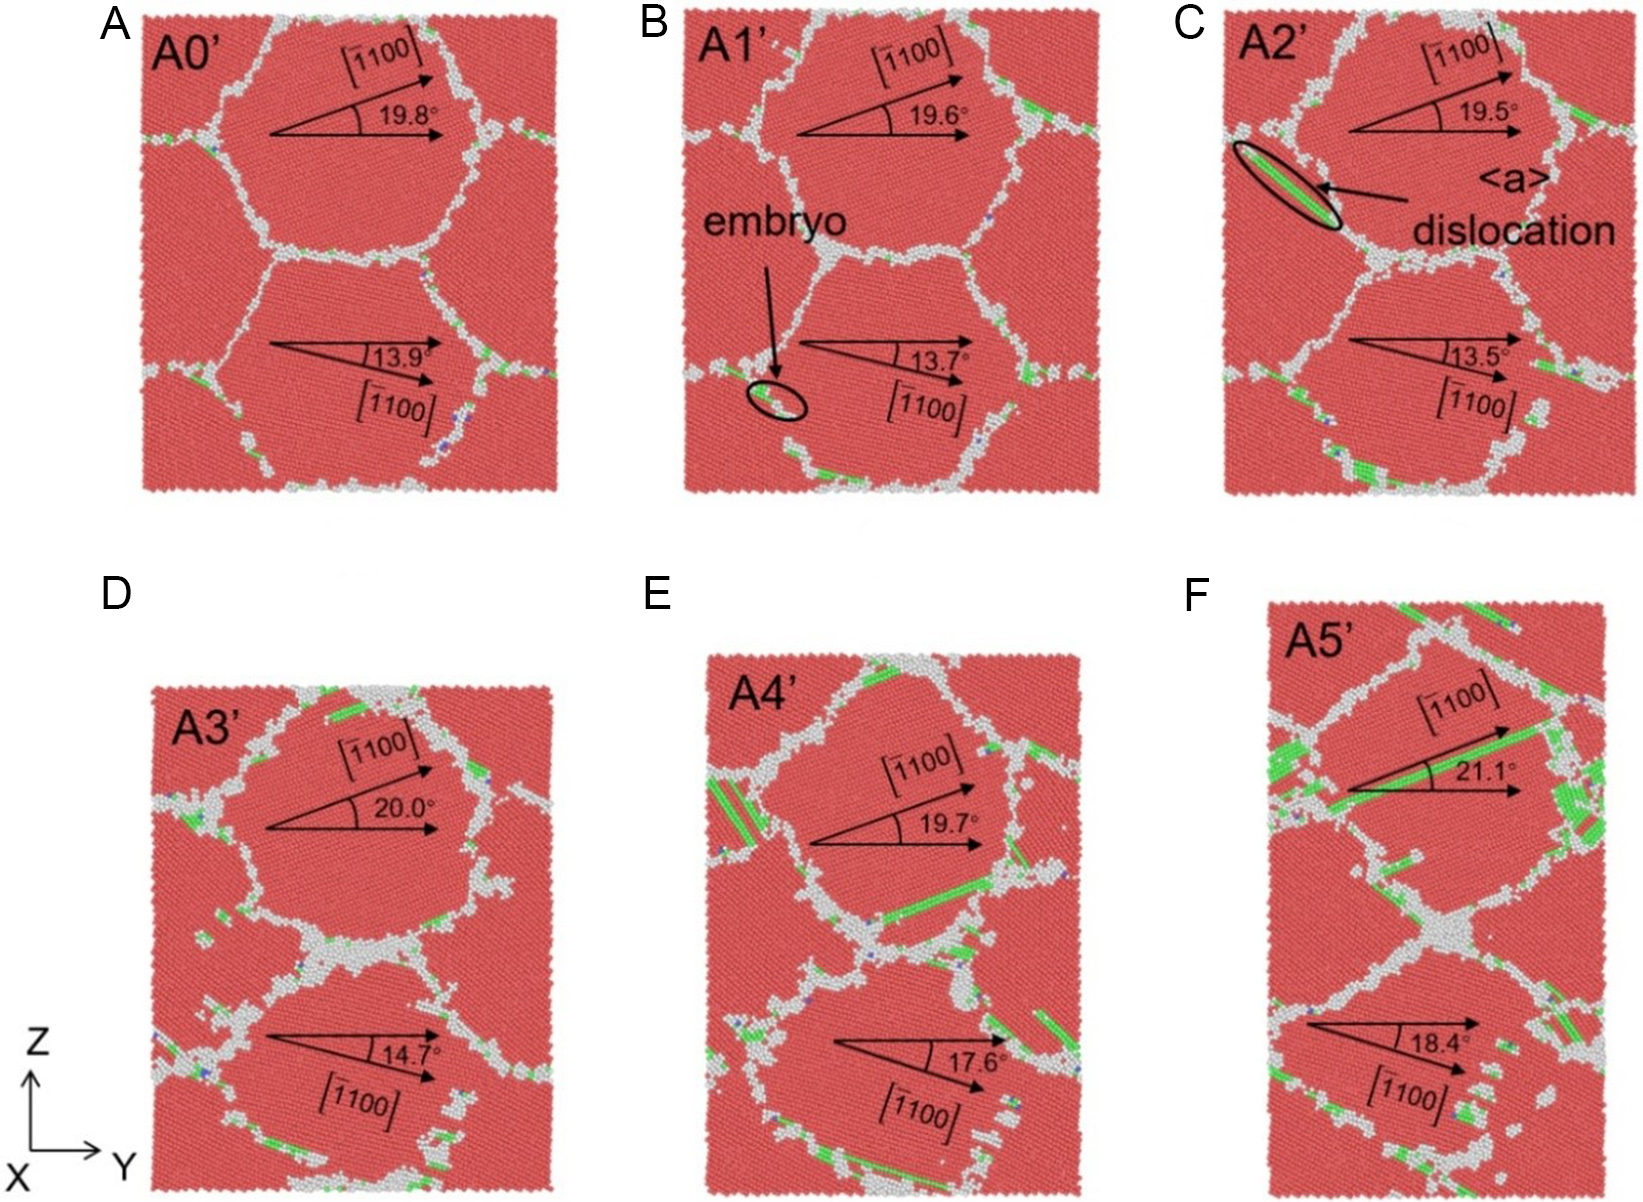
Figure 16. Atomic structures of columnar grain Zn system (Y-Z section) under different applied strains: (A) 0%, (B) 3.0%, (C) 4.8%, (D) 7.9%, (E) 14.3% and (F) 24.9% at the strain rate of 1 × 10⁹ s-1, where red, green, blue and white atoms represent HCP, FCC, BCC, and other structures, respectively. HCP: Hexagonal close-packed; FCC: face-centered cubic; BCC: body-centered cubic.
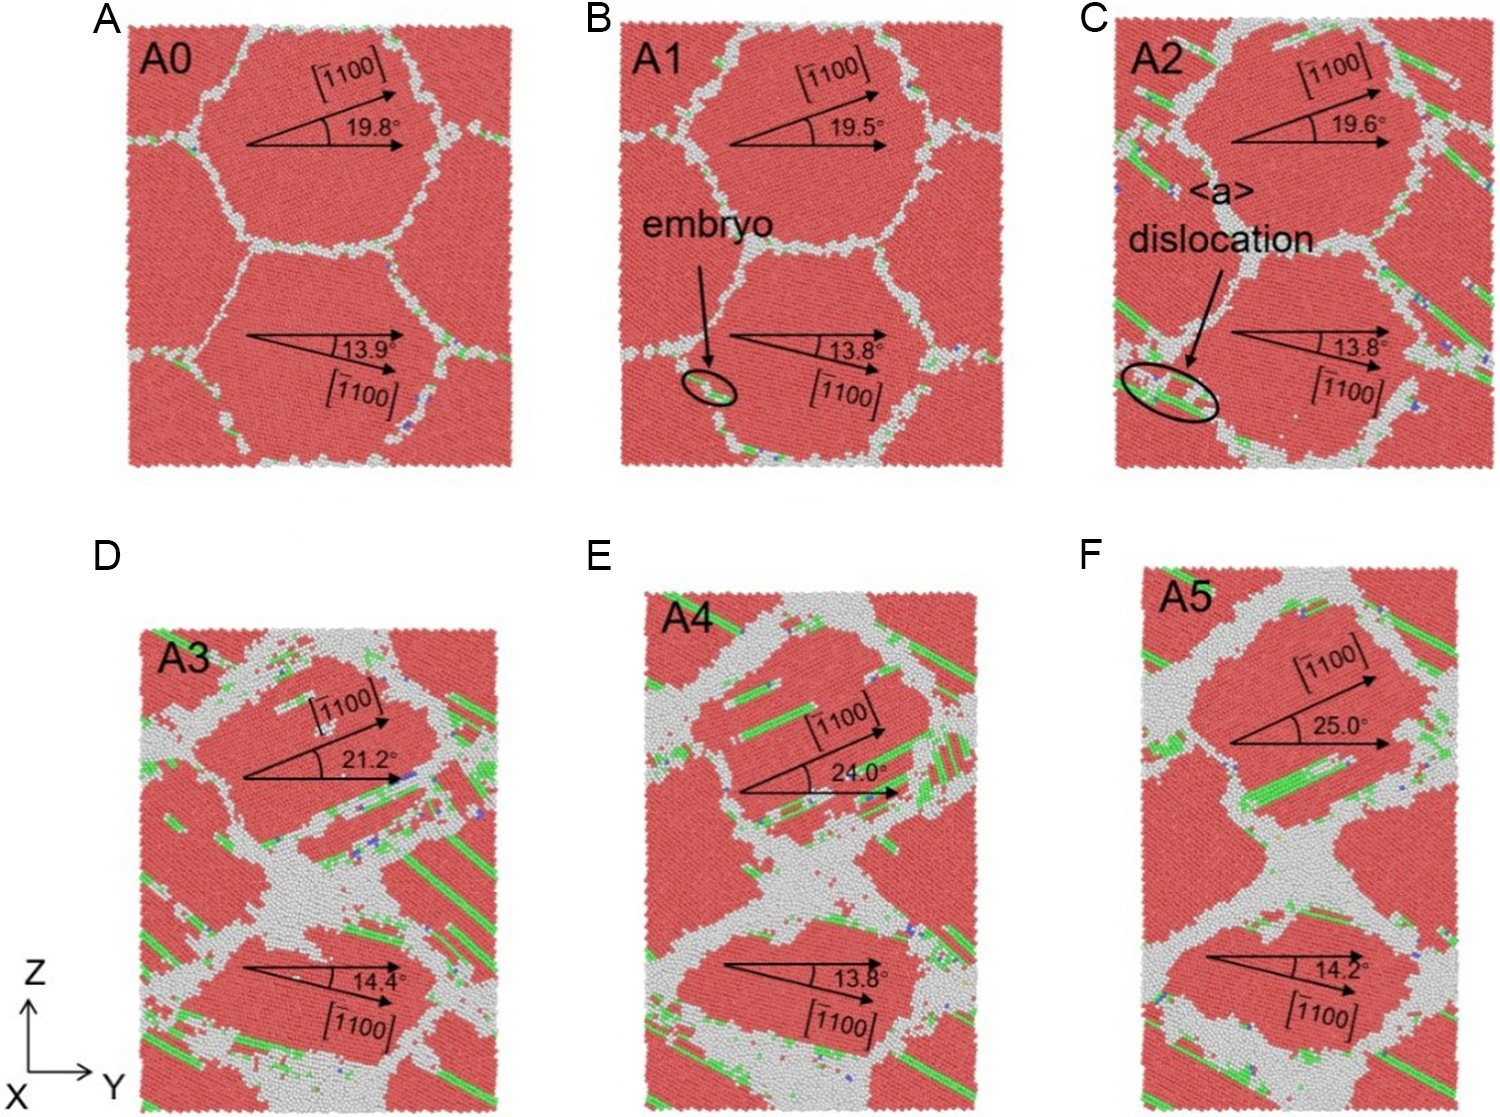
Figure 17. Atomic structures of columnar grain Zn system (Y-Z section) under different applied strains: (A) 0%, (B) 4.0%, (C) 7.0%, (D) 13.0%, (E) 19.0% and (F) 25.0% at the strain rate of 1 × 10¹⁰ s-1, where red, green, blue and white atoms represent HCP, FCC, BCC, and other structures, respectively. HCP: Hexagonal close-packed; FCC: face-centered cubic; BCC: body-centered cubic.
Taking the strain rate of 5 × 10⁸ s-1 [Figure 15] as a representative example, the deformation process can be divided into distinct stages. At the onset of plasticity (3.2% strain, Figure 15B), dislocation embryos begin to form near the grain boundaries (GBs). As the stress peaks at 4.0% strain [Figure 15C], discrete dislocations nucleate from the GBs, accompanied by subtle morphological changes in the GB structure. A critical transition occurs as strain increases further. From 10.3% to 25.0% strain [Figure 15D-F], grain rotation becomes the dominant mechanism for strain accommodation, overshadowing dislocation activity. For instance, the orientation of Grain 1 (relative to the X-axis) rotates significantly from 19.5° to 22.3°. Simultaneously, dislocation density, which peaks at intermediate strains, decreases at the steady-state stage [Figure 15F] as dislocations are absorbed by the GBs. This rotation-dominated mechanism is intrinsically linked to the energetics of the STGBs. As observed in Figure 15A and D, the relative angle between Grain 2 and Grain 4 evolves from an initial 88.6° (falling within the s-5 region) to a state characteristic of the s-6 region. This transition confirms that the specific GB energy landscape of Zn facilitates continuous grain rotation with low energy barriers.
Similar evolutionary trends are observed at higher strain rates of 1 × 10⁹ s-1 [Figure 16] and 1 × 10¹⁰ s-1 [Figure 17]. While higher strain rates induce slight GB thickening and minor variations in peak dislocation density, the dominance of grain rotation persists. For example, at the strain rate of 1 × 10¹⁰ s-1, the relative angle between grains increases from 5.9° to 10.8° [Figure 17D-F]. These results demonstrate that the prevalence of grain rotation in Zn is not an artifact of loading conditions but a generic feature driven by the unique GB energy plateaus captured by the DP model.
Comparative plasticity in HCP Zn, Mg, and Be
To highlight the uniqueness of Zn, its plastic response was compared with similar columnar grain systems of HCP Mg and Be at 300 K and a strain rate of 1 × 10¹⁰ s-1.
Figure 18A contrasts the stress-strain behaviors of Zn, Mg, and Be. While the Mg system exhibits a profile qualitatively similar to Zn (yielding at 1.6 GPa and decreasing to 0.73 GPa), the Be system displays a drastically different response, characterized by a steep elastic slope, a high peak stress of 5.94 GPa, and a smaller stress drop. This macroscopic disparity correlates directly with the dislocation evolution in Figure 18B, where the density of basal <a> dislocations rises gradually in Zn, moderately in Mg, but increases drastically in Be.
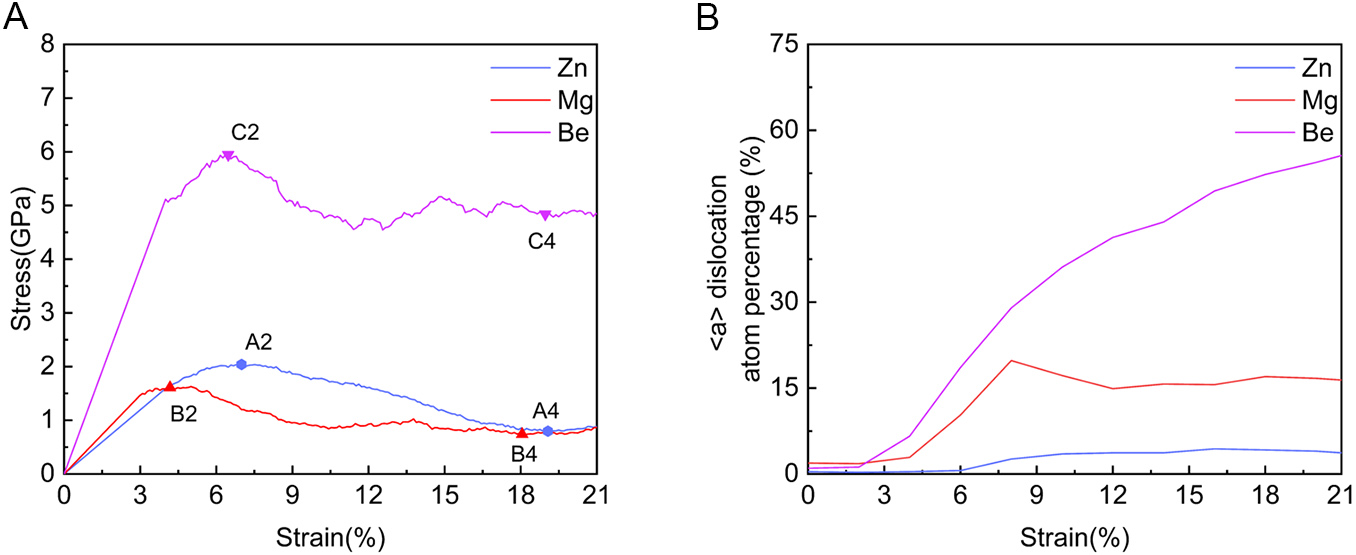
Figure 18. (A) Stress-strain curves of
The divergence in mechanisms is visually confirmed by atomic structures in Figure 19.
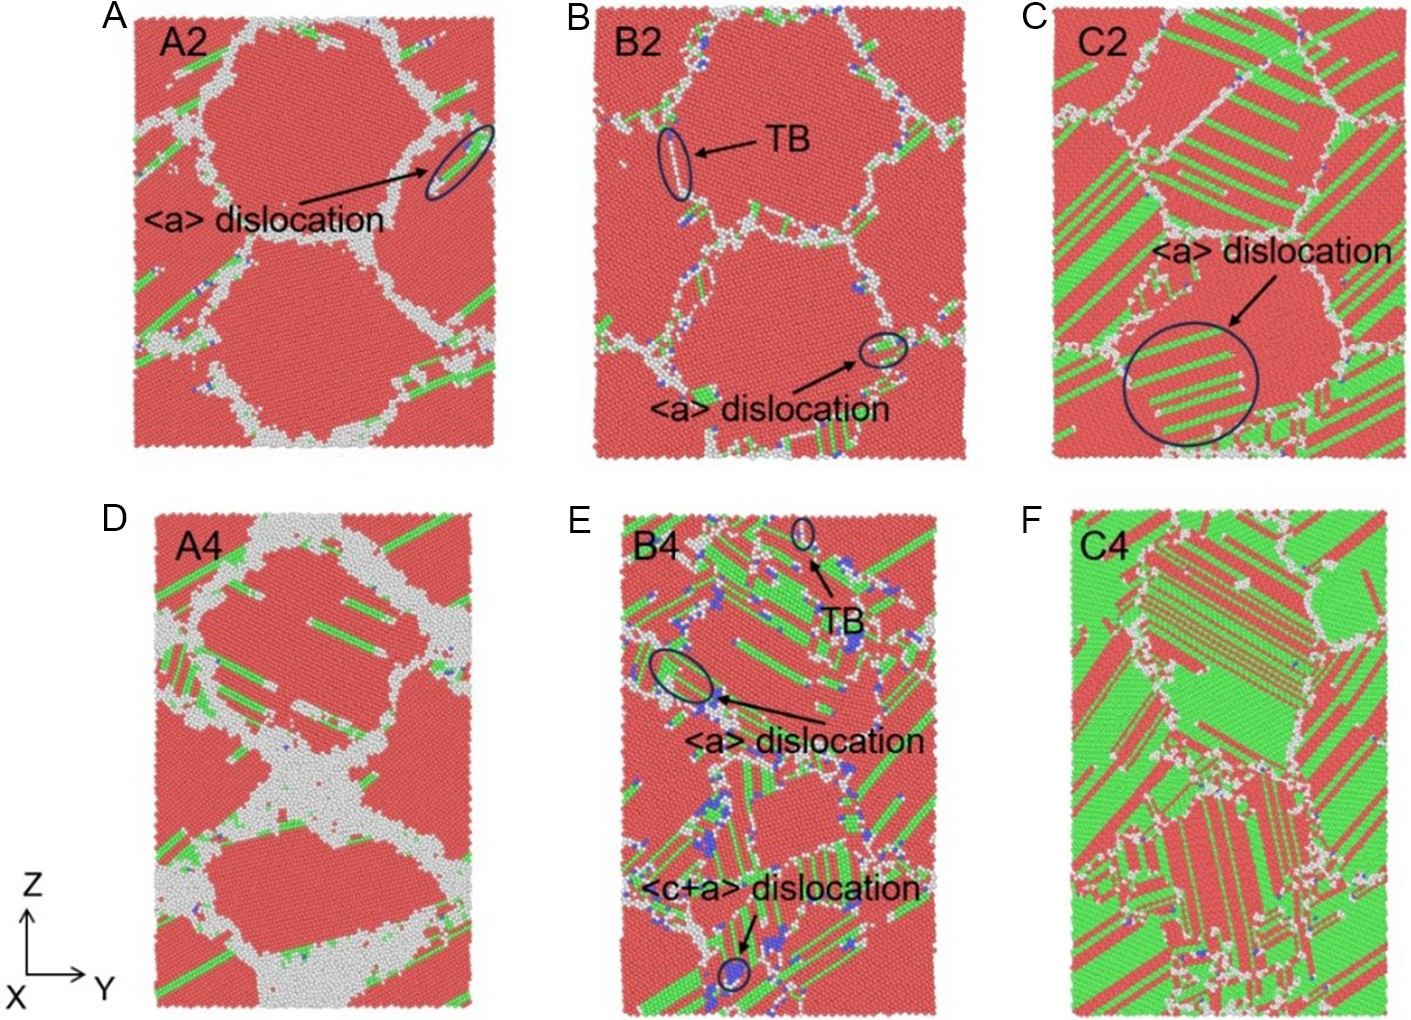
Figure 19. Atomic structure of columnar grain system of (A and D) Zn, (B and E) Mg and (C and F) Be, respectively, corresponding to the peak (A-C) and stable stress (D and E) stages, where the applied strains of A2, B2 and C2 are 7.0%, 6.0% and 6.5%, and A4, B4 and C4 are 19.0%, 18.1% and 19.0%, respectively, at the strain rate of 1 × 10¹⁰ s-1. The red, green, blue and white atoms represent HCP, FCC, BCC and other structures, respectively. HCP: Hexagonal close-packed; FCC: face-centered cubic; BCC: body-centered cubic; TB: twin boundary.
◆ Zn [Figure 19A and D]: Plasticity is governed primarily by grain rotation with limited dislocation activity.
◆ Mg [Figure 19B and E]: Exhibits a mixed mode, where both <a> and <c+a> dislocations nucleate and propagate, alongside the formation of twin boundaries.
◆ Be [Figure 19C and F]: Dominated by dislocation plasticity, showing rapid proliferation of <a> dislocations that impede grain rotation.
In addition, Table 3 quantifies the magnitude of grain rotation, providing compelling evidence for this mechanistic distinction. In the Zn system, significant rotations are recorded (e.g., Grain 1 rotates by ~2.7° at 19% strain). In contrast, Mg and Be exhibit negligible rotations (average changes < 0.6°). This suppression of rotation in Mg and Be is attributed to the high stress required to activate rotation, compared to the relatively easier activation of dislocation slip, as well as the high density of dislocations which may mechanically lock the boundaries.
Variation of
| Types | Strain (%) | Orientation of Grain 1 (°) | Orientation of Grain 2 (°) | Orientation of Grain 3 (°) | Orientation of Grain 4 (°) | Average change |
| Zn | 0 | 19.8 | -13.9 | -39.0 | -25.0 | - |
| 4.0 | 19.5 | -13.8 | -39.0 | -24.7 | 0.2 | |
| 7.0 | 19.6 | -13.8 | -39.1 | -25.6 | 0.3 | |
| 13.0 | 21.2 | -14.4 | -41.4 | -28.4 | 1.9 | |
| 19.0 | 24.0 | -13.8 | -41.0 | -29.5 | 2.7 | |
| Mg | 0 | 19.7 | -13.9 | -38.7 | -25.1 | - |
| 4.0 | 19.6 | -13.7 | -39.5 | -25.4 | 0.5 | |
| 6.0 | 19.8 | -14.0 | -40.8 | -25.4 | 0.6 | |
| 8.0 | - | - | - | - | - | |
| Be | 0 | 19.5 | -13.9 | -39.0 | -24.9 | - |
| 4.0 | 19.7 | -14.4 | -39.9 | -25.4 | 0.5 | |
| 6.0 | - | - | - | - | - |
Consequently, the unique GB energetics of Zn (specifically the energy plateaus) render grain rotation an energetically favorable pathway for plastic strain accommodation. This stands in sharp contrast to Mg and Be, where plasticity is dominated by conventional dislocation slip and deformation twinning.
Plastic deformation behaviors of nanopolycrystalline Zn
Stress-strain responses
To validate whether the mechanisms observed in the columnar grain (2D) systems persist in more realistic microstructures, uniaxial tensile simulations were performed on a nanopolycrystalline Zn system containing 3D GBs using DeePMD. Figure 20 presents the stress-strain curve at 300 K with a strain rate of 1 × 10¹⁰ s-1.
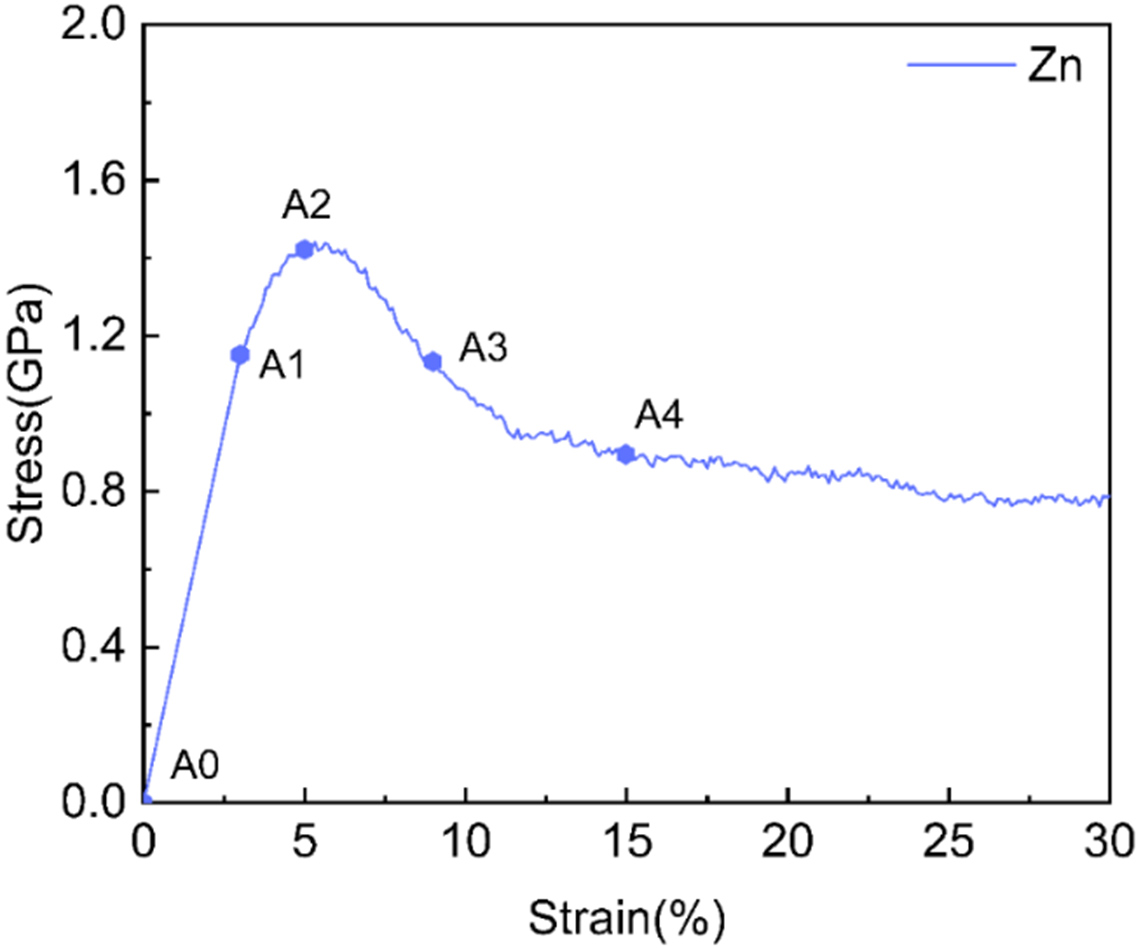
Figure 20. Simulated stress-strain curves of nanopolycrystalline Zn at 300 K with a strain rate of 1 × 10¹⁰ s-1.
In the elastic stage, the material exhibits linear behavior with a modulus of 38.3 GPa and a yield stress of 1.2 GPa. Following the onset of plasticity, the stress reaches a peak of 1.42 GPa at 5.0% strain (A2). Subsequently, the material undergoes plastic deformation, with the stress dropping to a steady-state value of 0.89 GPa (A4). This response qualitatively mirrors the behavior of the columnar system, suggesting a similarity in the underlying deformation mechanisms.
Plastic mechanisms: validation of grain rotation in 3D
Figure 21 illustrates the atomic structural evolution of nanocrystalline Zn on the X-Z cross-section plane during tension. Figure 21A-C display the initial 3D configuration and defect distribution. Prior to yielding, the material remains elastic, with only sparse dislocation embryos observed near the boundaries [Figure 21D and H].
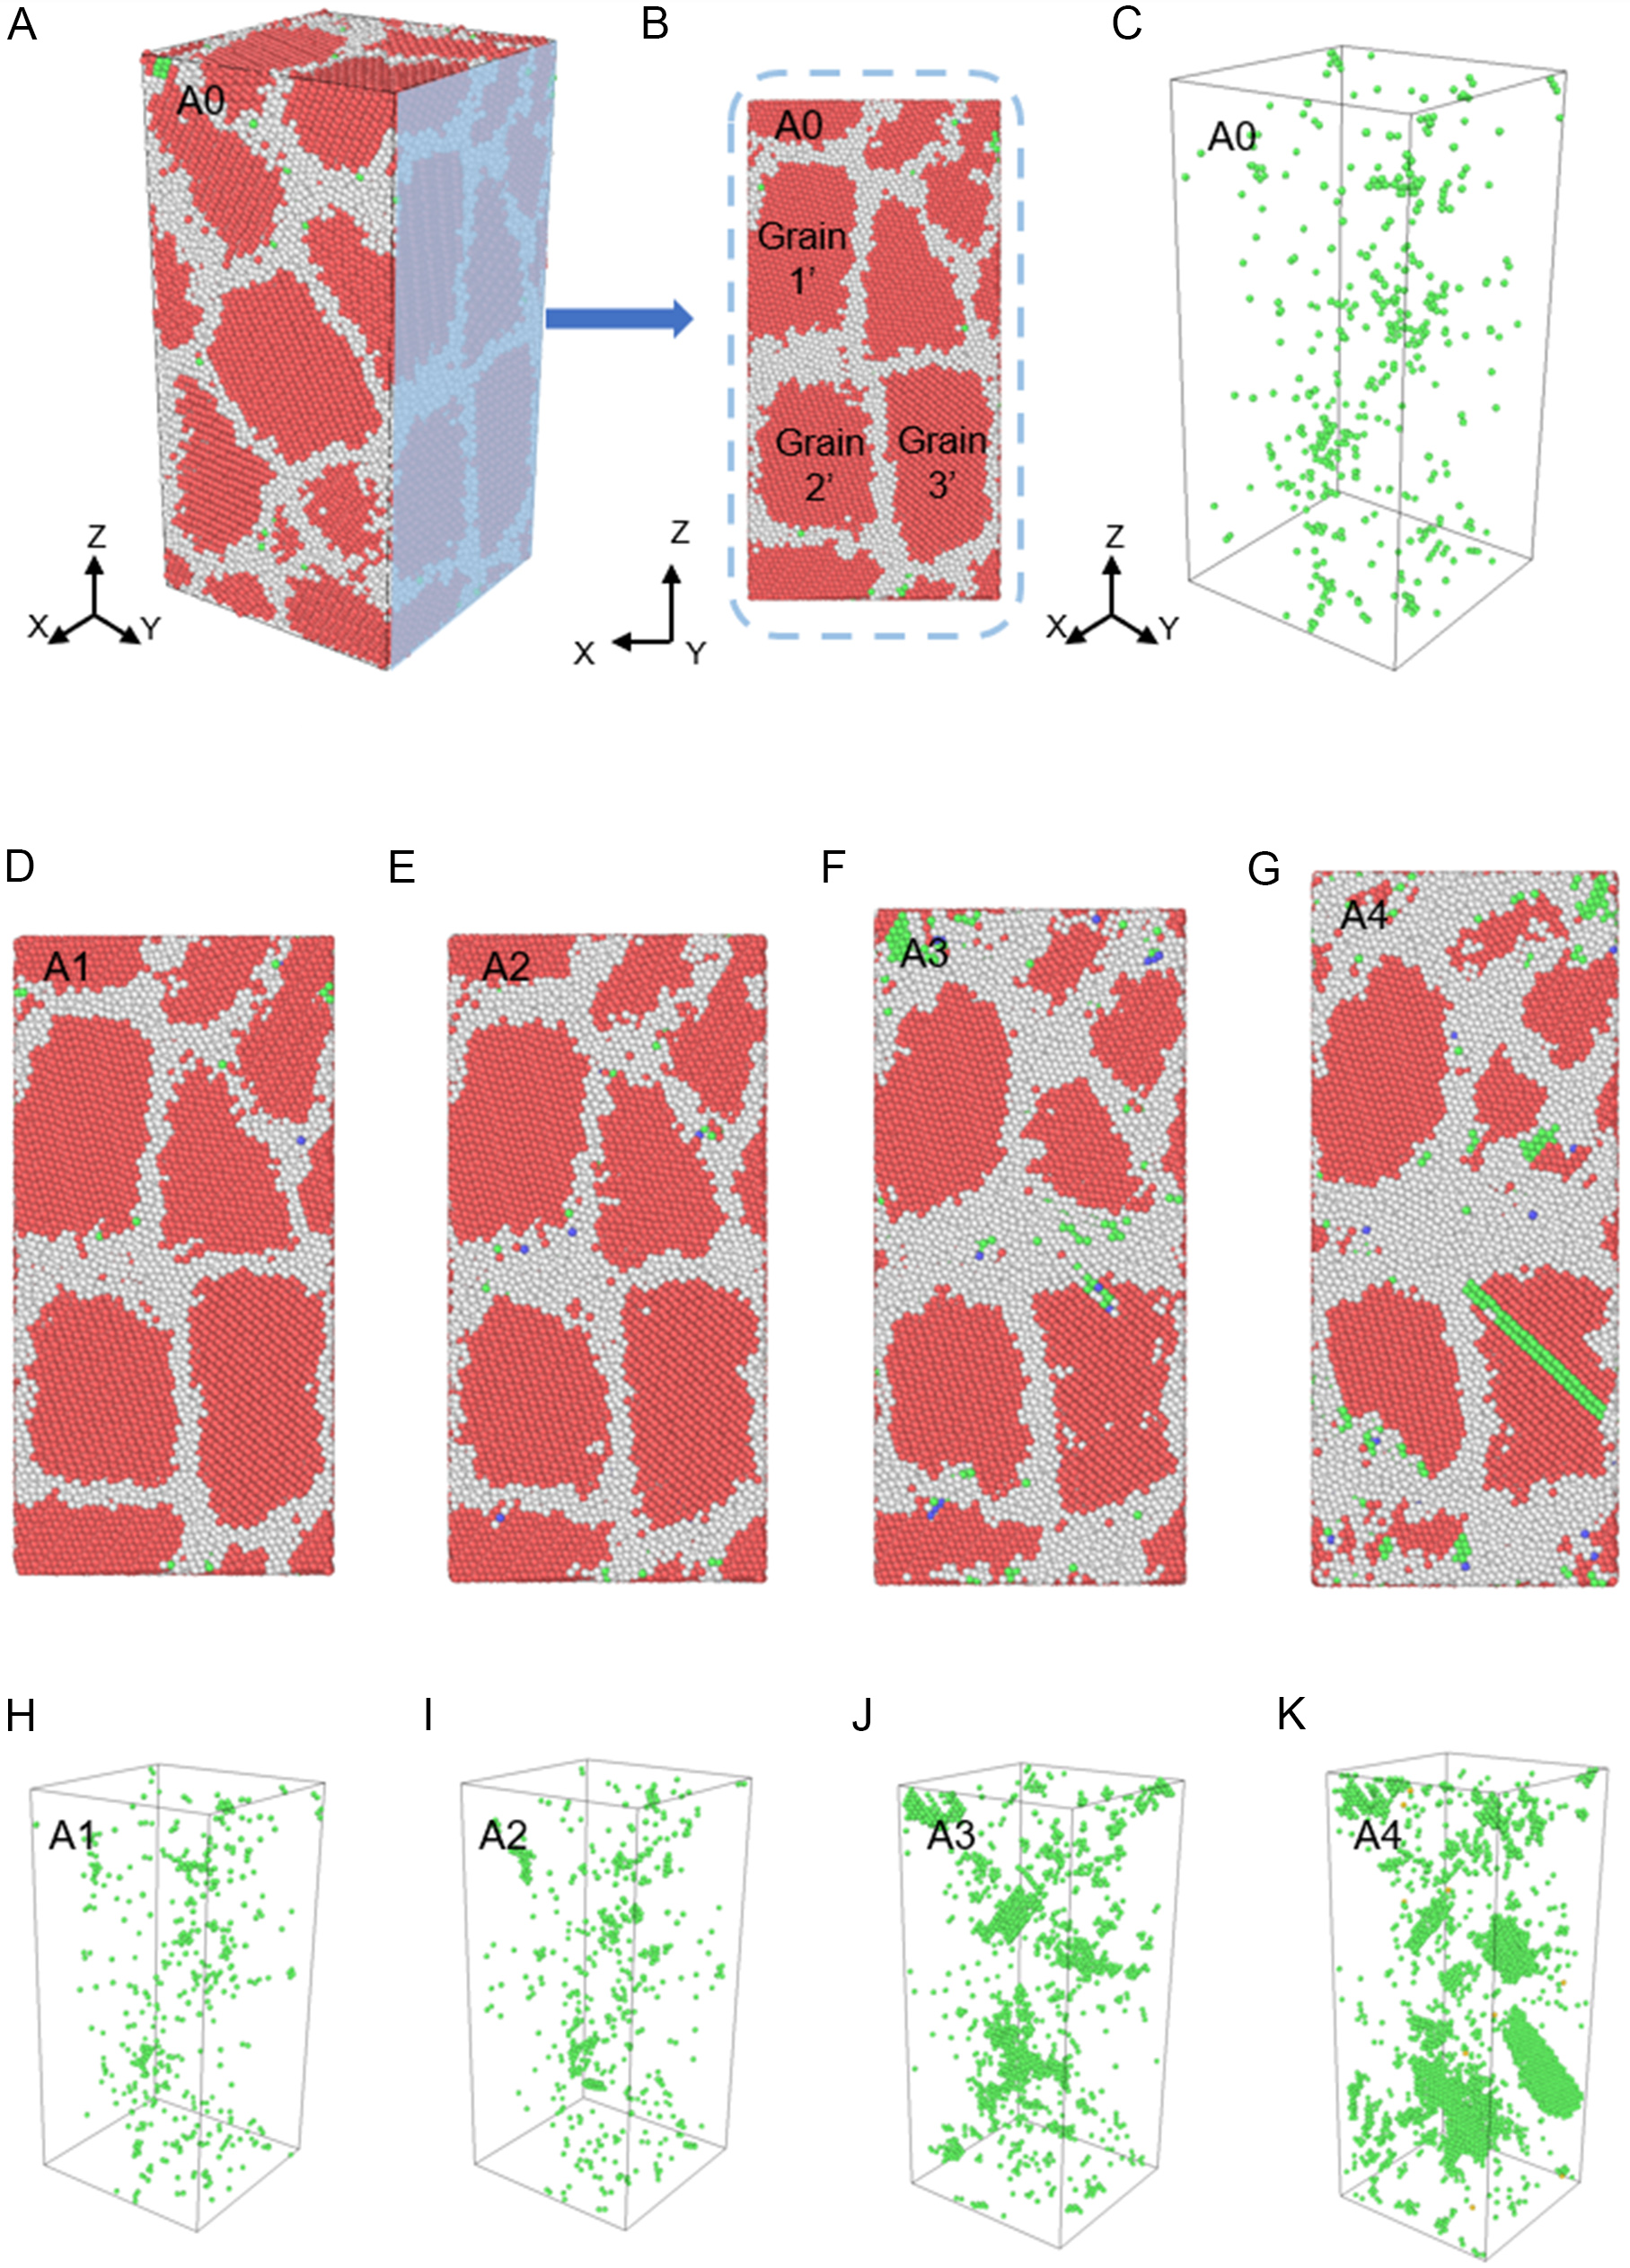
Figure 21. (A) Initial 3D atomic structure of nanopolycrystalline Zn before loading; (B) schematic of the Y-Z cross-section; (C) distribution of <a> dislocation atoms (identified via CNA). Evolution of atomic structures on the Y-Z cross-section and <a> dislocation distribution at applied strains (D and H) 3%, (E and I) 5%, (F and J) 9%, and (G and K) 15%. The red, green, blue, and white atoms represent HCP, FCC, BCC, and other structures, respectively. 3D: Three-dimensional; CNA: common neighbor analysis; HCP: hexagonal close-packed; FCC: face-centered cubic; BCC: body-centered cubic.
At the peak stress (5.0% strain, A2), limited dislocations nucleate from the GBs, while the GB morphology remains largely stable [Figure 21E and I]. However, as strain increases to 9.0% (A3) and 15.0% (A4), a distinct transition occurs. While dislocation density increases, pronounced GB thickening and grain reshaping become evident [Figure 21F-K]. This implies that grain rotation, rather than dislocation slip, increasingly dominates the accommodation of plastic strain.
This rotational behavior is quantified by tracking the Euler angles (ψ, θ, φ) of representative grains (Grain 1’, 2’, and 3’ in Figure 21B), as detailed in Table 4. Taking Grain 1’ as an example, its orientation remains relatively stable during the elastic and initial yield stages (0%-5% applied strain). However, during significant plastic flow (5%-15% strain), the Euler angles shift continuously. For instance, ψ evolves from 15.8° to 14.5°, and ϕ shifts from -93.1° to -91.3°. Similar rotational trends are observed for Grains 2’ and 3’. These quantitative results confirm that grain rotation is a significant plasticity carrier in 3D nanopolycrystalline Zn, corroborating the findings from the columnar grain models.
Variation of Euler angles during tensile deformation in nanopolycrystalline Zn
| Strain (%) | Euler angles of Grain 1’ | Euler angles of Grain 2’ | Euler angles of Grain 3’ |
| 0 | (16.0°, 12.1°, -93.1°) | (-65.1°, -16.8°, 131.3°) | (-40.0°, 2.6°, -41.6°) |
| 3.0 | (15.9°, 12.2°, -93.1°) | (-65.0°, -16.7°, 131.2°) | (-39.9°, 2.5°, -41.5°) |
| 5.0 | (15.8°, 12.7°, -93.1°) | (-65.2°, -16.4°, 131.2°) | (-40.1°, 2.3°, -41.5°) |
| 9.0 | (15.0°, 12.2°, -91.9°) | (-66.9°, -16.8°, 132.5°) | (-40.2°, 2.2°, -41.2°) |
| 15.0 | (14.5°, 12.3°, -91.3°) | (-68.8°, -16.8°, 133.5°) | (-42.5°, 2.1°, -40.5°) |
Additionally, it is worth noting that the GB energy plateau is an intrinsic thermodynamic property of the boundary structure, rendering it independent of grain size. Therefore, even in coarse-grained materials, this thermodynamic feature remains critical for local microstructural evolution processes such as grain rotation, recovery, and recrystallization.
Comparative plasticity and intrinsic origins: Zn, Mg, and Be
To elucidate the physical origins of the unique behavior in Zn, its response was compared with nanopolycrystalline Mg and Be systems under identical loading conditions (300 K, 1 × 10¹⁰ s-1). Figure 22 compares the macroscopic stress-strain behaviors. The Zn and Mg systems exhibit similar trends: a yield point followed by a stress drop. In contrast, the Be system behaves distinctly, characterized by a much stiffer elastic response, a significantly higher peak stress (4.72 GPa), and limited softening.
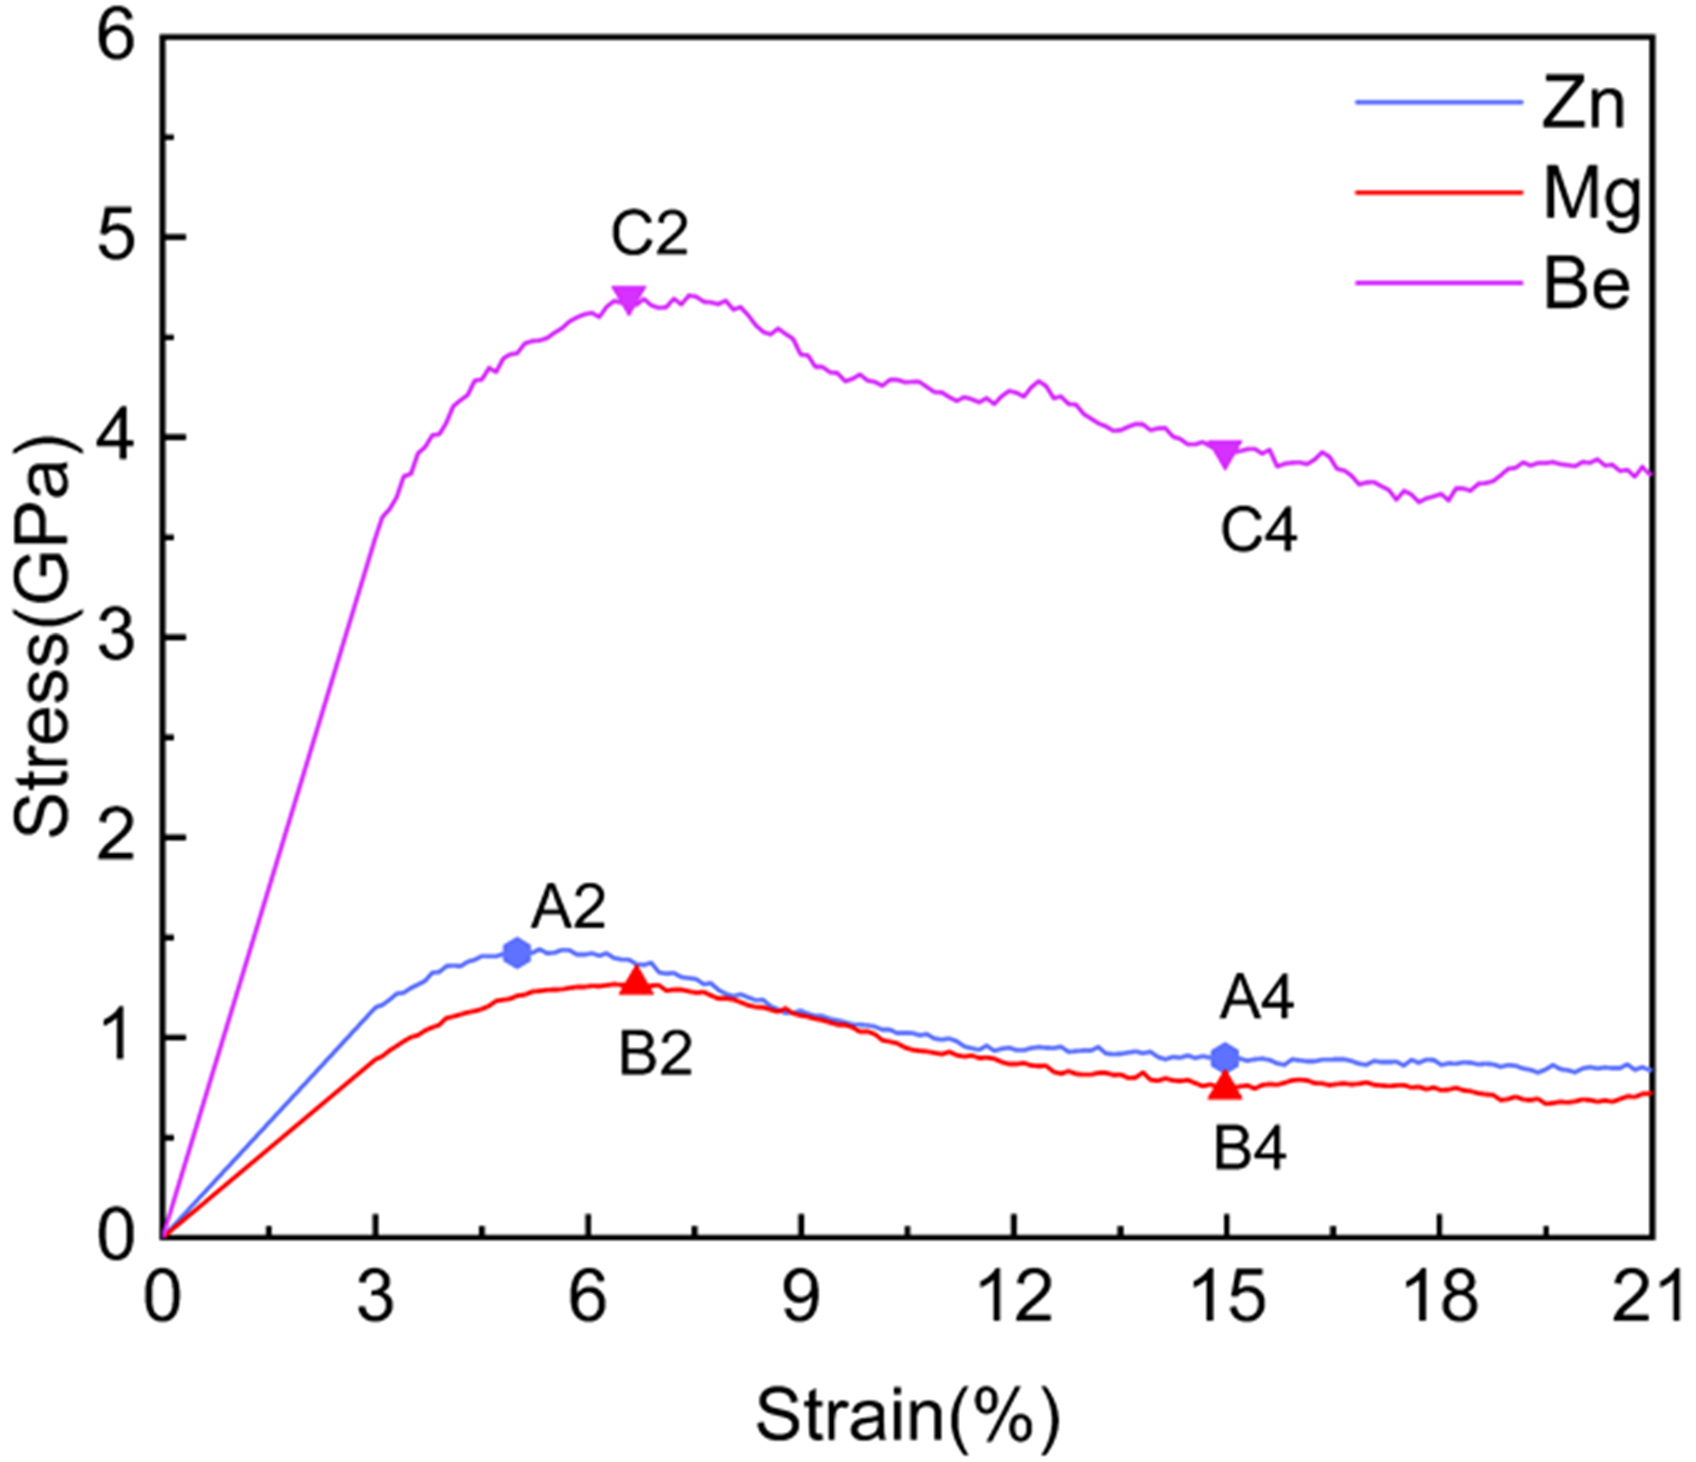
Figure 22. Simulated stress-strain curves for nanopolycrystalline HCP Zn, Mg, and Be systems at 300 K with a strain rate of 1 × 10¹⁰ s-1. HCP: Hexagonal close-packed.
The microscopic basis for these differences is revealed in Figure 23.
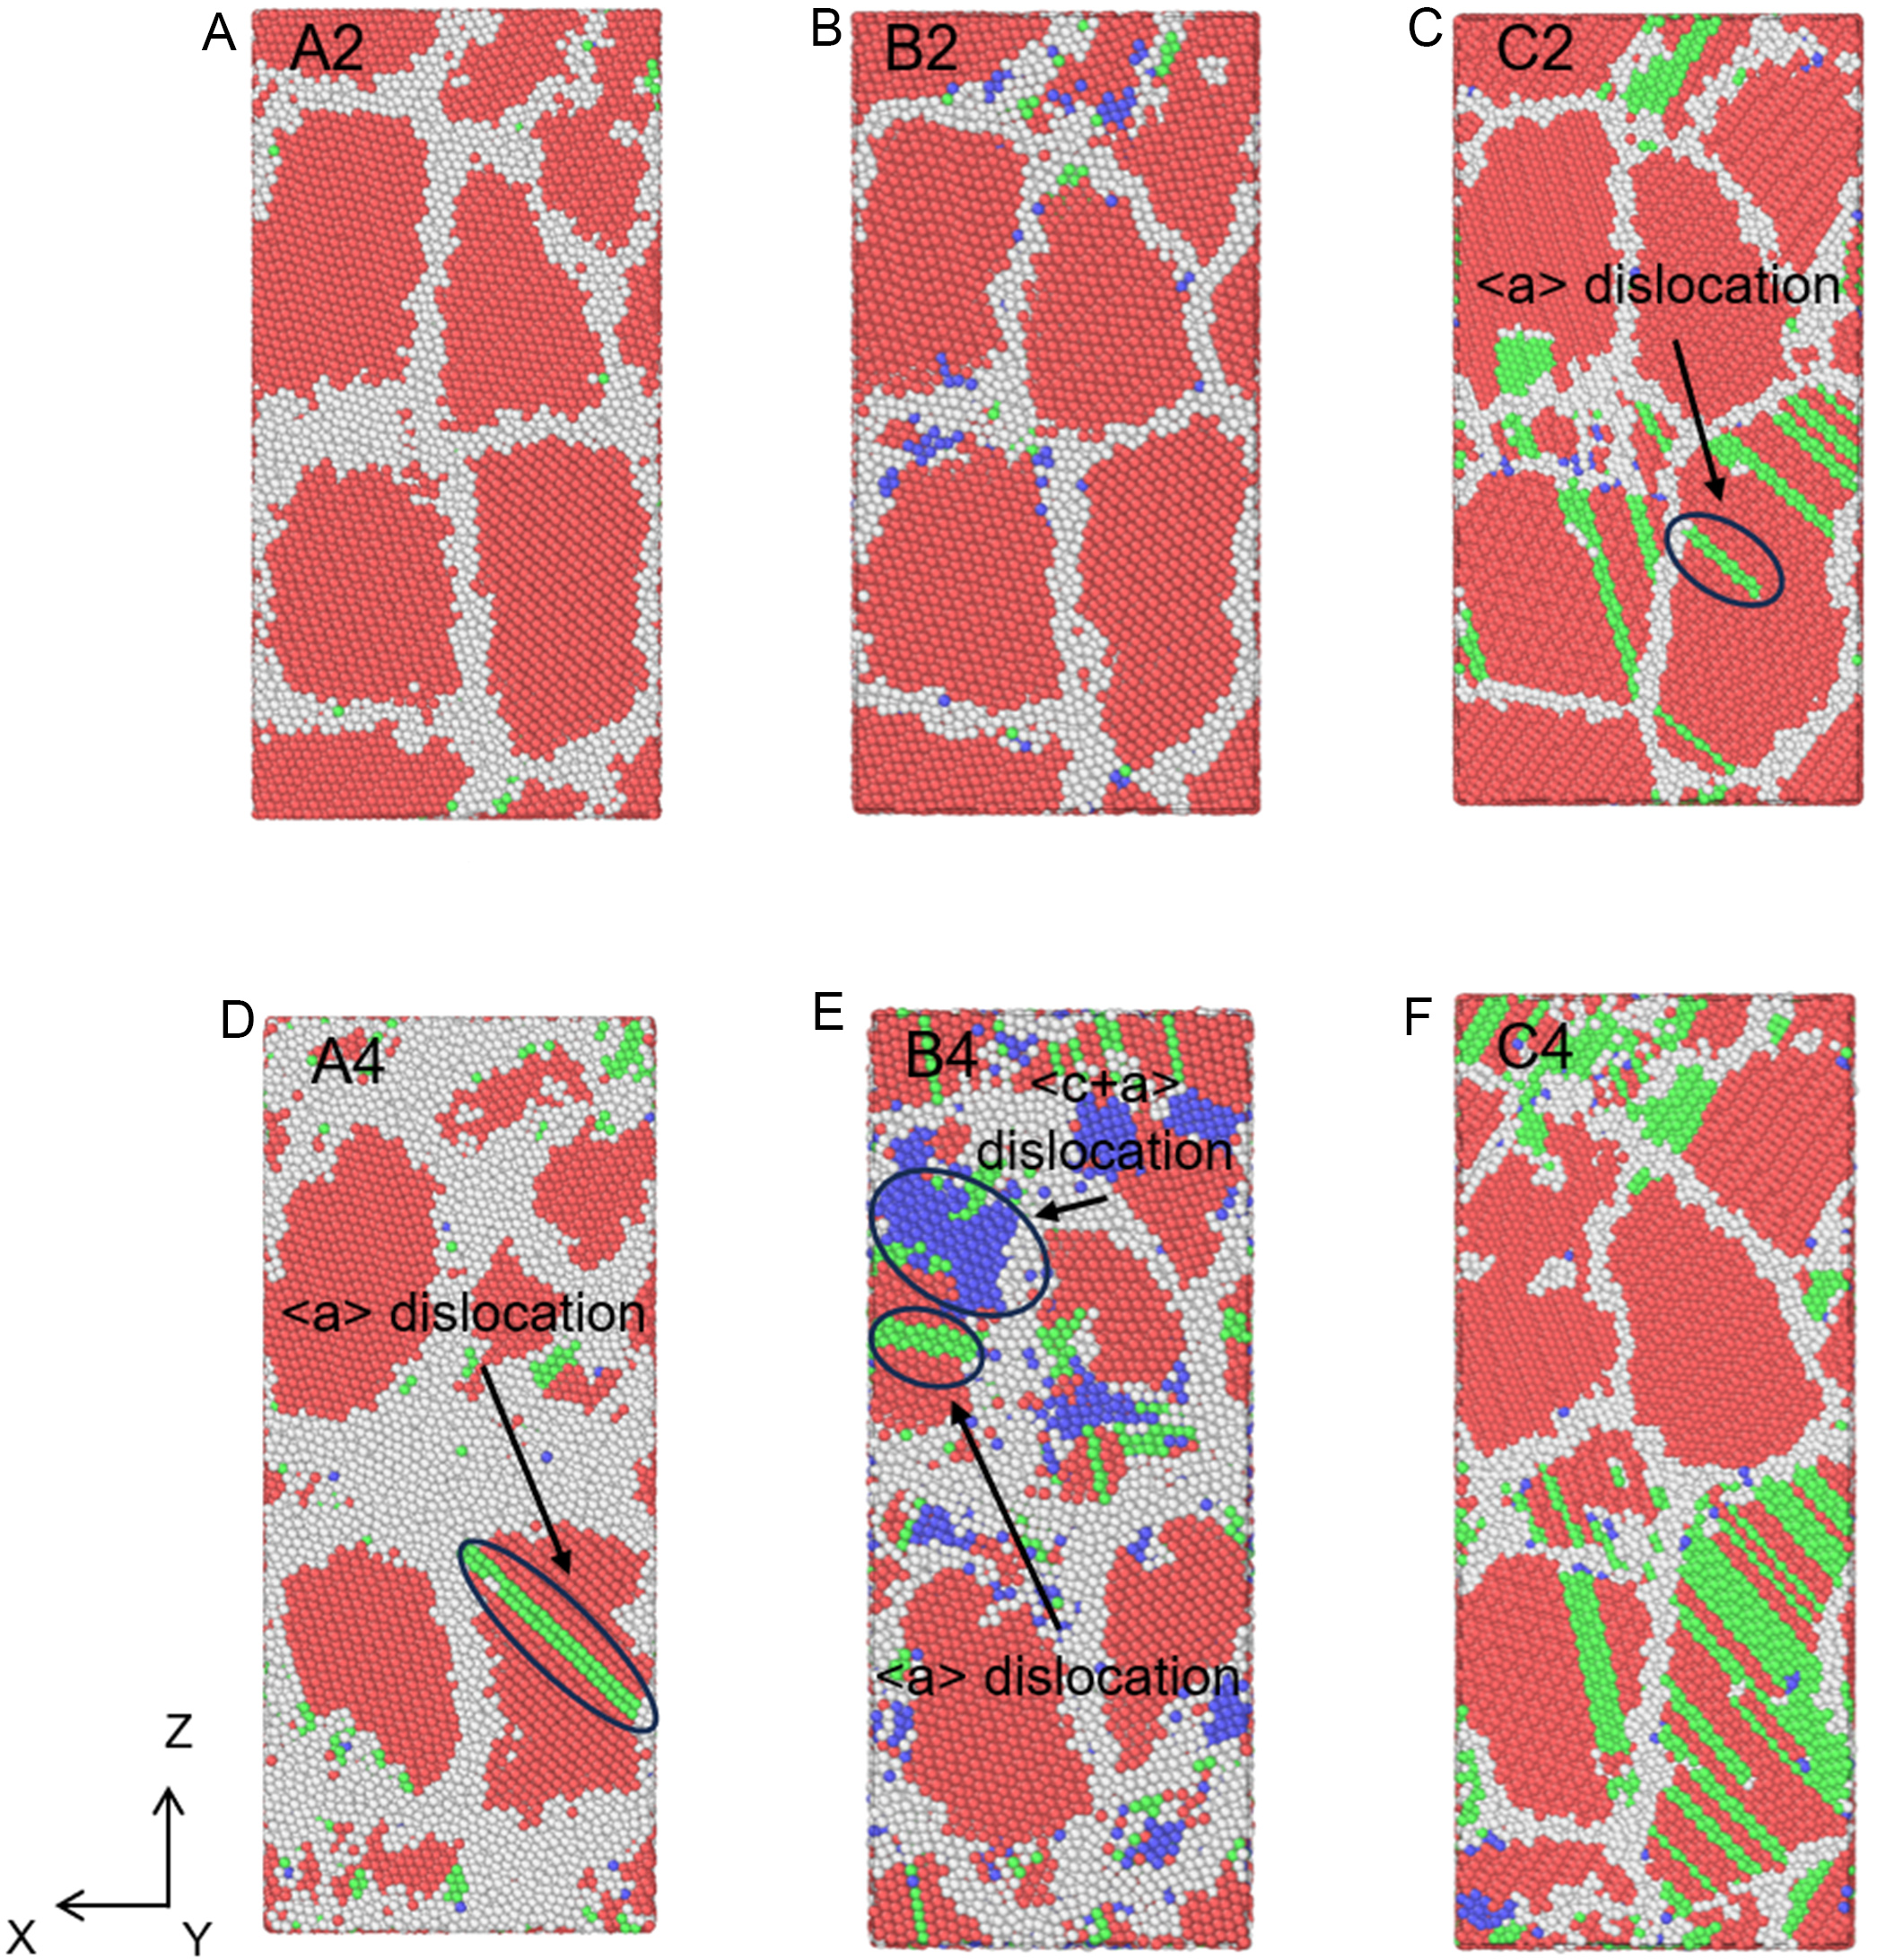
Figure 23. Atomic structures of nanopolycrystalline (A and D) Zn, (B and E) Mg, and (C and F) Be, corresponding to the peak stress (A-C) and stable stress (D and E). Note: Strains for A2/B2/C2 are 5.3%, 6.2%, and 7.5%; strains for A4/B4/C4 are 15.0%. The red, green, blue, and white atoms represent HCP, FCC, BCC, and other structures, respectively. HCP: Hexagonal close-packed; FCC: face-centered cubic; BCC: body-centered cubic.
• Zn [Figure 23A and D]: Plasticity is dominated by grain rotation with sparse dislocation activity.
• Mg [Figure 23B and E]: Shows a mixed mechanism with profuse nucleation of both <a> and <c+a> dislocations.
• Be [Figure 23C and F]: Exhibits dislocation-controlled plasticity, where a drastic increase in <a> dislocation density accommodates the strain.
Additionally, these divergent mechanisms plausibly stem from intrinsic material properties, specifically the c/a ratio, stacking fault energy (SFE), and elastic anisotropy factor (Δ), listed in Table 5. The anisotropy factor is defined as[64]:
Comparison of c/a ratio, stacking fault energies, elastic constants, and anisotropy factor (Δ)[64] for Zn, Mg, and Be, respectively
Zn possesses an anomalously high c/a ratio (1.856) and high elastic anisotropy, stemming from its unique sp-d hybridization bonding nature[65]. These characteristics make non-basal slip energetically difficult, but favor the formation of GB structures with flat energy landscapes (energy plateaus), thereby promoting grain rotation. In contrast, Mg (c/a ≈ 1.63) and Be (c/a ≈ 1.52) have lower anisotropy and distinct SFE values, which energetically favor dislocation generation and motion over boundary rotation.
In summary, the 3D nanocrystalline simulations confirm that the rotation-dominated plasticity in Zn is a robust feature driven by the synergistic interplay of its high c/a ratio and specific electronic bonding. This clearly distinguishes Zn from other HCP metals like Mg and Be, where plasticity is governed by conventional dislocation slip and twinning.
CONCLUSIONS
In this study, a high-fidelity Deep Potential for Zn was developed to investigate the interplay between grain boundary (GB) energetics and plastic deformation. A pivotal finding is the existence of two distinct GB energy plateaus over the tilt angle (2θ) ranges of 10°~90° and 96°~170° for
DECLARATIONS
Authors’ contributions
Conceived and designed the study: Liang, W.; Jin, J.
Developed the code: Liang, W.
Assisted in model development: Ma, X.
Provided valuable suggestions: Jin, J.; Ren, Y.; Qin, G.
Drafted the manuscript: Liang, W.; Jin, J.
All authors reviewed and edited the final version.
Availability of data and materials
The detailed training parameter settings and iteration processes are described in Supplementary Materials. The machine learning potential model of Zn developed in this study is available on GitHub at: https://github.com/NEU-z/Zn-compress-model.git.
AI and AI-assisted tools statement
During the preparation of this manuscript, the AI tool Gemini (version 3.0 Pro, released 2025-11-18) was used solely for language editing. The tool did not influence the study design, data collection, analysis, interpretation, or the scientific content of the work. All authors take full responsibility for the accuracy, integrity, and final content of the manuscript.
Financial support and sponsorship
This work was supported by the National Key Research and Development Program of China (No. 2023YFB3812901) and (No. 2023YFB3812902) for funding the present research.
Conflicts of interest
All authors declared that there are no conflicts of interest.
Ethical approval and consent to participate
Not applicable.
Consent for publication
Not applicable.
Copyright
© The Author(s) 2026.
Supplementary Materials
REFERENCES
1. Zhuo, X.; Wu, Y.; Ju, J.; et al. Recent progress of novel biodegradable zinc alloys: from the perspective of strengthening and toughening. J. Mater. Res. Technol. 2022, 17, 244-69.
2. Liu, Y.; Zeng, Z.; Gong, H.; et al. Work softening behavior and microstructure evolution of Zn-0.12Cu-0.08Ti alloy during cold rolling. J. Alloys. Compd. 2025, 1032, 180998.
3. Li, R.; Ding, Y.; Zhang, H.; Wang, X.; Gao, Y.; Xu, J. Toward high strength and large strain hardening Zn alloys via a novel multiscale-heterostructure strategy. Mater. Sci. Eng. A. 2024, 899, 146410.
4. Song, Z.; Niu, R.; Cui, X.; et al. Mechanism of room-temperature superplasticity in ultrafine-grained Al-Zn alloys. Acta. Mater. 2023, 246, 118671.
5. Hou, M.; Deng, K.; Wang, C.; Nie, K.; Shi, Q. The balance between work hardening and softening behaviors of Mg-xZn-1Gd-0.2Ca-0.1Zr alloys influenced by trace Zn addition. J. Alloys. Compd. 2023, 969, 172379.
6. Zhao, L.; Xia, W.; Yan, H.; Chen, J.; Su, B. Effects of Zn addition on dynamic recrystallization of high strain rate rolled Al-Mg sheets. Met. Mater. Int. 2021, 28, 1264-76.
7. Wu, C.; Lin, F.; Liu, H.; et al. Stronger and coarser-grained biodegradable zinc alloys. Nature 2025, 638, 684-9.
8. Bednarczyk, W.; Kawałko, J.; Wątroba, M.; Szuwarzyński, M.; Bała, P. Investigation of slip systems activity and grain boundary sliding in fine-grained superplastic zinc alloy. Archiv.Civ.Mech.Eng. 2023, 23, 253.
9. Cantwell, P. R.; Tang, M.; Dillon, S. J.; Luo, J.; Rohrer, G. S.; Harmer, M. P. Grain boundary complexions. Acta. Mater. 2014, 62, 1-48.
10. Wei, J.; Feng, B.; Ishikawa, R.; et al. Direct imaging of atomistic grain boundary migration. Nat. Mater. 2021, 20, 951-5.
11. Schweizer, P.; Sharma, A.; Pethö, L.; et al. Atomic scale volume and grain boundary diffusion elucidated by in situ STEM. Nat. Commun. 2023, 14, 7601.
12. Zhang, X.; Wang, D.; Nagaumi, H.; et al. Accelerating the design of highly separable Fe‐containing intermetallics in Al-Si alloys via DFT calculations and experimental validation. Mater. Genome. Eng. Adv. 2025, 3, e70008.
13. Yang, P.; Li, S.; Xie, H.; et al. Two-dimensional interface superstructures assembled by well-ordered solute atoms. J. Mater. Sci. Technol. 2023, 142, 253-9.
14. Kosarev, I.; Shcherbinin, S.; Kistanov, A.; Babicheva, R.; Korznikova, E.; Dmitriev, S. An approach to evaluate the accuracy of interatomic potentials as applied to tungsten. Comput. Mater. Sci. 2024, 231, 112597.
15. Mishin, Y. Machine-learning interatomic potentials for materials science. Acta. Mater. 2021, 214, 116980.
16. Nie, J.; Hu, C.; Yan, Q.; Luo, J. Discovery of electrochemically induced grain boundary transitions. Nat. Commun. 2021, 12, 2374.
17. Behler, J. Perspective: machine learning potentials for atomistic simulations. J. Chem. Phys. 2016, 145, 170901.
18. Zhang, L.; Han, J.; Wang, H.; Car, R.; E, W. Deep potential molecular dynamics: a scalable model with the accuracy of quantum mechanics. Phys. Rev. Lett. 2018, 120, 143001.
19. Deringer, V. L.; Bernstein, N.; Csányi, G.; et al. Origins of structural and electronic transitions in disordered silicon. Nature 2021, 589, 59-64.
20. Zeng, J.; Cao, L.; Xu, M.; Zhu, T.; Zhang, J. Z. H. Complex reaction processes in combustion unraveled by neural network-based molecular dynamics simulation. Nat. Commun. 2020, 11, 5713.
21. Jia, W.; Wang, H.; Chen, M.; et al. Pushing the limit of molecular dynamics with ab initio accuracy to 100 million atoms with machine learning. In SC20: International Conference for High Performance Computing, Networking, Storage and Analysis, Atlanta, GA, USA, November 9-19, 2020; IEEE: New York, NY, USA, 2020; pp 1-14.
22. Su, H.; Zheng, S.; Yang, Z.; Wang, J.; Ye, H. Atomic-scale insights into grain boundary-mediated plasticity mechanisms in a magnesium alloy subjected to cyclic deformation. Acta. Mater. 2024, 277, 120210.
23. Du, C.; Gao, Y.; Zha, M.; Wang, C.; Jia, H.; Wang, H. Deformation-induced grain rotation and grain boundary formation achieved through dislocation-disclination reactions in polycrystalline hexagonal close-packed metals. Acta. Mater. 2023, 250, 118855.
24. Ma, Z. C.; Tang, X. Z.; Mao, Y.; Guo, Y. F. The plastic deformation mechanisms of hcp single crystals with different orientations: molecular dynamics simulations. Materials 2021, 14, 733.
25. Gou, W.; Shi, Z. Z.; Zhu, Y.; et al. Multi‐objective optimization of three mechanical properties of Mg alloys through machine learning. Mater. Genome. Eng. Adv. 2024, 2, e54.
26. Della Ventura, N. M.; Sharma, A.; Cayron, C.; et al. Response of magnesium microcrystals to c-axis compression and contraction loadings at low and high strain rates. Acta. Mater. 2023, 248, 118762.
27. Liu, B. Y.; Zhang, Z.; Liu, F.; et al. Rejuvenation of plasticity via deformation graining in magnesium. Nat. Commun. 2022, 13, 1060.
28. Fang, Q.; Sansoz, F. Columnar grain-driven plasticity and cracking in nanotwinned FCC metals. Acta. Mater. 2021, 212, 116925.
29. Chang, Z.; Feng, L.; Xue, H. T.; et al. Deep-learning potential molecular dynamics study on nanopolycrystalline Al-Er alloys: effects of Er concentration, grain boundary segregation, and grain size on plastic deformation. J. Chem. Inf. Model. 2025, 65, 3282-93.
30. Wang, H. Molecular modeling by machine learning. Math. Numer. Sin. 2021, 43. , 261-78. (in Chinese).
31. Wu, J.; Huang, A.; Xie, H. P.; et al. Multi-scale simulation of mechanical and thermal transport properties of materials based on machine learning potential. J. Chin. Ceram. Soc. 2023, 51, 531-43. (in Chinese).
32. Zhang, Y.; Wang, H.; Chen, W.; et al. DP-GEN: a concurrent learning platform for the generation of reliable deep learning based potential energy models. Comput. Phys. Commun. 2020, 253, 107206.
33. Wang, H.; Zhang, L.; Han, J.; E, W. DeePMD-kit: a deep learning package for many-body potential energy representation and molecular dynamics. Comput. Phys. Commun. 2018, 228, 178-84.
34. Kresse, G.; Hafner, J. Ab initio molecular dynamics for liquid metals. Phys. Rev. B. Condens. Matter. 1993, 47, 558-61.
35. Kresse, G.; Hafner, J. Ab initio molecular dynamics for open-shell transition metals. Phys. Rev. B. Condens. Matter. 1993, 48, 13115-8.
36. Perdew, J. P.; Burke, K.; Ernzerhof, M. Generalized gradient approximation made simple. Phys. Rev. Lett. 1996, 77, 3865-8.
37. Monkhorst, H. J.; Pack, J. D. Special points for Brillouin-zone integrations. Phys. Rev. B. 1976, 13, 5188-92.
38. Xu, C.; Tian, X.; Jiang, W.; Wang, Q.; Fan, H. Atomistic migration mechanisms of
39. Tschopp, M. A.; Mcdowell, D. L. Structures and energies of Σ3 asymmetric tilt grain boundaries in copper and aluminium. Philos. Mag. 2007, 87, 3147-73.
40. Hirel, P. Atomsk: a tool for manipulating and converting atomic data files. Comput. Phys. Commun. 2015, 197, 212-9.
41. Brostow, W.; Dussault, J.; Fox, B. L. Construction of Voronoi polyhedra. J. Comput. Phys. 1978, 29, 81-92.
42. Plimpton, S. Fast parallel algorithms for short-range molecular dynamics. J. Comput. Phys. 1995, 117, 1-19.
43. Stukowski, A. Visualization and analysis of atomistic simulation data with OVITO-the Open Visualization Tool. Modelling. Simul. Mater. Sci. Eng. 2010, 18, 015012.
44. Jang, H.; Kim, K.; Lee, B. Modified embedded-atom method interatomic potentials for pure Zn and Mg-Zn binary system. Calphad 2018, 60, 200-7.
45. Wang, J.; Beyerlein, I. J. Atomic structures of
46. Liu, X.; Adams, J. B.; Ercolessi, F.; Moriarty, J. A. EAM potential for magnesium from quantum mechanical forces. Model. Simul. Mater. Sci. Eng. 1996, 4, 293-303.
47. Agrawal, A.; Mishra, R.; Ward, L.; Flores, K. M.; Windl, W. An embedded atom method potential of beryllium. Model. Simul. Mater. Sci. Eng. 2013, 21, 085001.
48. Nitol, M. S.; Dickel, D. E.; Barrett, C. D. Artificial neural network potential for pure zinc. Comput. Mater. Sci. 2021, 188, 110207.
49. Mei, H.; Cheng, L.; Chen, L.; Wang, F.; Li, J.; Kong, L. Development of machine learning interatomic potential for zinc. Comput. Mater. Sci. 2024, 233, 112723.
50. Kittel, C. Introduction to solid state physics, 8th ed.; Wiley, 2004. https://www.wiley.com/en-us/Introduction+to+Solid+State+Physics%2C+8th+Edition-p-9780471415268. (accessed 2026-04-22).
51. Ledbetter, H. M. Elastic properties of zinc: a compilation and a review. J. Phys. Chem. Ref. Data. 1977, 6, 1181-203.
53. Togo, A.; Tanaka, I. First principles phonon calculations in materials science. Scr. Mater. 2015, 108, 1-5.
54. Chaput, L.; Togo, A.; Tanaka, I.; Hug, G. Phonon-phonon interactions in transition metals. Phys. Rev. B. 2011, 84, 094302.
55. Gajdoš, M.; Hummer, K.; Kresse, G.; Furthmüller, J.; Bechstedt, F. Linear optical properties in the projector-augmented wave methodology. Phys. Rev. B. 2006, 73, 045112.
56. Baroni, S.; Giannozzi, P.; Testa, A. Green’s-function approach to linear response in solids. Phys. Rev. Lett. 1987, 58, 1861-4.
57. Gonze, X.; Lee, C. Dynamical matrices, Born effective charges, dielectric permittivity tensors, and interatomic force constants from density-functional perturbation theory. Phys. Rev. B. 1997, 55, 10355-68.
58. Gengor, G.; Mohammed, A. S. K.; Sehitoglu, H.
59. Kumar, A.; Wang, J.; Tomé, C. N. First-principles study of energy and atomic solubility of twinning-associated boundaries in hexagonal metals. Acta. Mater. 2015, 85, 144-54.
60. Lu, D.; Jiang, W.; Chen, Y.; et al. DP compress: a model compression scheme for generating efficient Deep Potential models. J. Chem. Theory. Comput. 2022, 18, 5559-67.
61. Tsuzuki, H.; Branicio, P. S.; Rino, J. P. Structural characterization of deformed crystals by analysis of common atomic neighborhood. Comput. Phys. Commun. 2007, 177, 518-23.
62. Sun, H.; Singh, C. V. Temperature dependence of grain boundary excess free volume. Scr. Mater. 2020, 178, 71-6.
63. Wang, H.; Jin, J.; Wang, D.; et al. Energetic and structure characteristics of the
64. Baskes, M. I.; Johnson, R. A. Modified embedded atom potentials for HCP metals. Model. Simul. Mater. Sci. Eng. 1994, 2, 147-63.
Cite This Article
How to Cite
Download Citation
Export Citation File:
Type of Import
Tips on Downloading Citation
Citation Manager File Format
Type of Import
Direct Import: When the Direct Import option is selected (the default state), a dialogue box will give you the option to Save or Open the downloaded citation data. Choosing Open will either launch your citation manager or give you a choice of applications with which to use the metadata. The Save option saves the file locally for later use.
Indirect Import: When the Indirect Import option is selected, the metadata is displayed and may be copied and pasted as needed.
About This Article
Special Topic
Copyright

Data & Comments
Data
0


Comments
Comments must be written in English. Spam, offensive content, impersonation, and private information will not be permitted. If any comment is reported and identified as inappropriate content by OAE staff, the comment will be removed without notice. If you have any queries or need any help, please contact us at [email protected].