


fig1
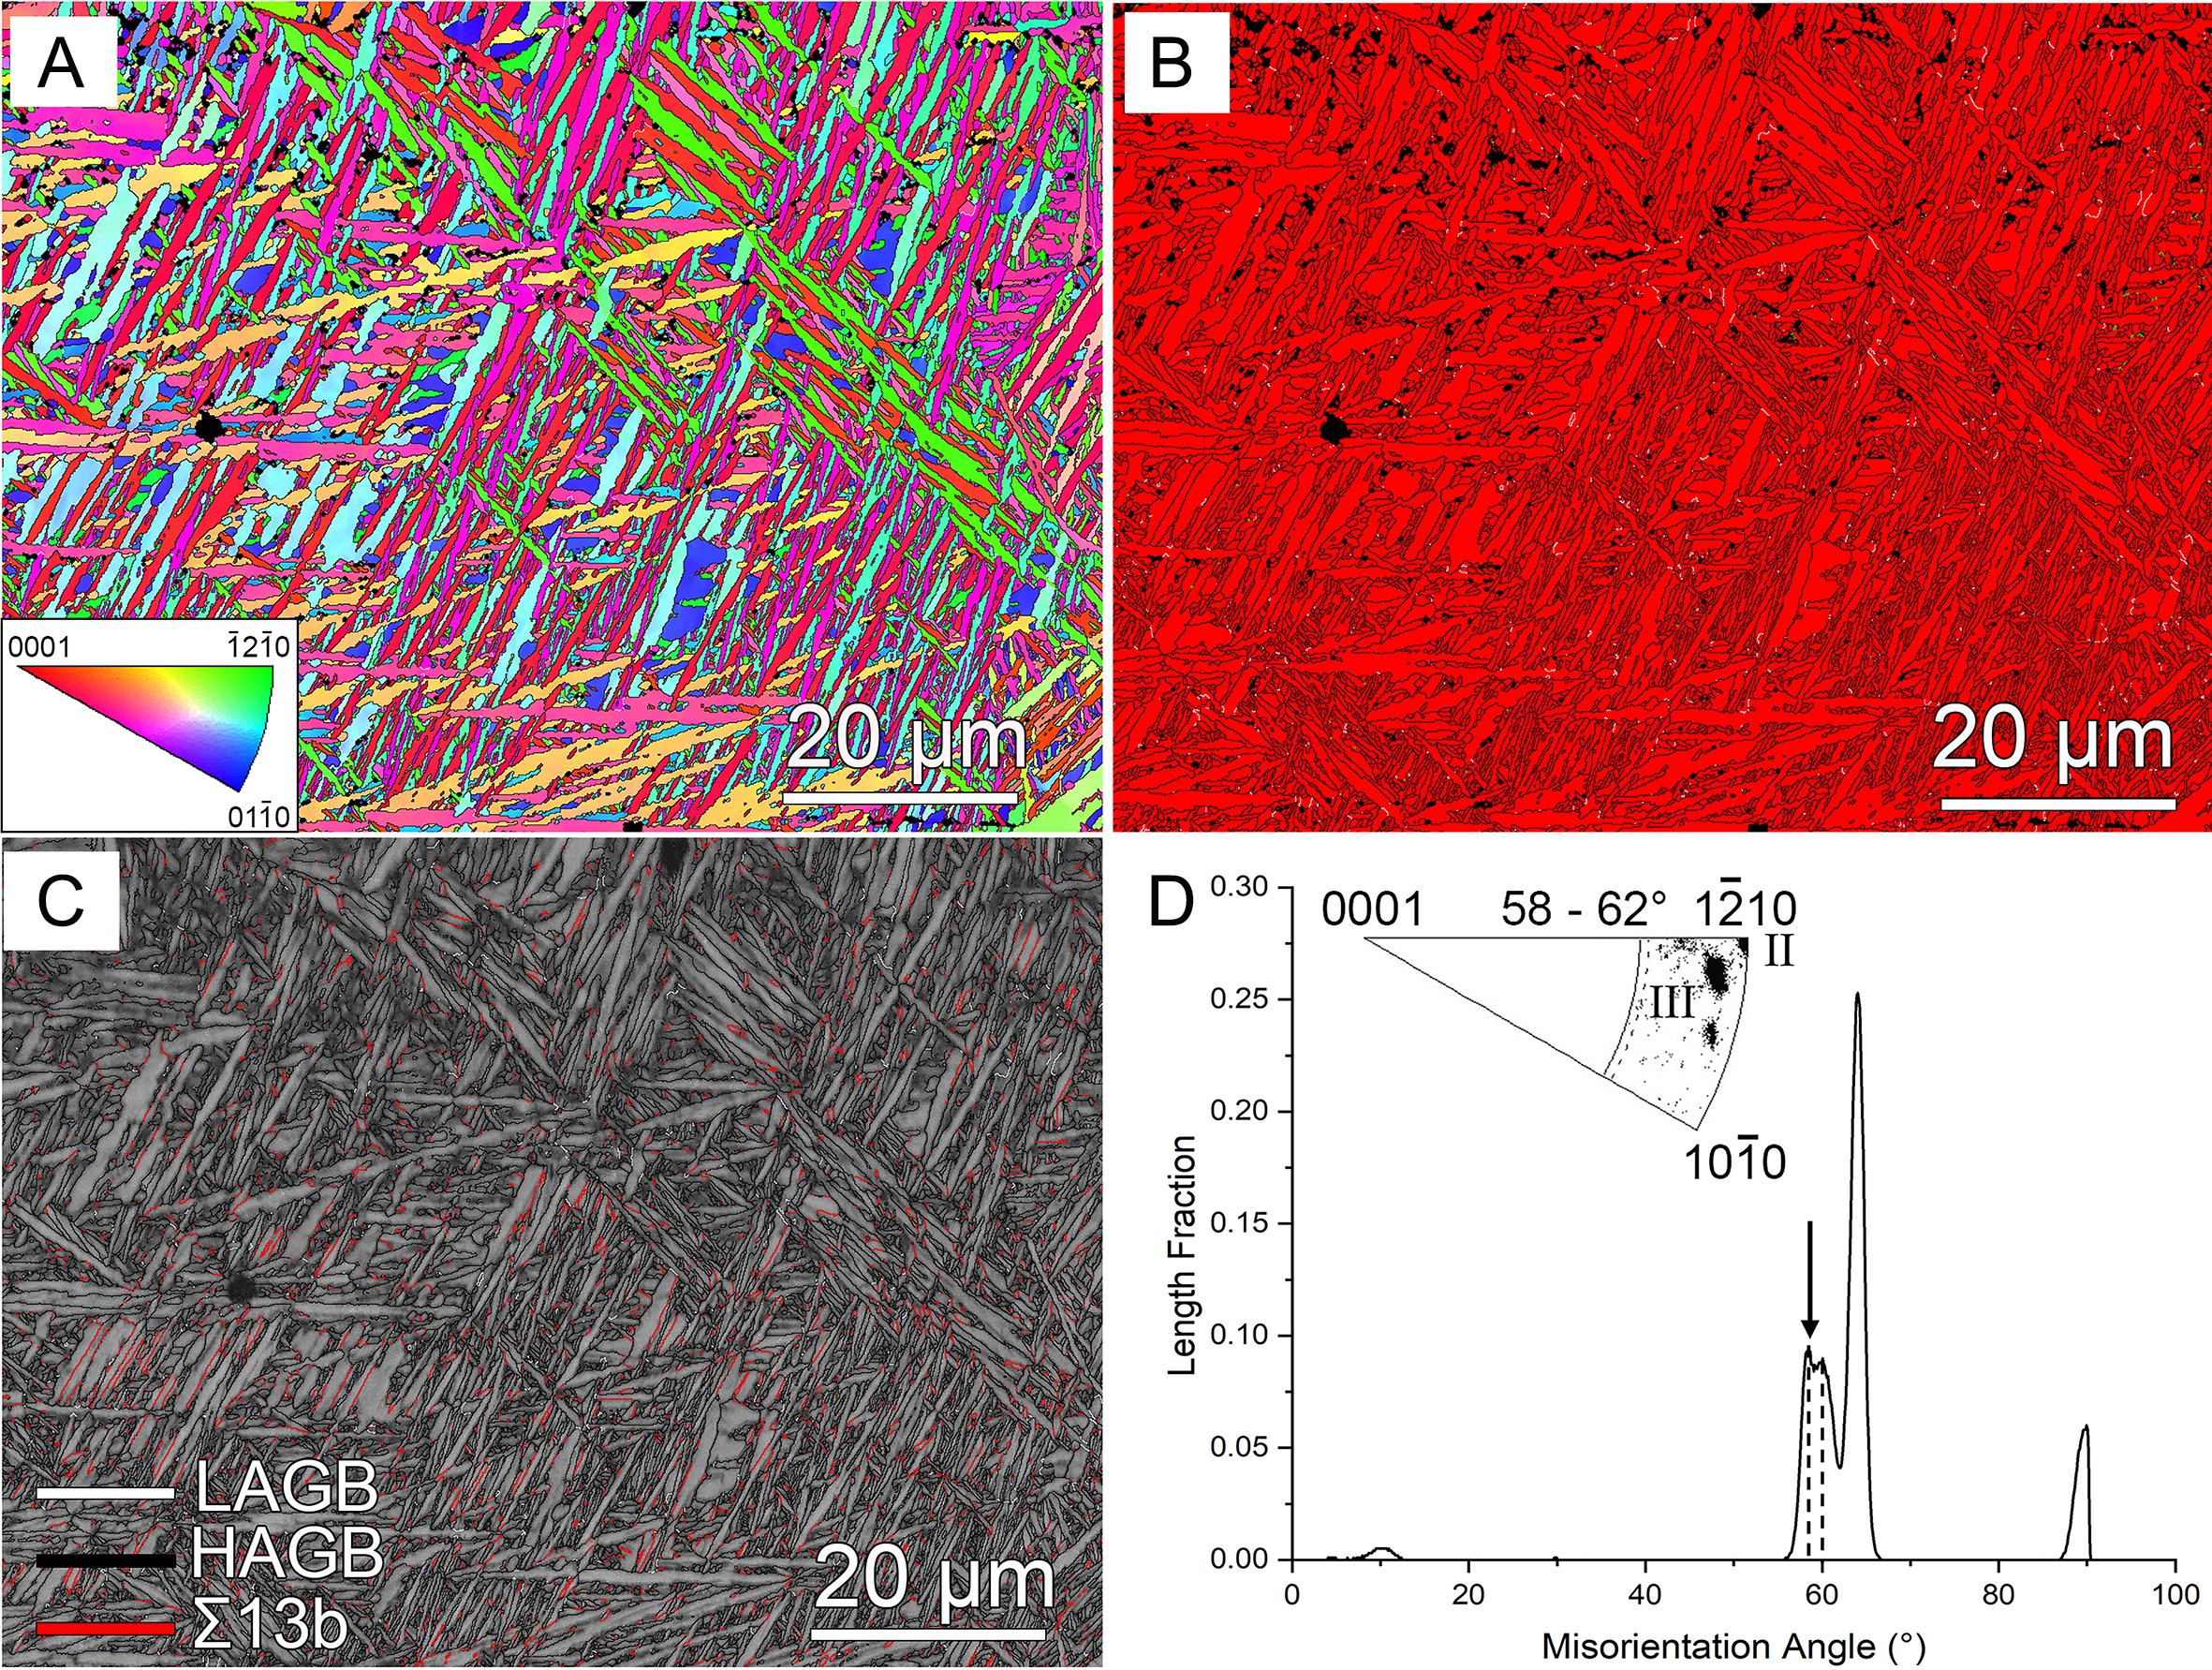
Figure 1. Microstructure in the as-fabricated plan-view Ti-6Al-4V specimen. (A) EBSD IPF map and (B) EBSD phase map. (C) Corresponding GB map on top of the image quality map showing three GB types. (D) The corresponding misorientation profile generated from the EBSD data.


