


fig5
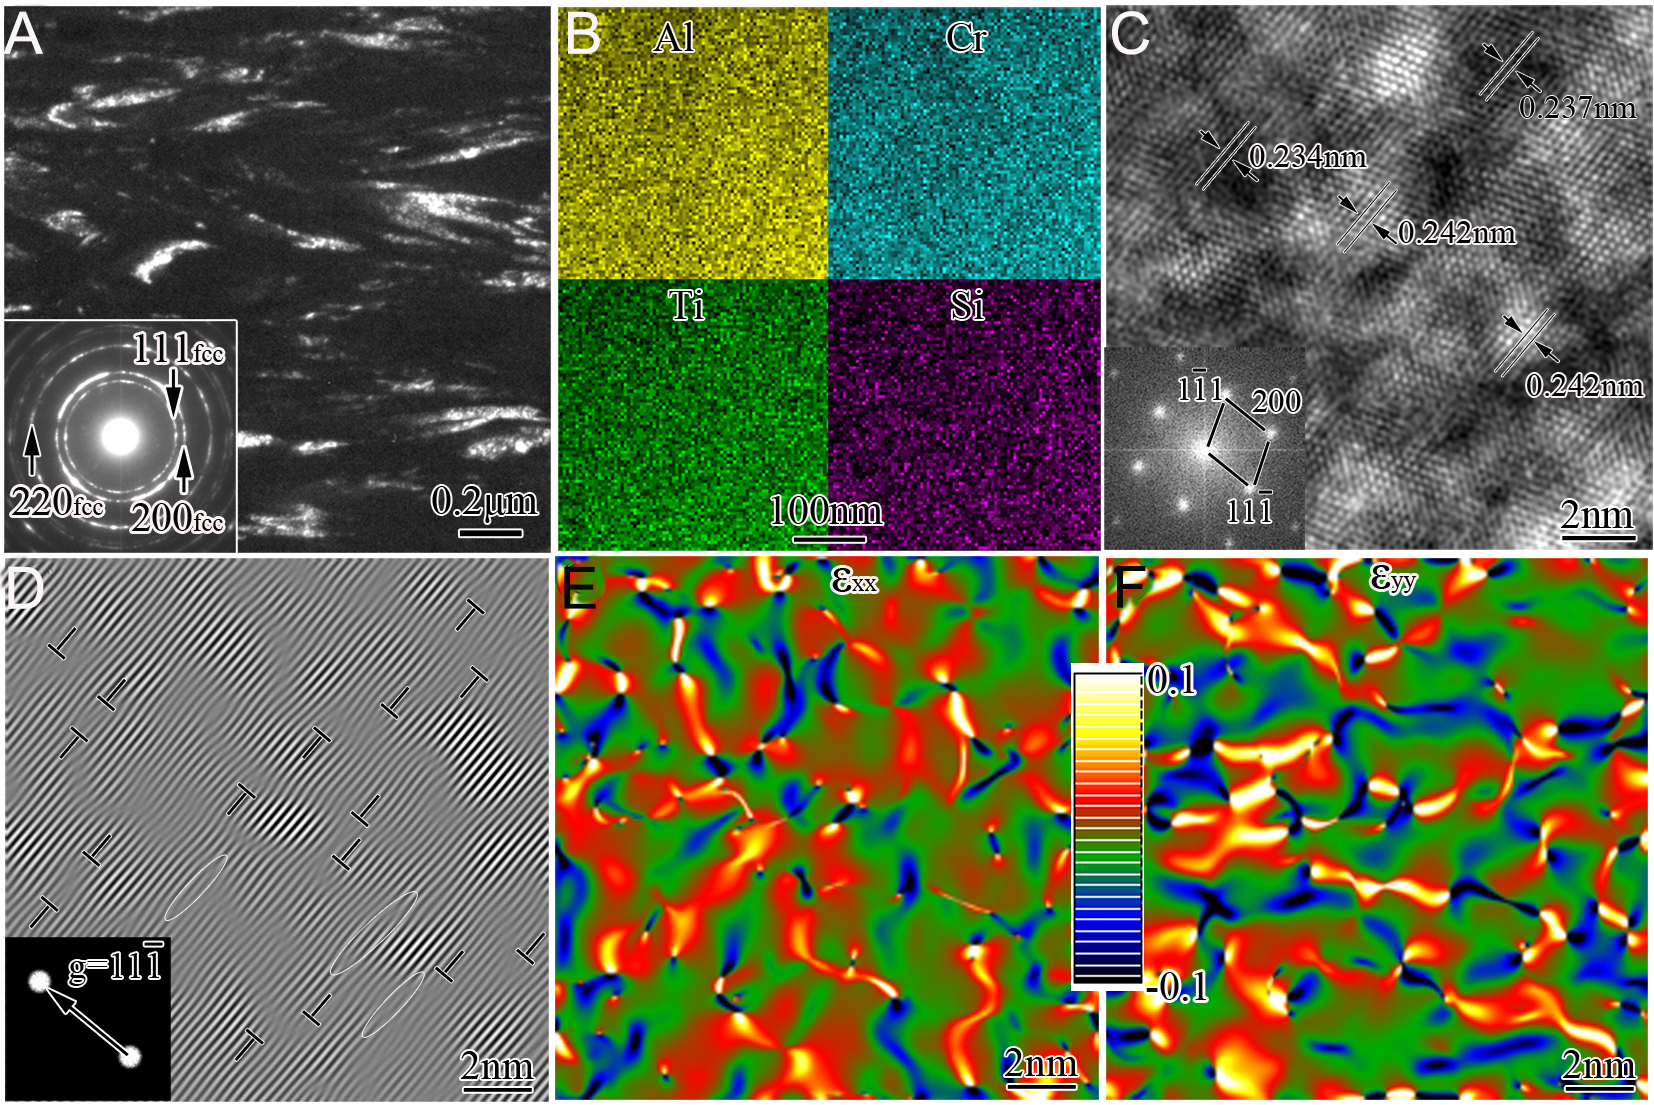
Figure 5. Typical cross-sectional TEM and HRTEM images of sample No. 5: (A) CDF image viewed along the g = 200 reflection with indexed SAEDP inset; (B) EDS mapping of Al, Cr, Ti, and Si within the region in (A); (C) HRTEM image of an fcc grain in (A) with FFT inset; (D) IFFT image of (C) viewed along the g = (11


