


fig3
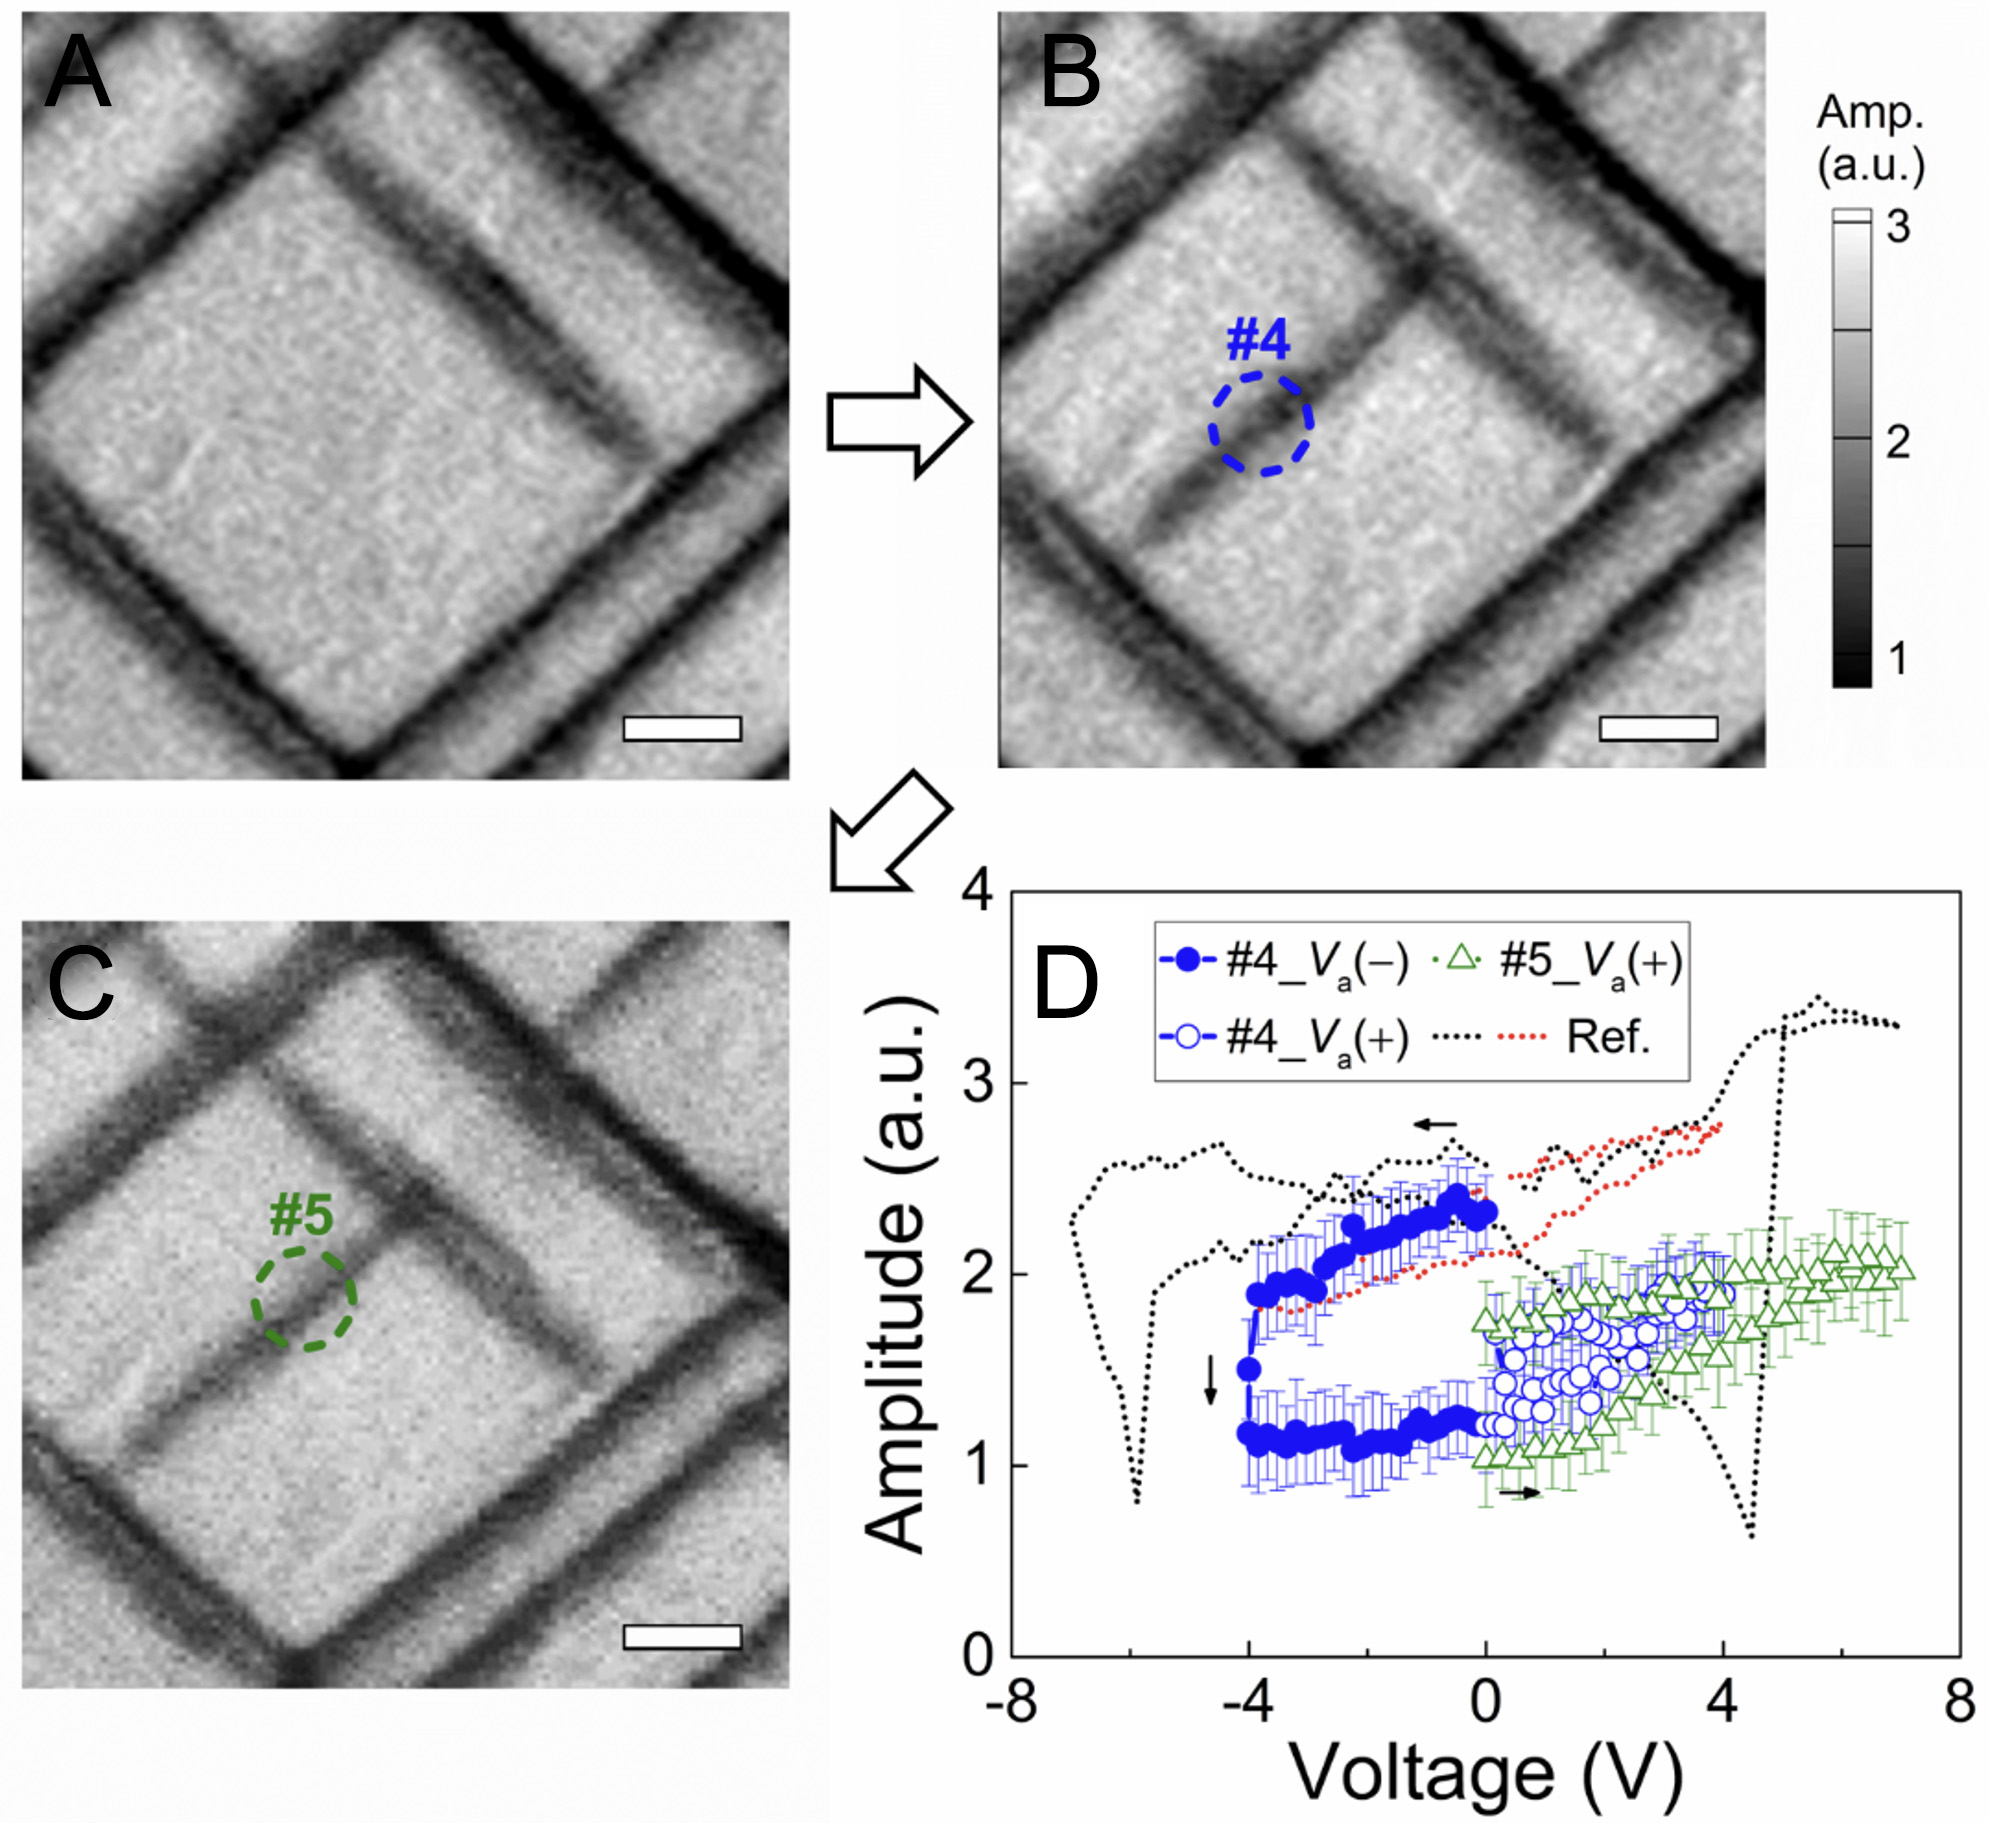
Figure 3. PFM amplitude images of (A) the initial state, (B) Va = -4 V at position #4, and (C) Va = +4 V at positions #4 following Va = +7 V at position #5. The white scale bar represents 200 nm; (D) Voltage-dependent PFM amplitude curves measured at positions #4 (blue circles), #5 (green triangles) under negative [Va(-), closed symbols] and positive [Va(+), open symbols] bias. The conventional amplitude response near the tested c-domain (dotted black and red lines) is shown for reference. Black arrows indicate the direction of the voltage sweeps. PFM: Piezoelectric force microscopy.


