


fig9
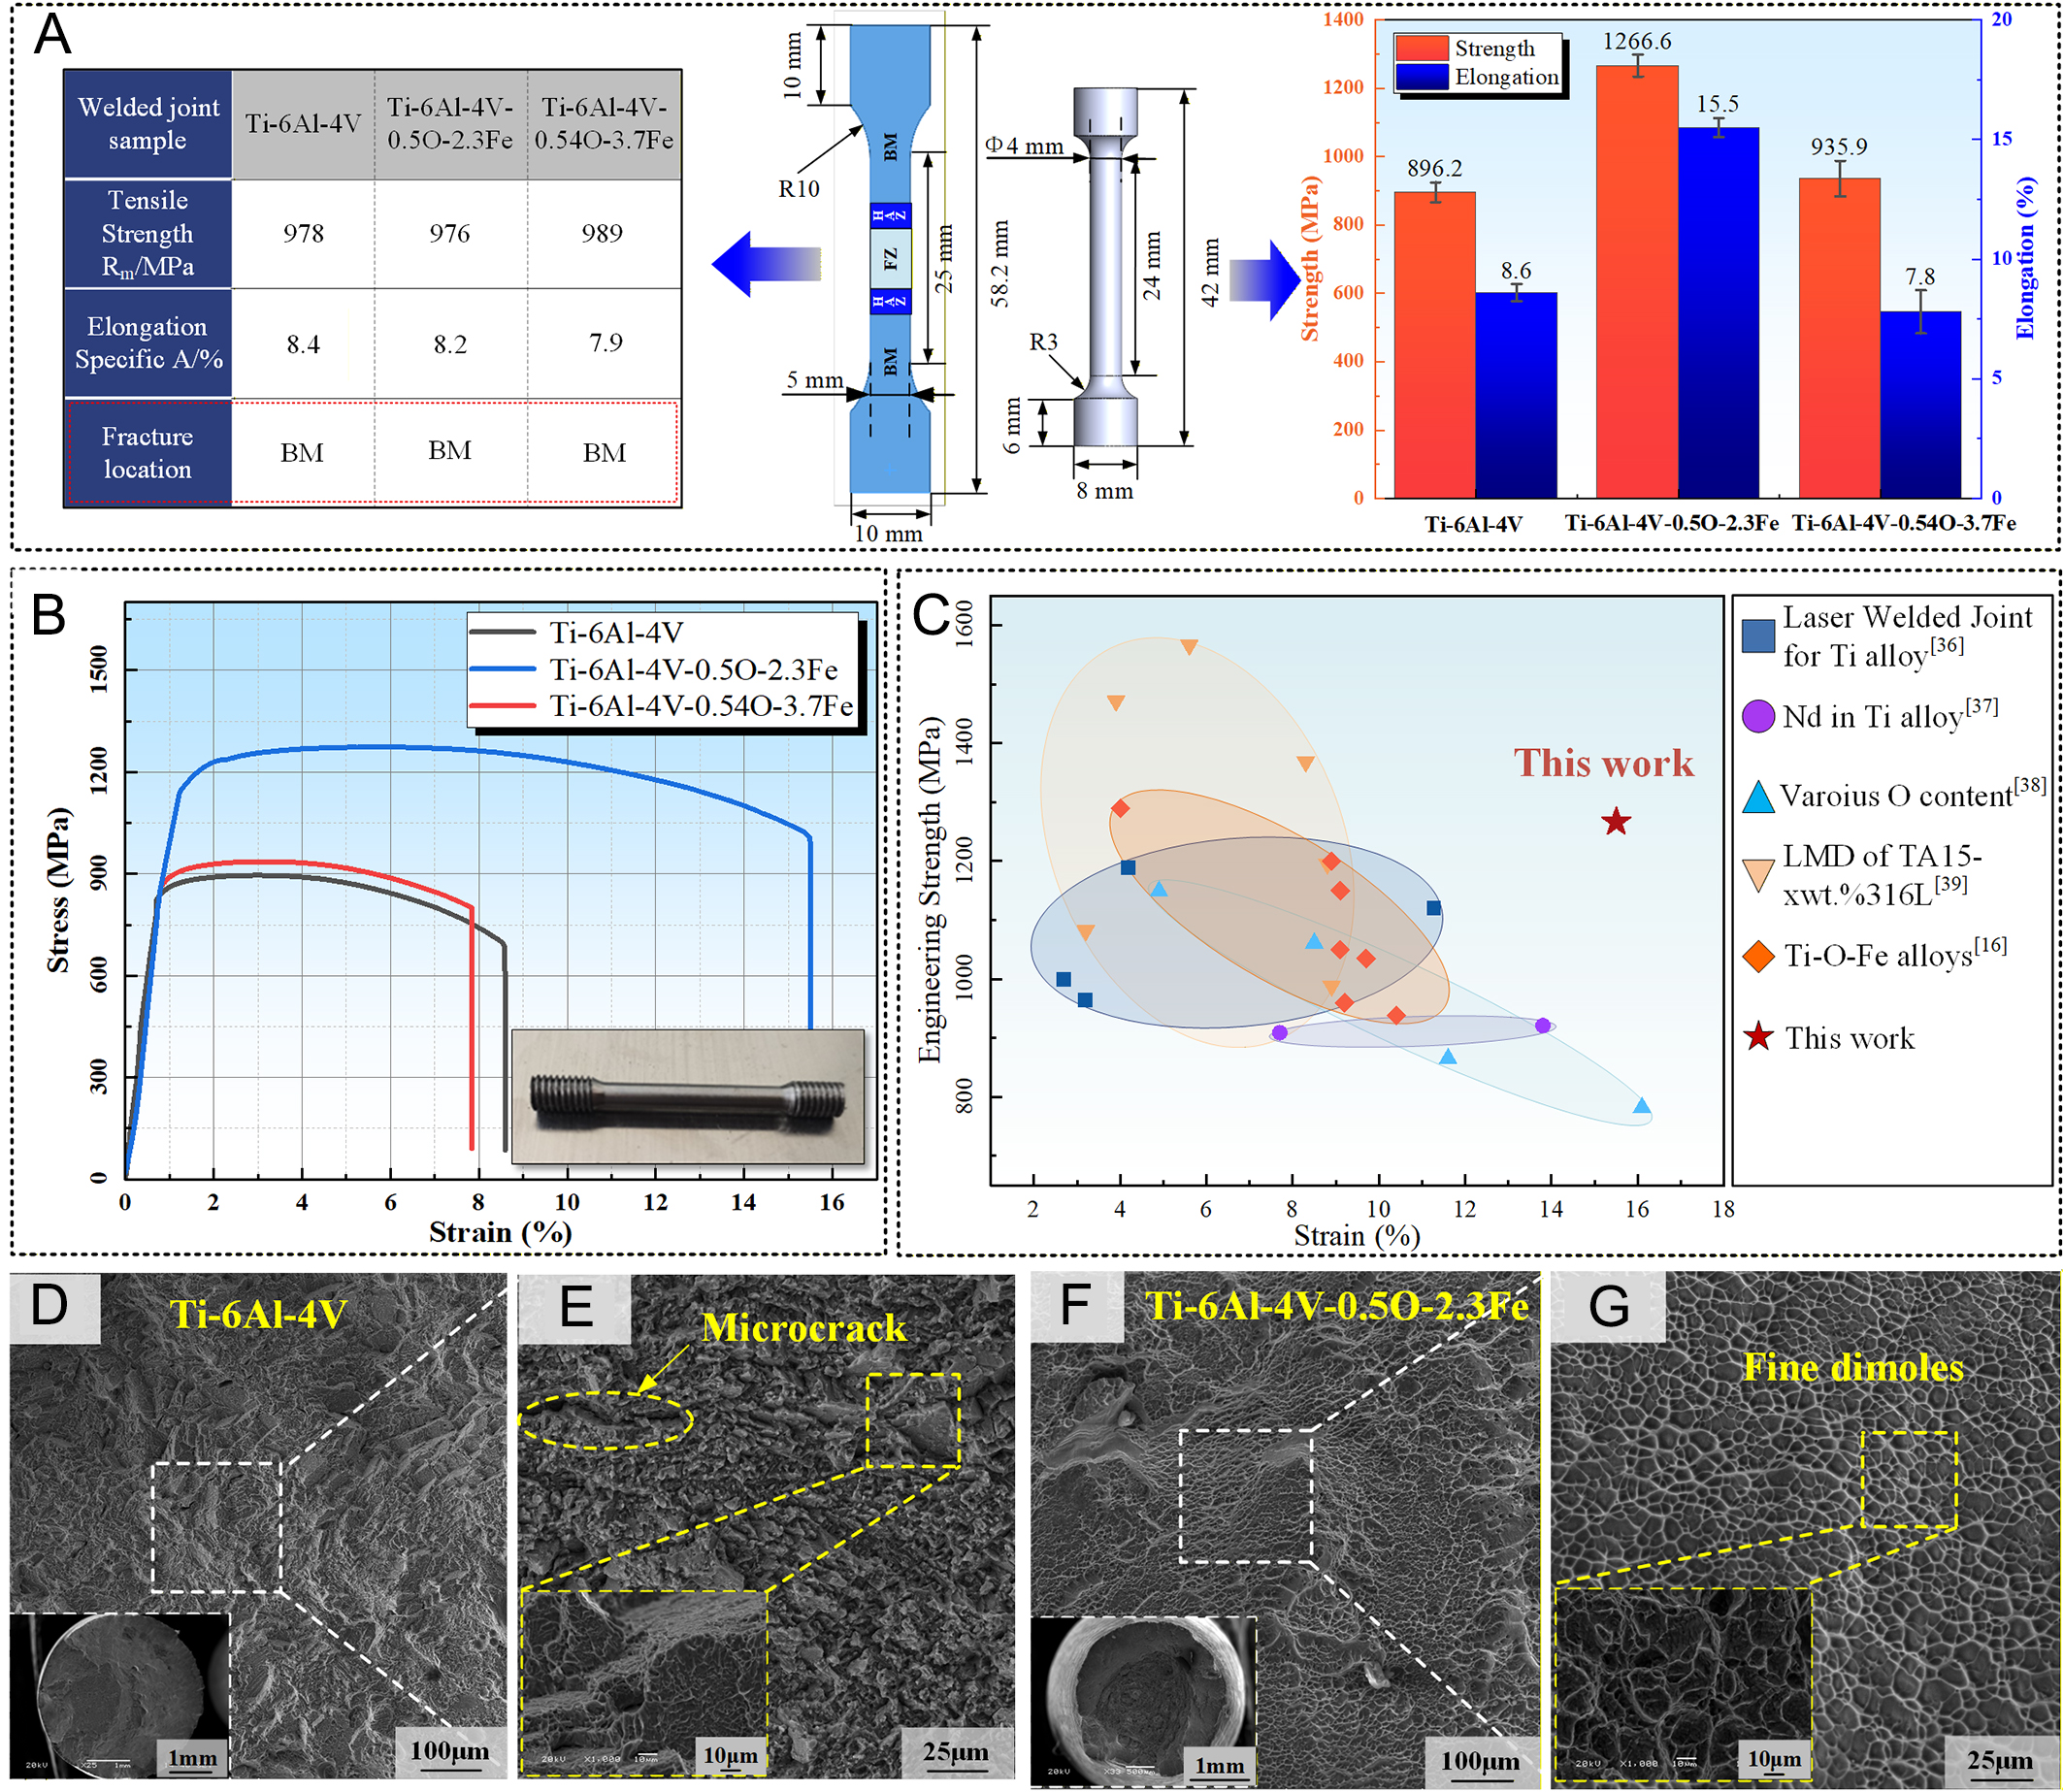
Figure 9. Tensile performance analysis: (A) The results of the tensile test; (B and C) Microalloying composition effects on tensile strength and elongation; (C) Comparative performance with literature data[20,40-43]; (D-G) Macroscopic and microscopic morphology of the tensile fracture surface. Error bars represent the standard deviation based on three independent repetitions (n = 3).


