


fig7
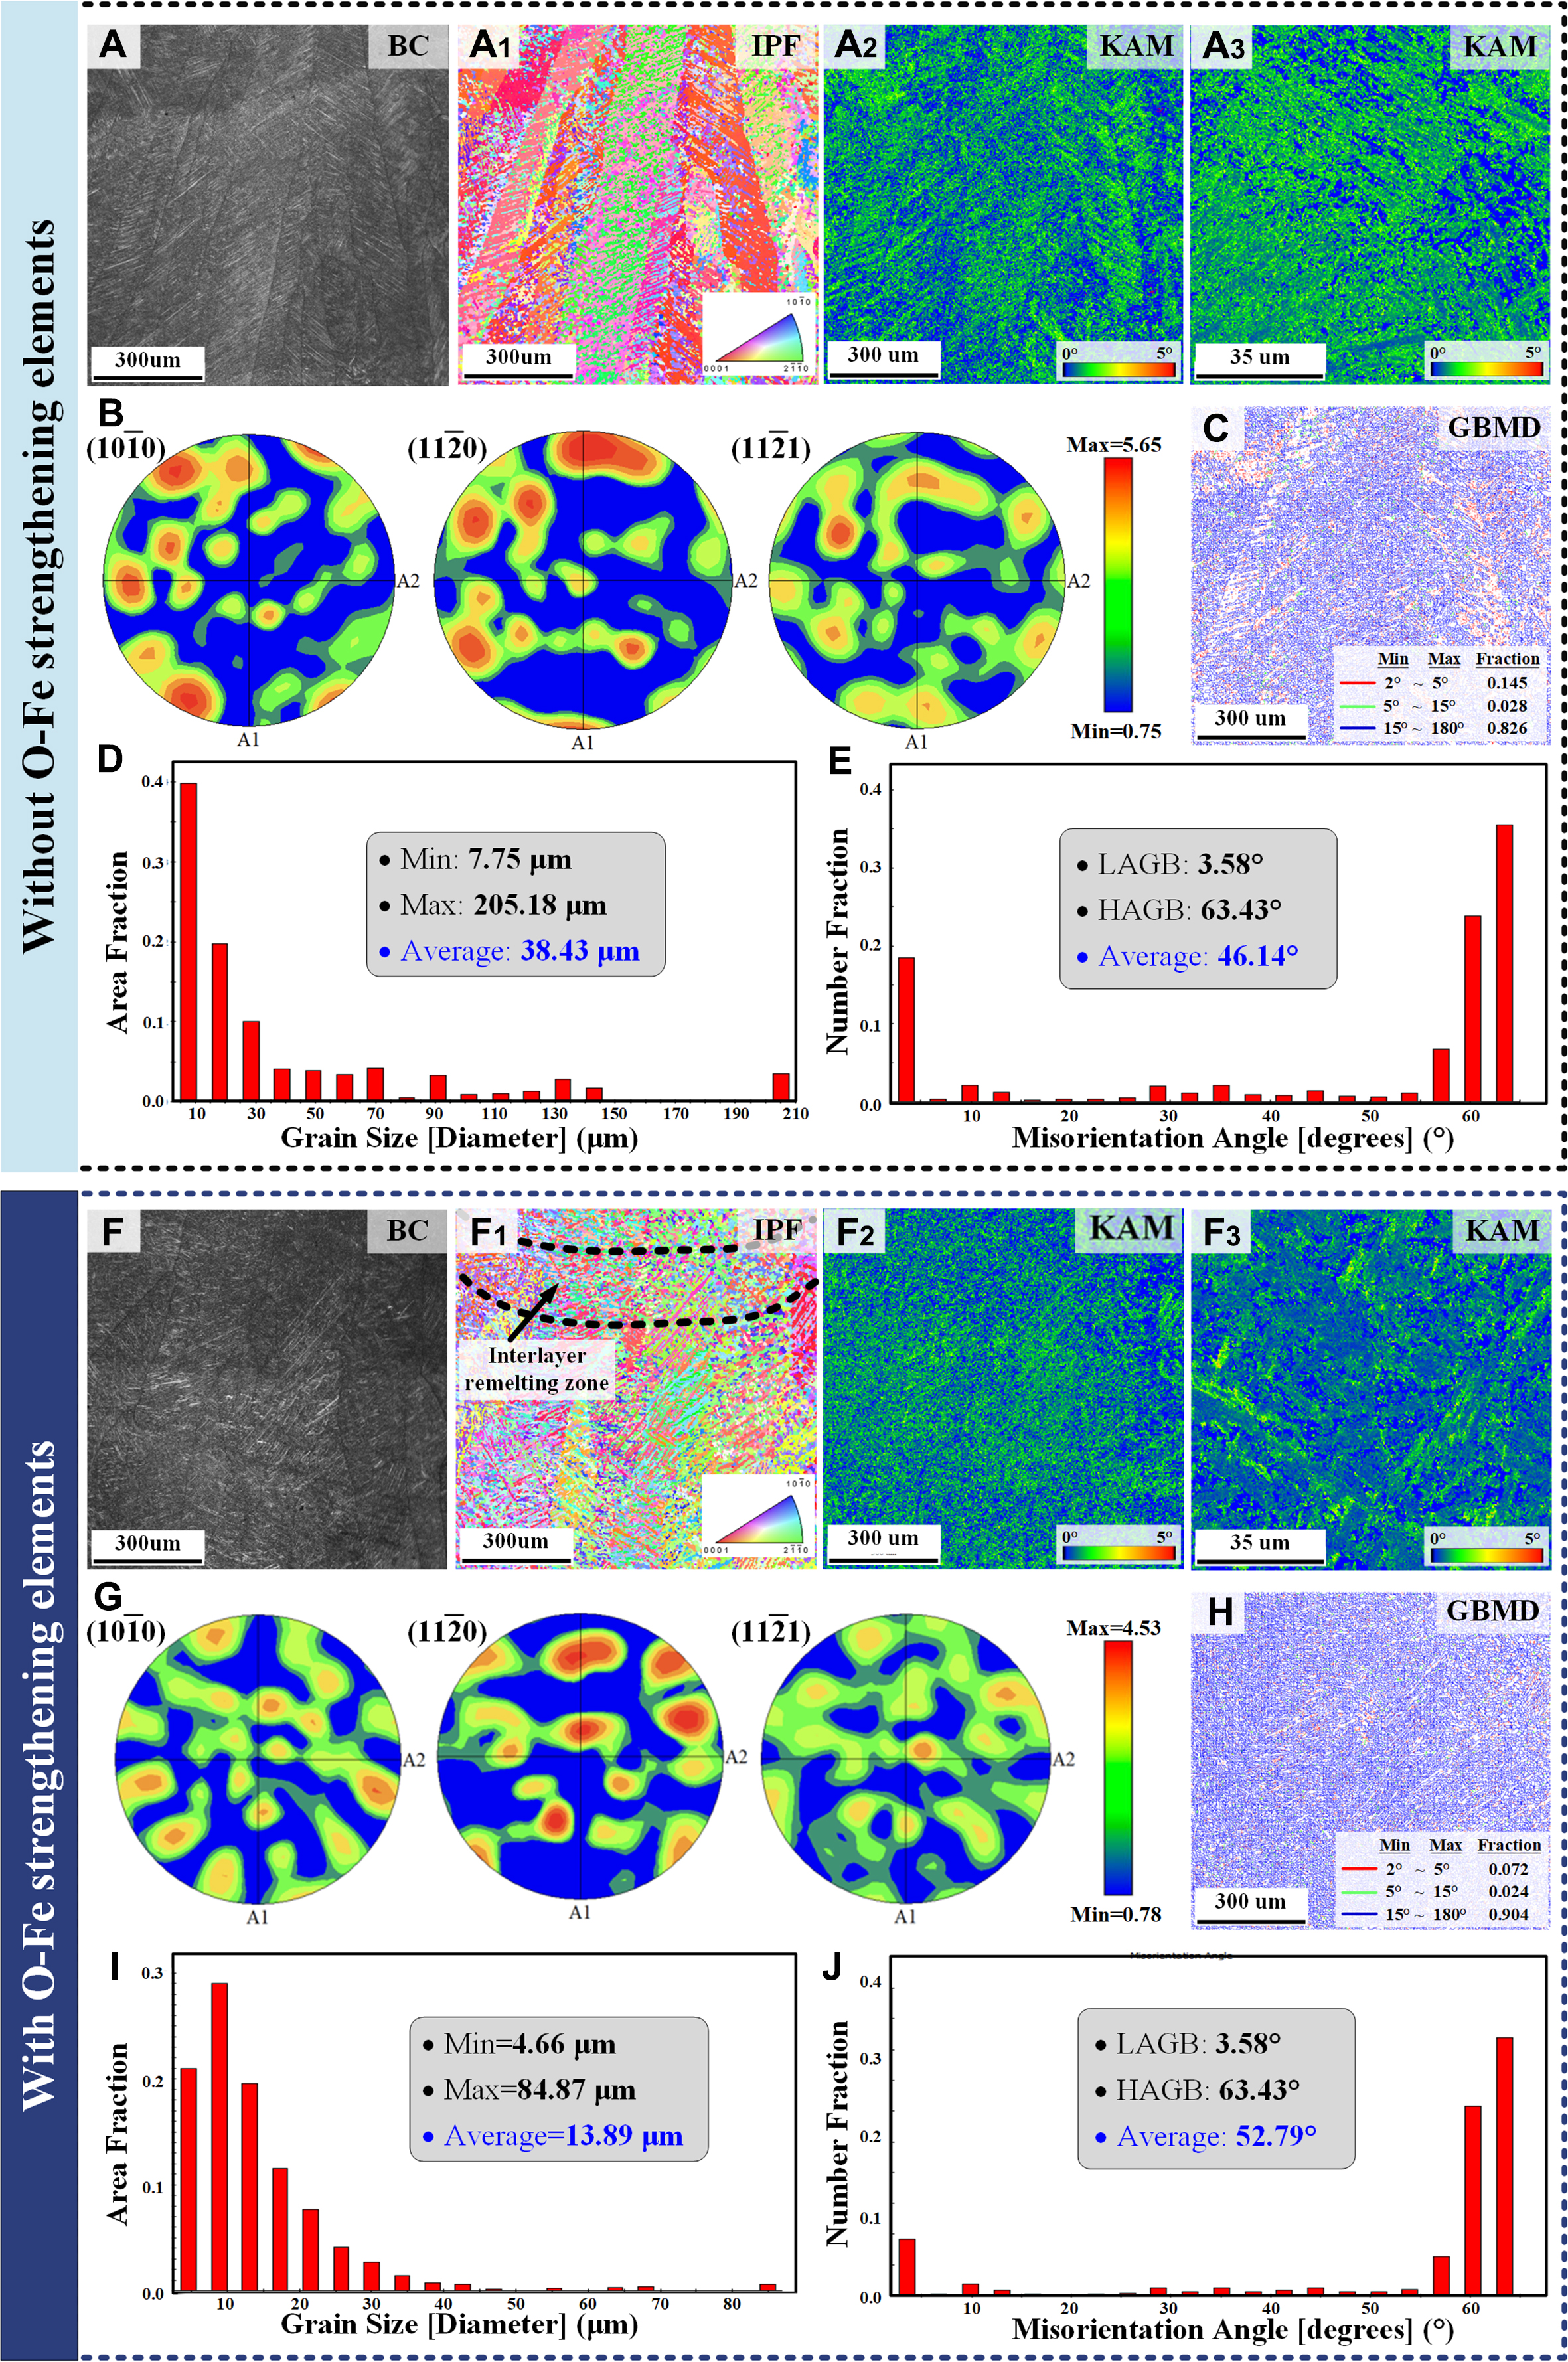
Figure 7. EBSD analysis of LM-WPSF Ti-6Al-4V (A–E) and Ti-6Al-4V-0.5O-2.3Fe (F–J) alloys: (A) Band contrast (BC) map of the unmodified alloy, (A1) Inverse pole figure (IPF) map, (A2 and A3) Kernel average misorientation (KAM) maps, (B) Pole figures of the α phase, (C) Grain boundary misorientation distribution (GBMD), (D) Grain size distribution, (E) Misorientation angle distribution; (F–J) Corresponding EBSD maps and analyses for the O-Fe microalloyed alloy: (F) BC map, (F1) IPF map, (F2 and F3) KAM maps, (G) Pole figures of the α phase, (H) GBMD, (I) Grain size distribution, (J) Misorientation angle distribution.


