


fig10
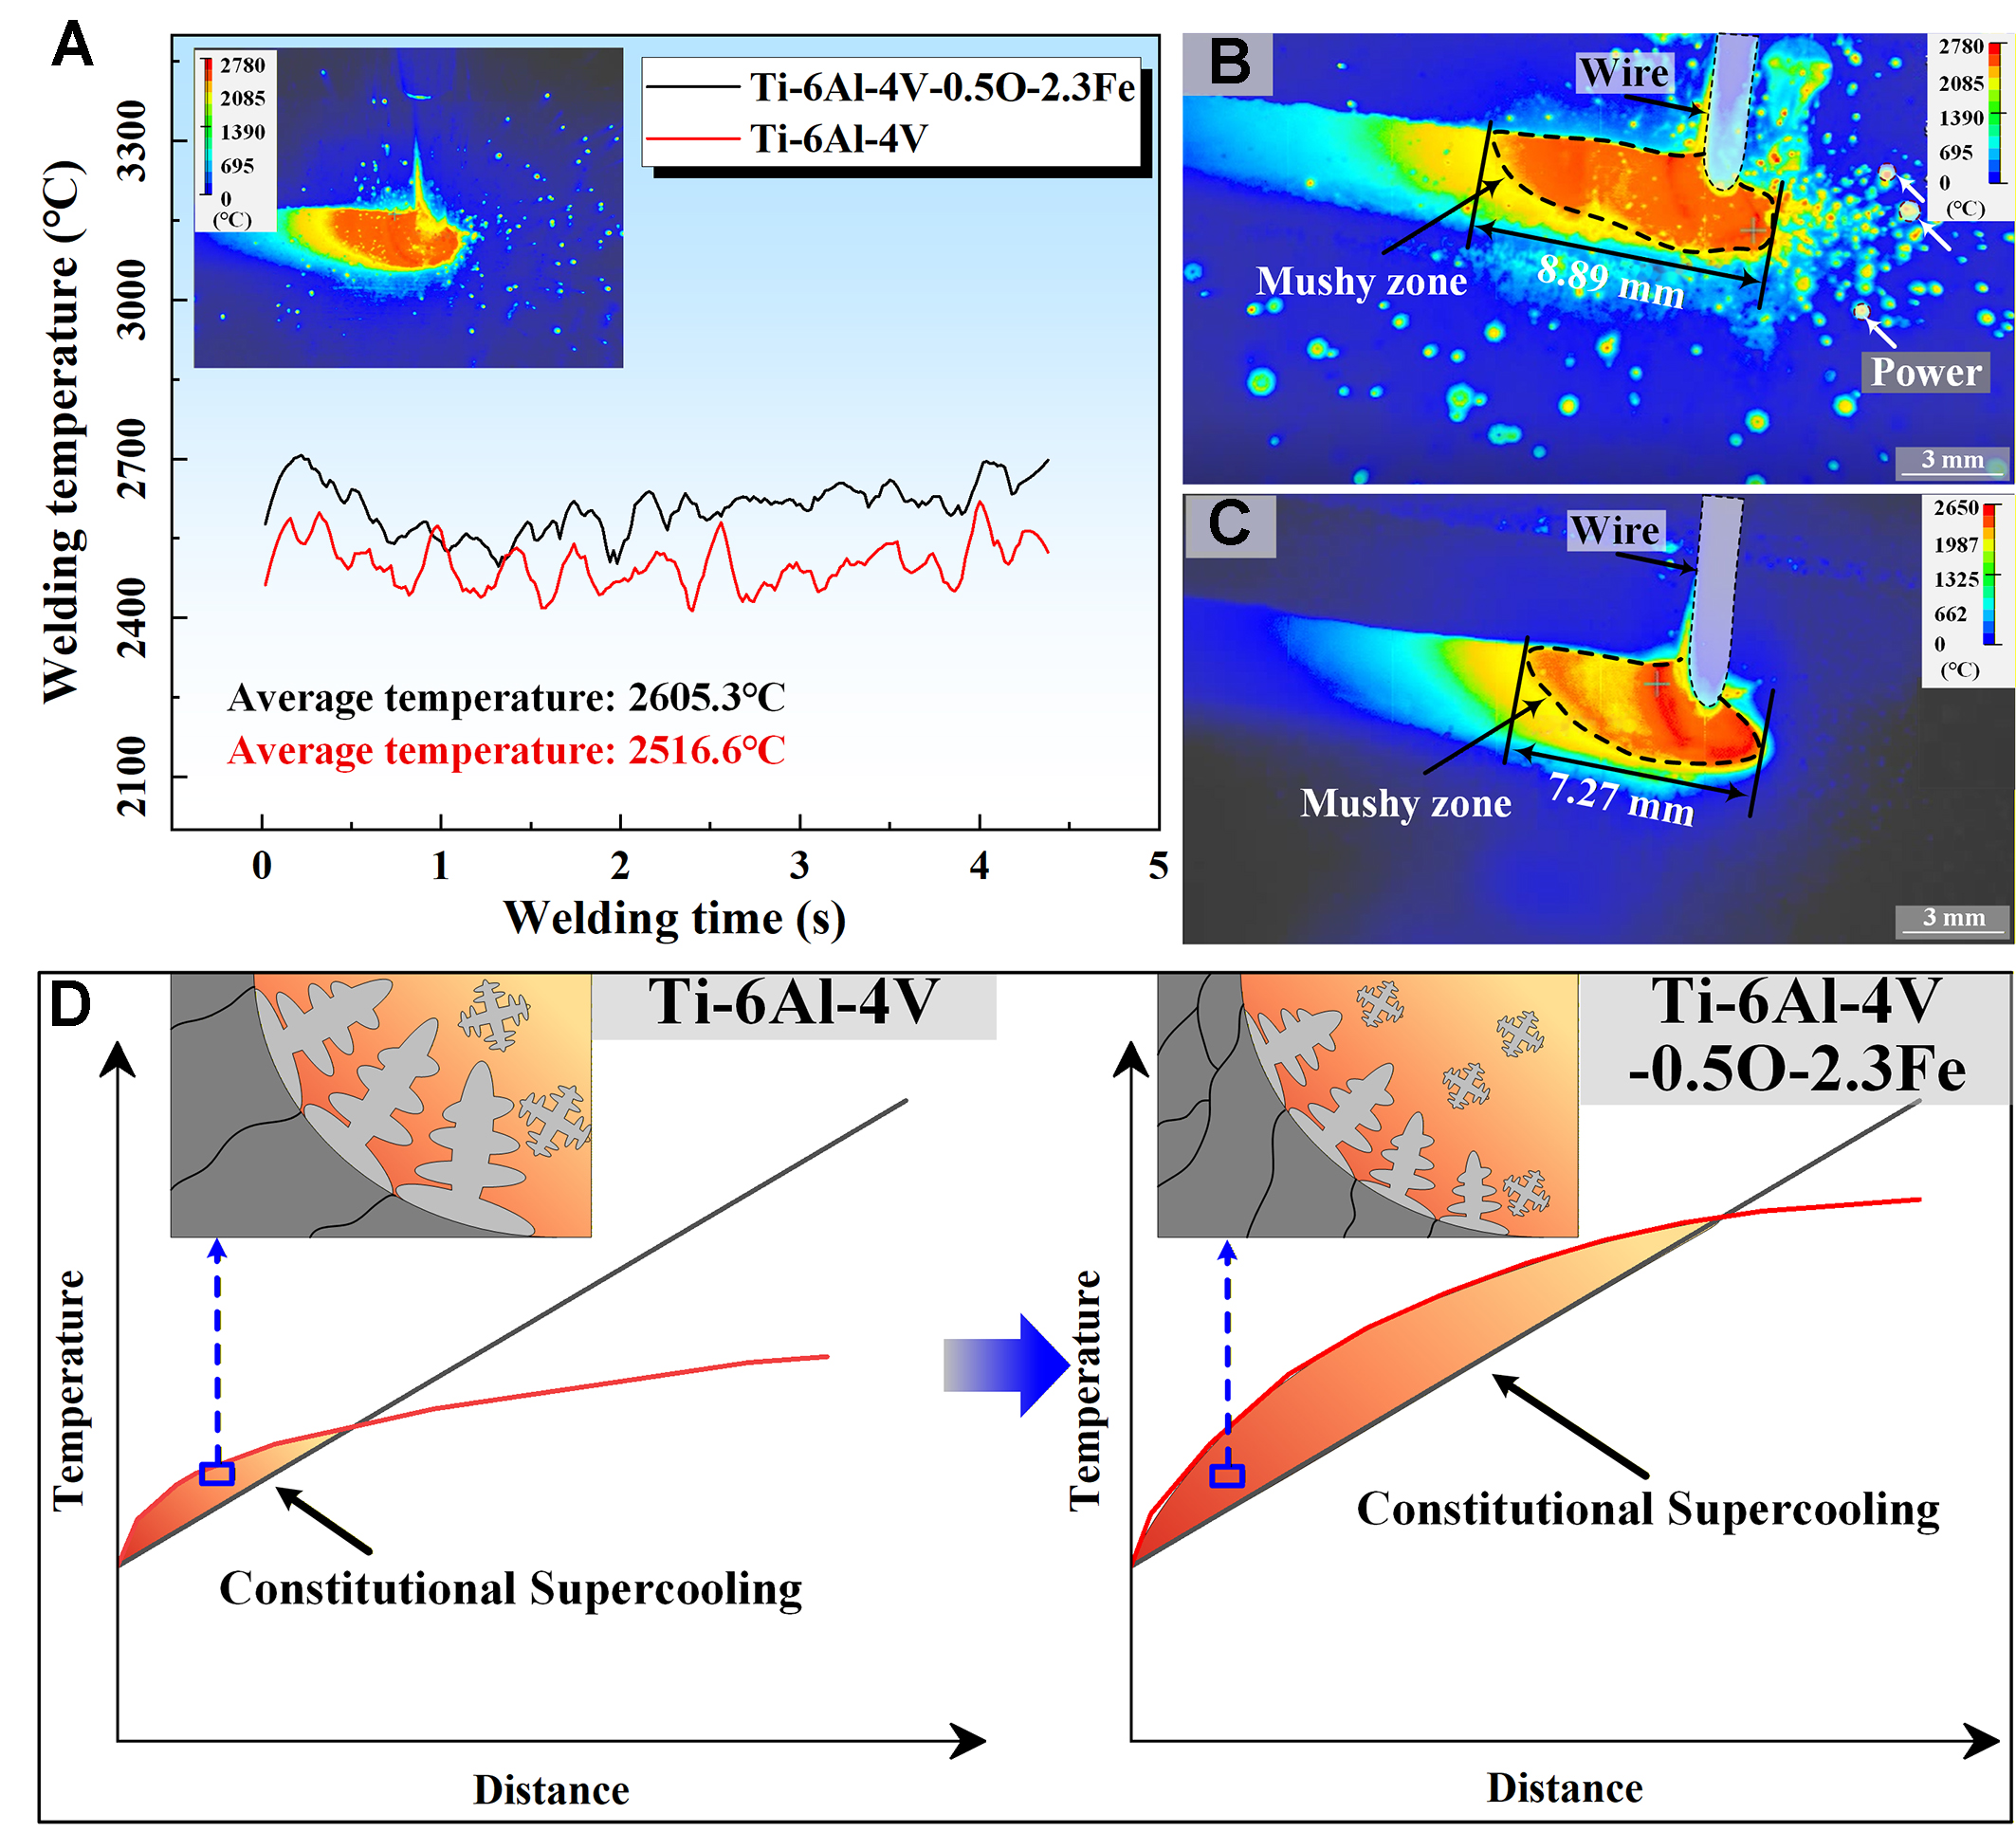
Figure 10. Infrared thermography of molten pool behavior and schematic illustration of solidification conditions during O-Fe microalloyed welding: (A) Comparison of molten-pool peak temperatures with and without O-Fe microalloying; (B and C) Infrared thermal images showing the molten pool and mushy zone length with and without O-Fe microalloying; (D) Grain nucleation mechanism at the solidification front of titanium alloys.


