


fig9
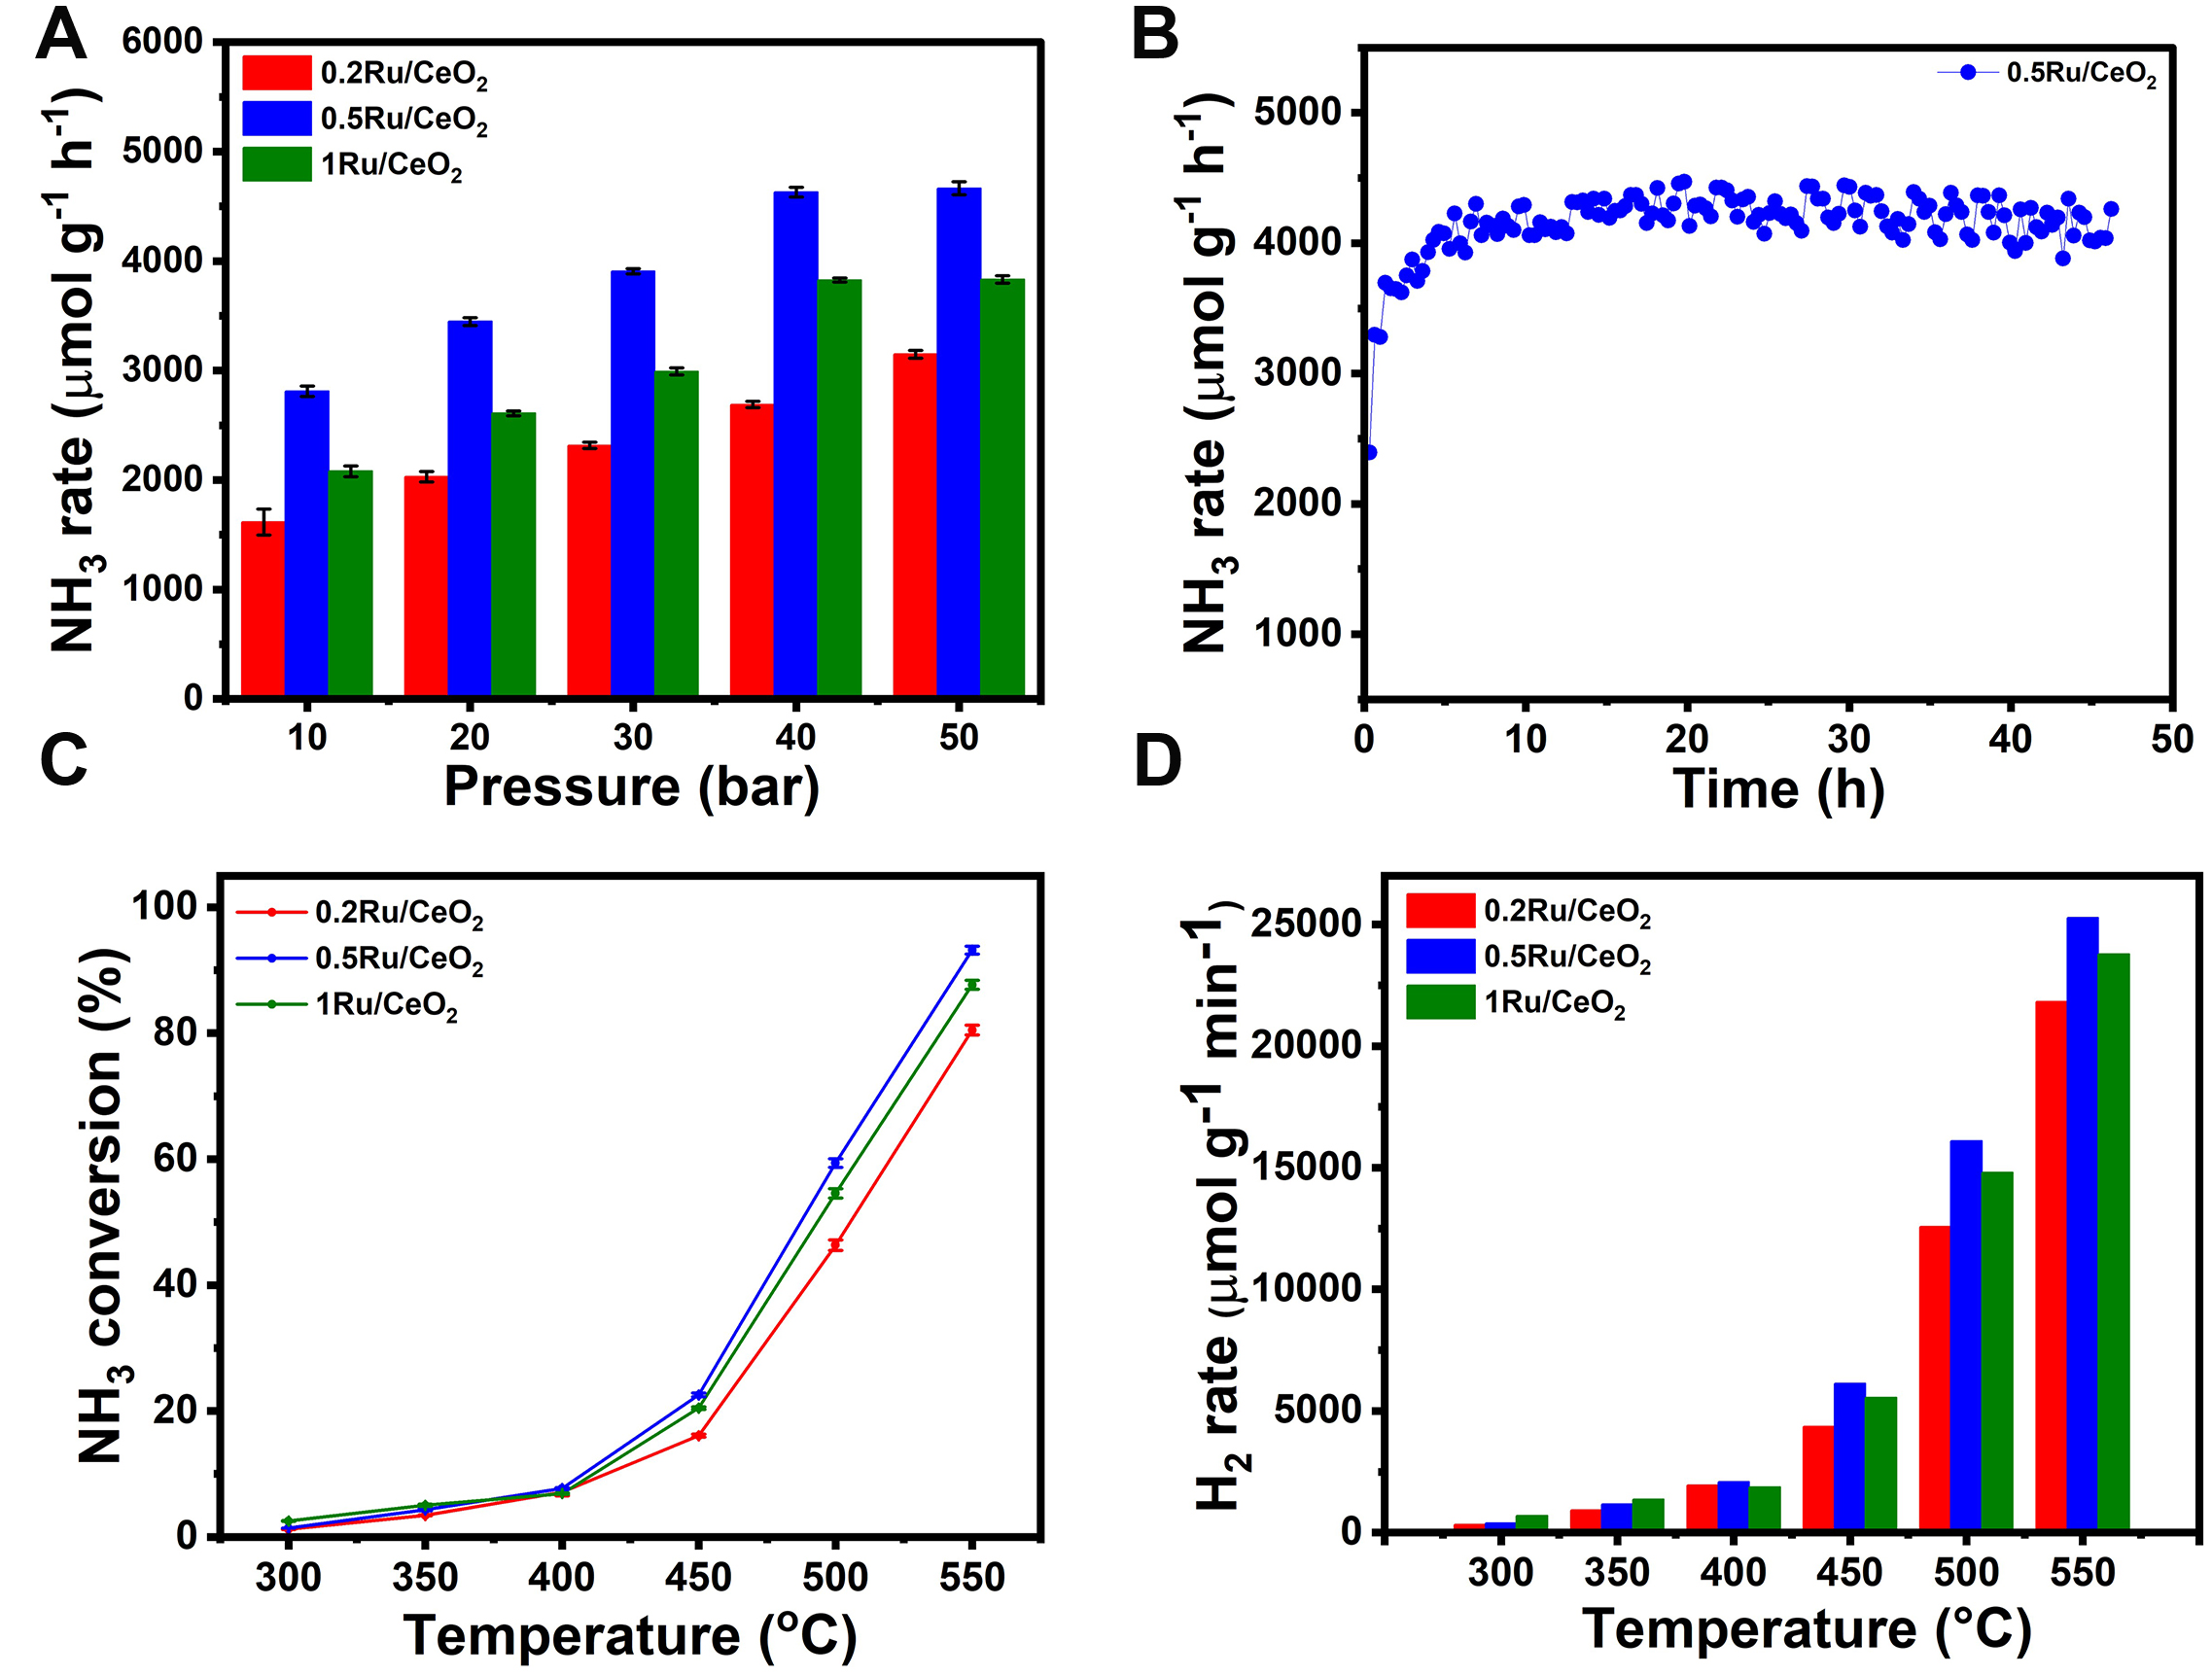
Figure 9. (A) The NH3 synthesis rate of nRu/CeO2 catalysts (n = 0.2, 0.5, and 1) at 400 °C, 10,000 mL g-1h-1 WHSV and different pressure ranges (10-50 bar), (B) Stability test of 0.5Ru/CeO2 catalyst at 50 bar, 400 °C, and 10,000 mL g-1h-1, (C) NH3 decomposition conversion graph with respect to temperature, at P = 1 atm, T = 350-550 °C, and (D) H2 production rate (mmol g-1 min-1) with respect to temperature, at P = 1 atm, T = 350-550 °C. (A and C) represent the standard error of the mean (SEM).


