


fig4
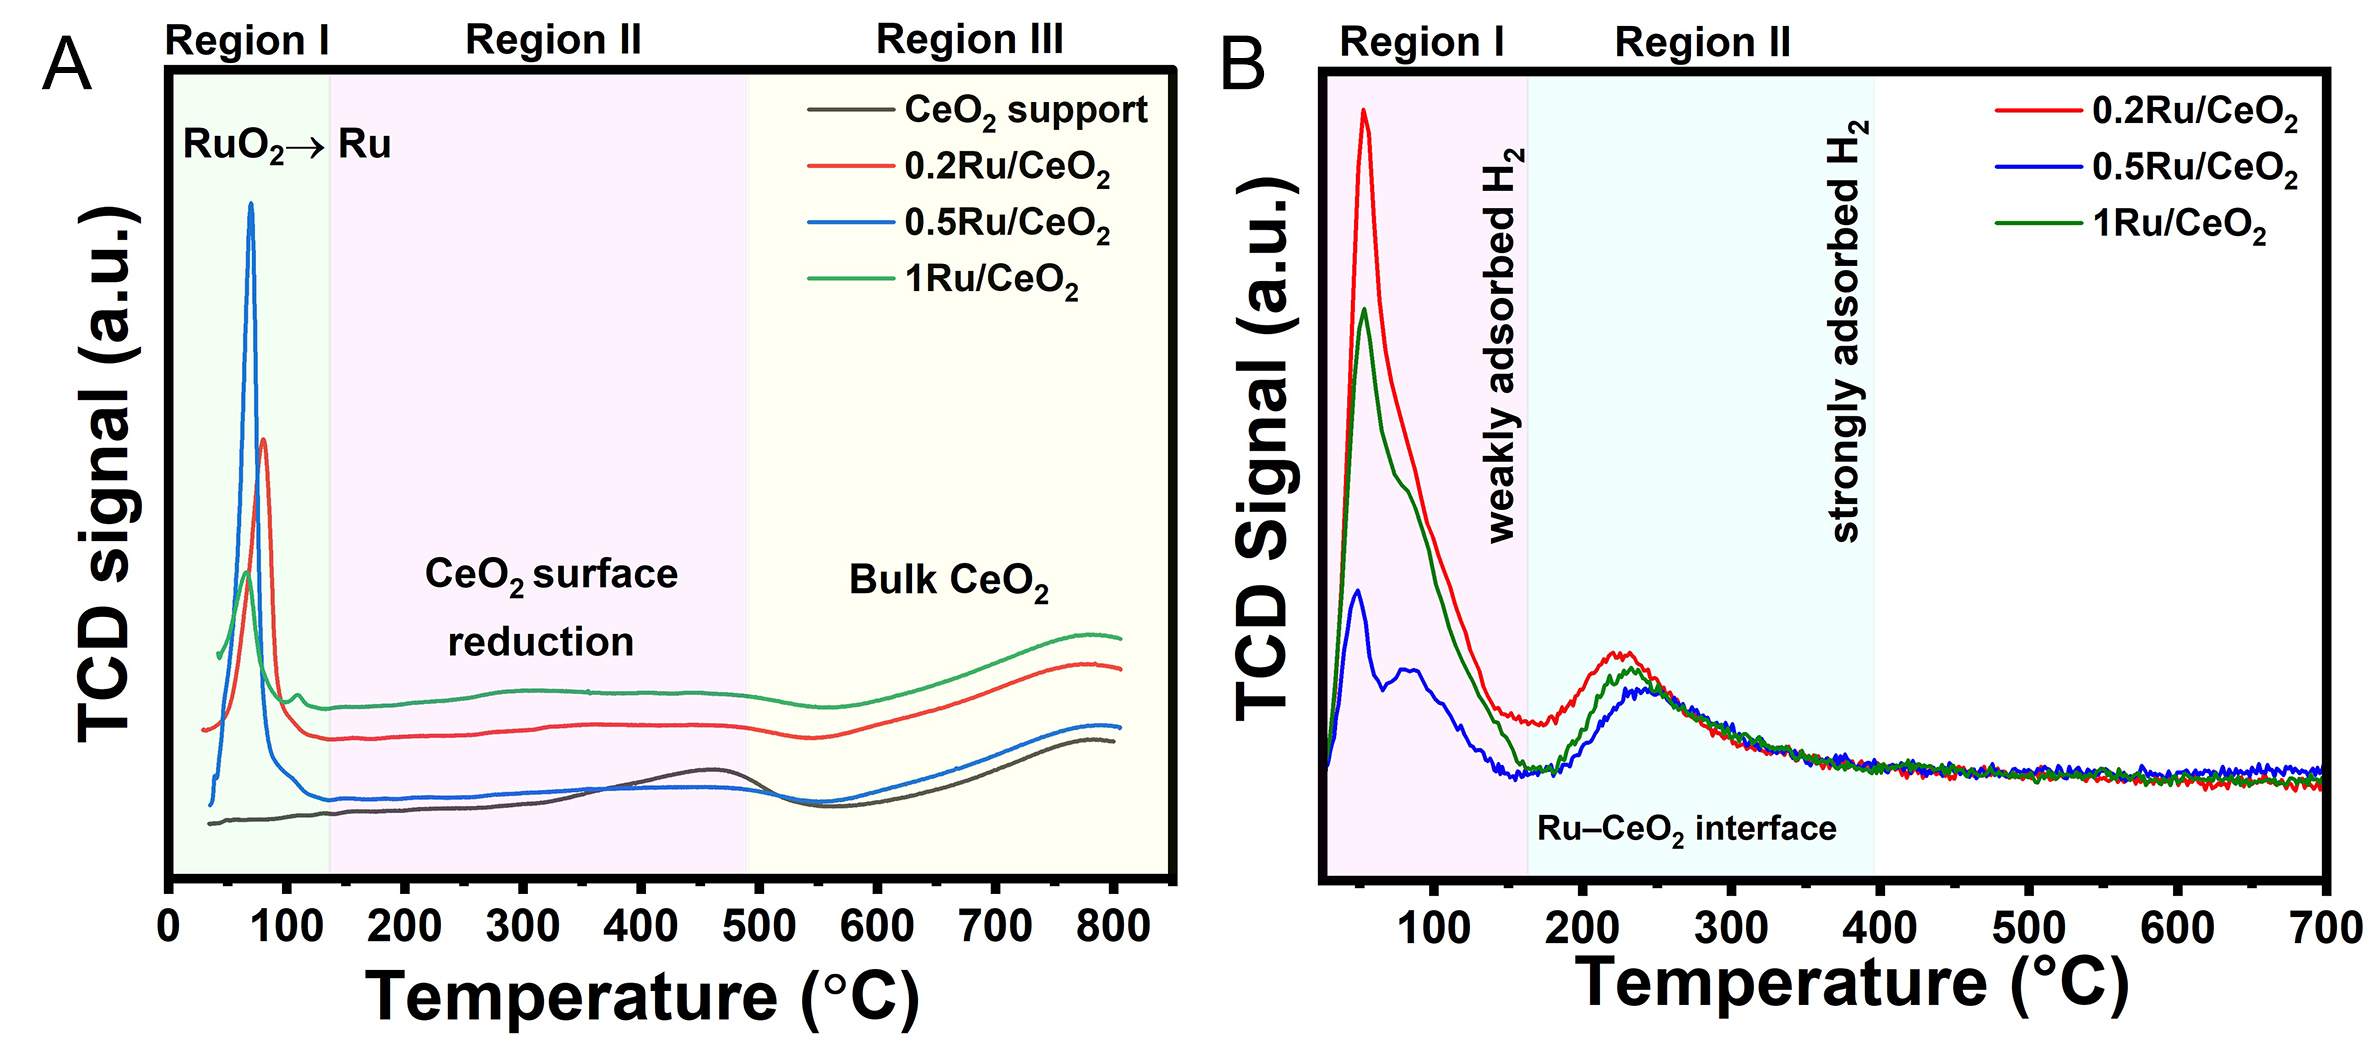
Figure 4. (A) H2-TPR profile of CeO2 support and nRu/CeO2 catalysts (n = 0.2, 0.5, and 1), (B) H2-TPD profile of nRu/CeO2 catalysts
Figure 4. (A) H2-TPR profile of CeO2 support and nRu/CeO2 catalysts (n = 0.2, 0.5, and 1), (B) H2-TPD profile of nRu/CeO2 catalysts


All published articles are preserved here permanently:
https://www.portico.org/publishers/oae/


