


fig12
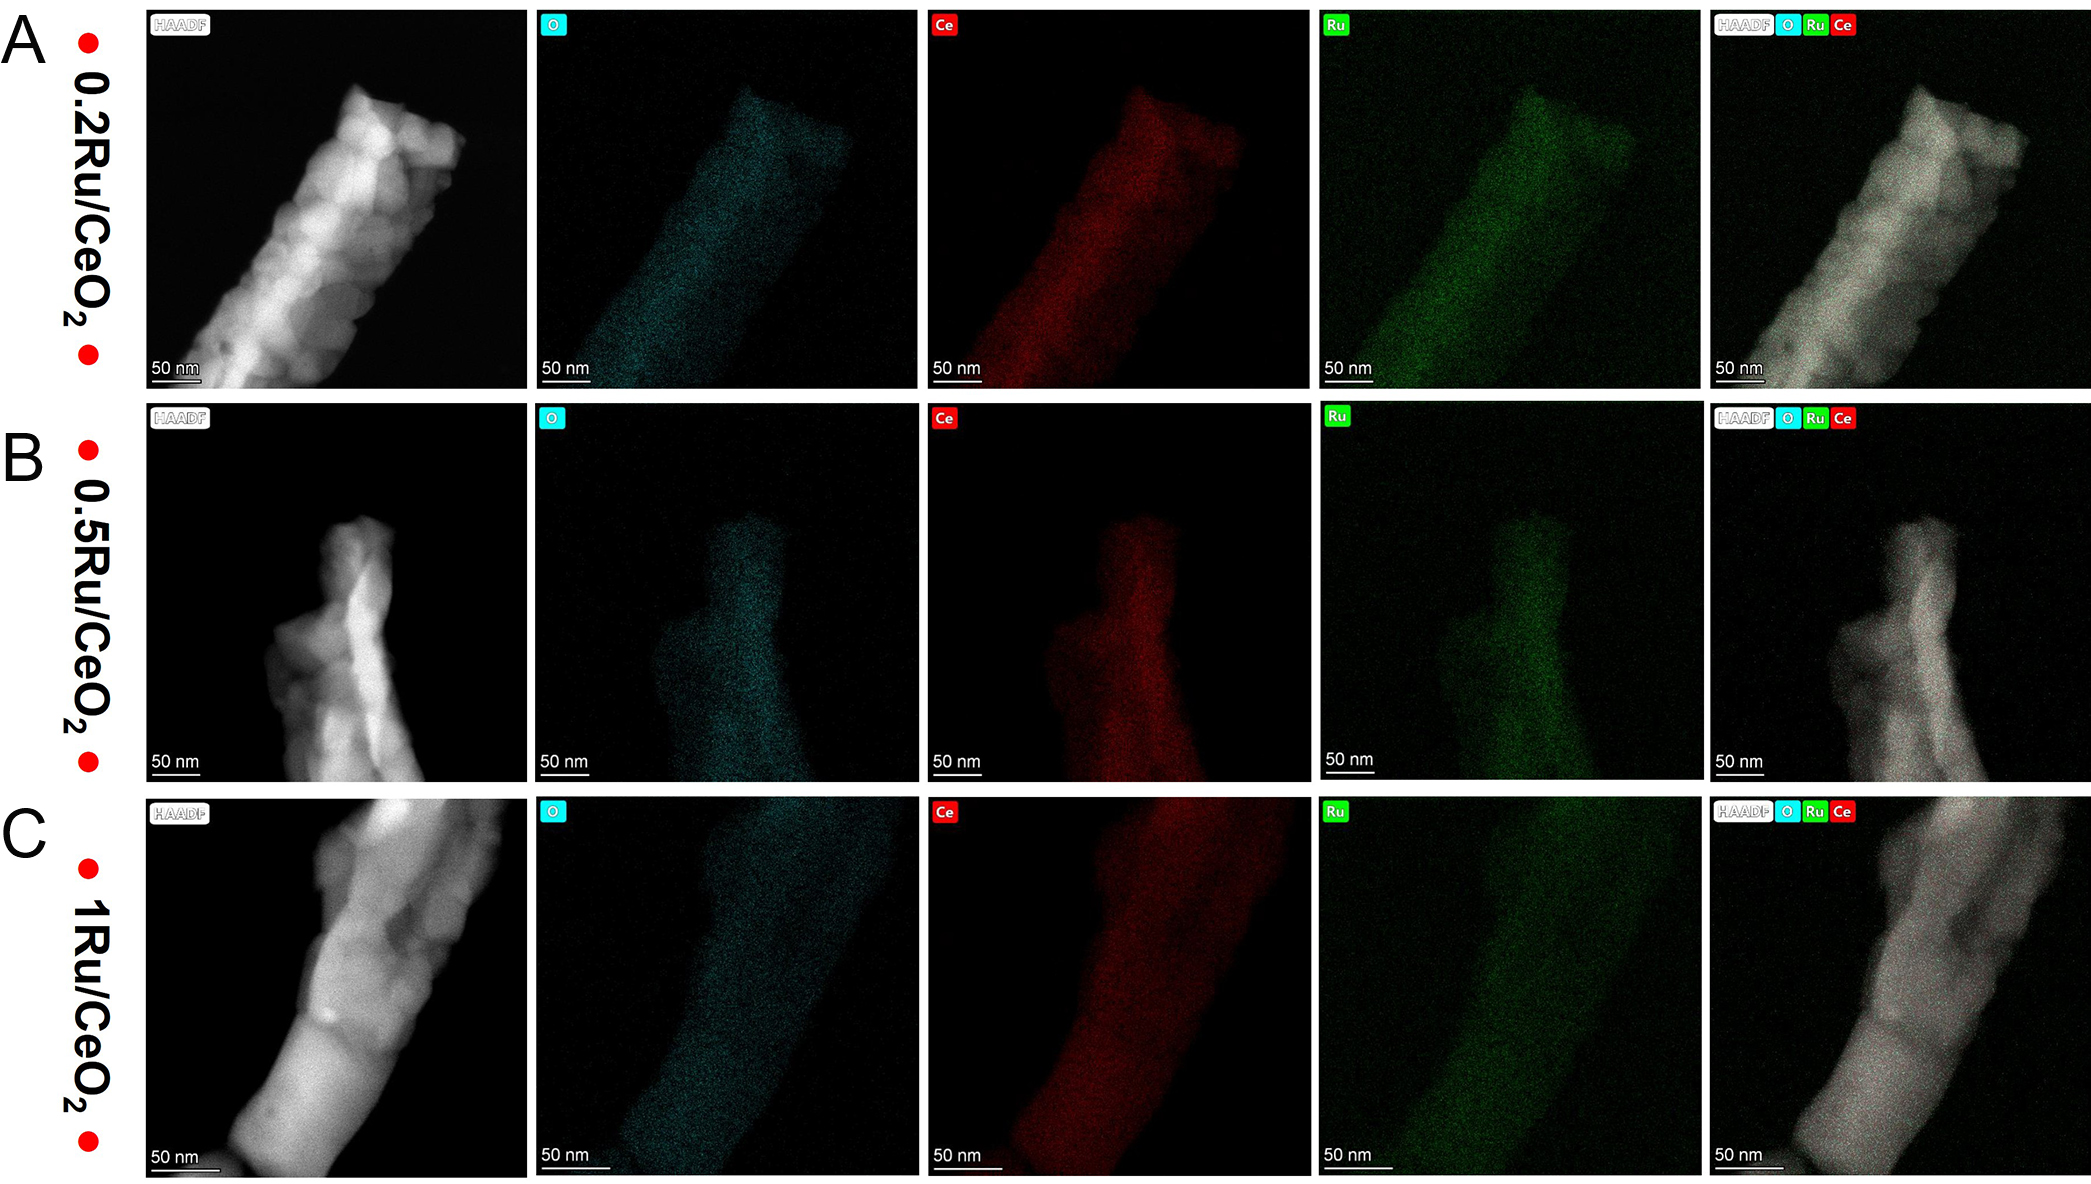
Figure 12. STEM-HAADF image and elemental mapping of the selected area of nRu/CeO2, (A) 0.2Ru, (B) 0.5Ru, and (C) 1Ru catalyst after catalytic activity test. Ru (Green), Ce (Red), O (Blue), Ce-O-Ru (RBG).
Figure 12. STEM-HAADF image and elemental mapping of the selected area of nRu/CeO2, (A) 0.2Ru, (B) 0.5Ru, and (C) 1Ru catalyst after catalytic activity test. Ru (Green), Ce (Red), O (Blue), Ce-O-Ru (RBG).


All published articles are preserved here permanently:
https://www.portico.org/publishers/oae/


