


fig8
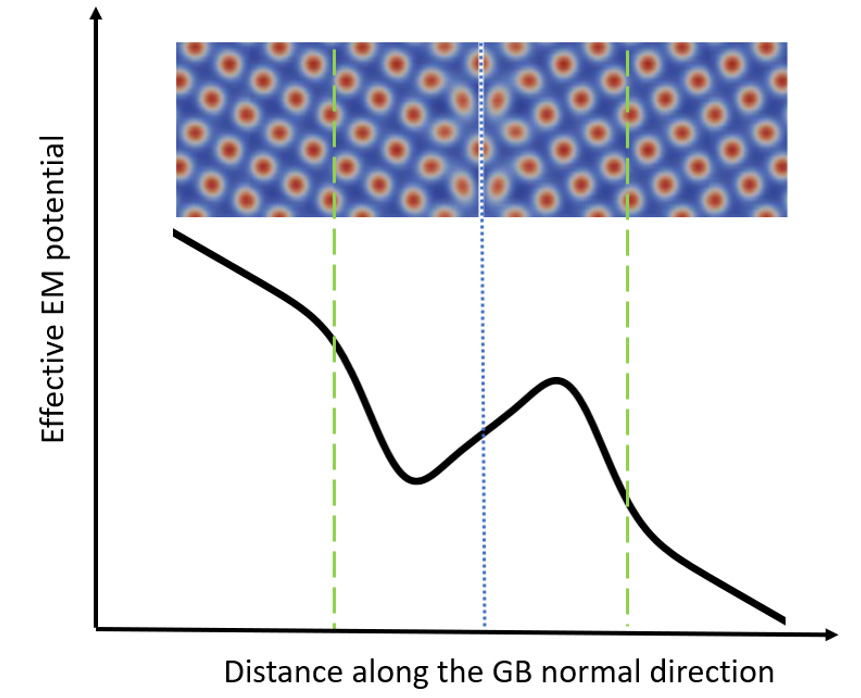
Figure 8. Illustration of the effective EM potential for the PFC model. The top inset picture is a PFC density field corresponding to the Σ5 GB and its vicinity, where atom positions are marked as red dots. The vertical dotted line marks the position of the GB, and the two dashed lines mark the boundaries of the near GB region, where the potential deviates significantly from its linear behavior in the bulk. The figure was prepared using Gnuplot. EM: Electromigration; GB: grain boundary; PFC: phase-field-crystal.


