


fig7
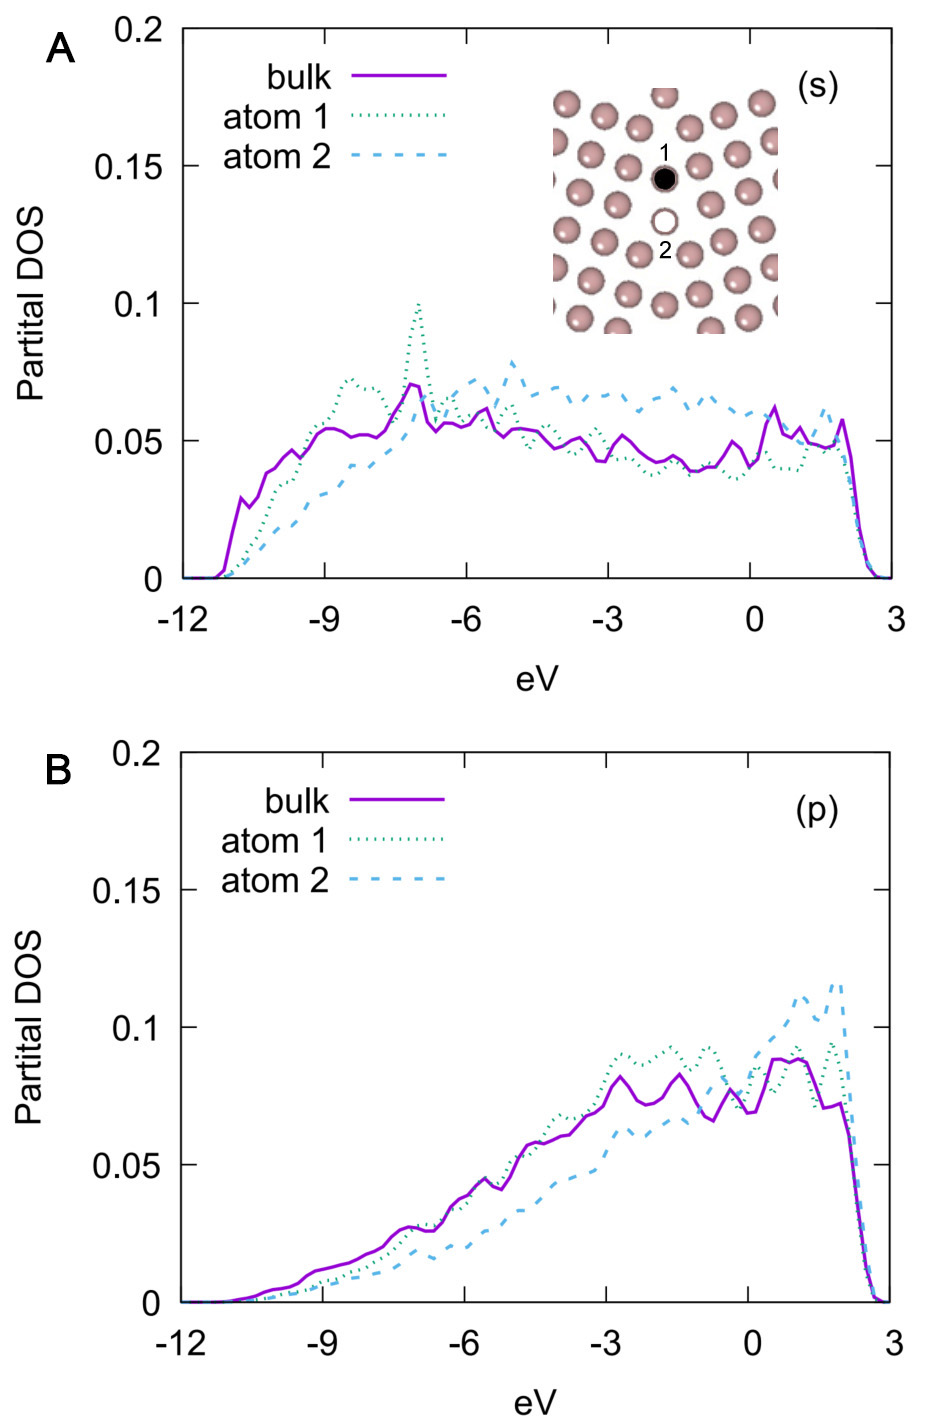
Figure 7. Comparison of the electron density of states between bulk and GB atoms. (A) For s electrons (shown on the top-right corner); (B) For p electrons (shown on the top-right corner). Positions of atom 1 and atom 2 on the GB are shown in the inset of (A) as black and white accordingly. The figure was prepared using Gnuplot. GB: Grain boundary.


