


fig6
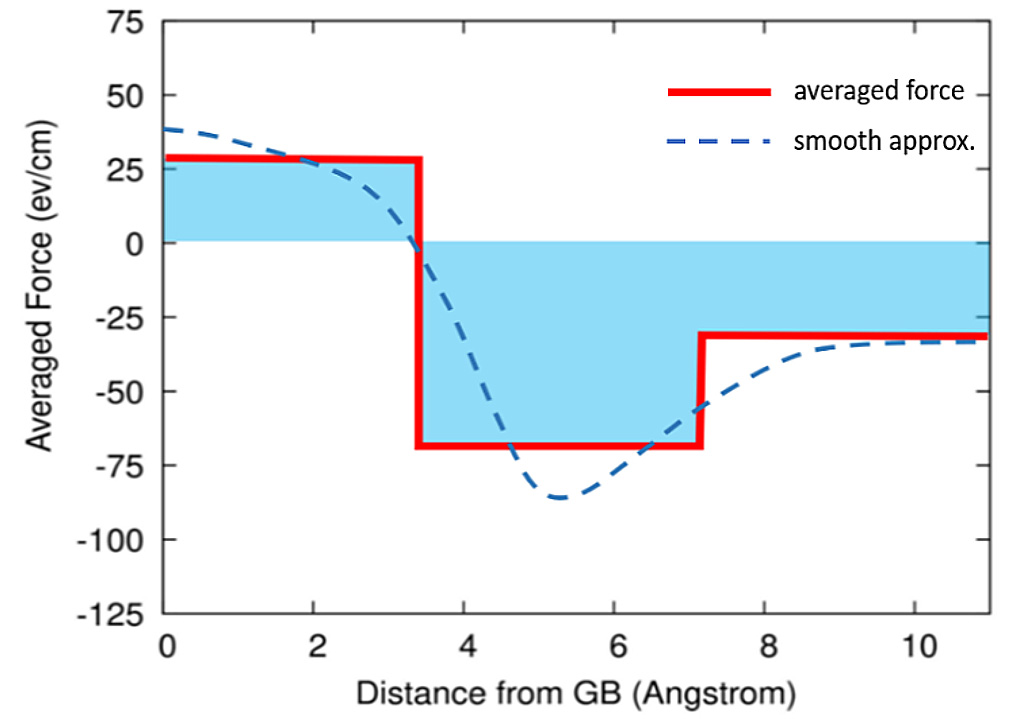
Figure 6. The regional-averaged force from Figure 5 as a function of the distance from the GB at E = 6.8 V/cm. The light blue blocks are the results from Figure 5 for the 3 regions. The red line shows the averaged force as a step function. The dashed blue curve is a smooth numerical approximation for the red step force. The figure was prepared using Gnuplot. GB: Grain boundary.


