


fig5
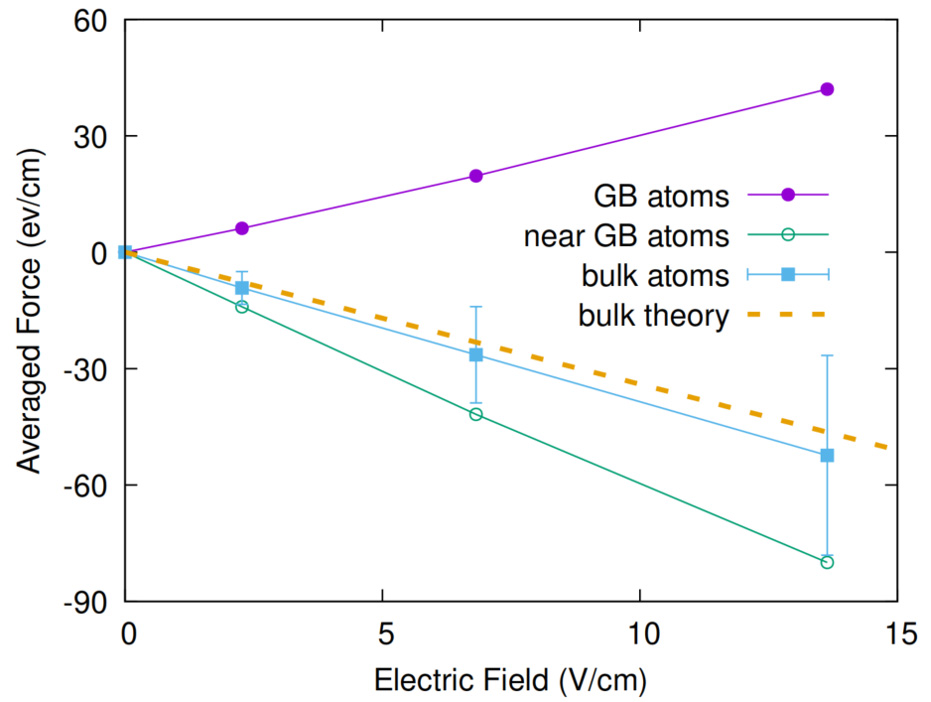
Figure 5. Regional-averaged force along the electric current direction under different electric fields. Data points are shown in dots and connected using solid lines. The dashed theory line is calculated using an effective EM charge Z* = -3.4 based on ref.[4]. The error bar for the averaged force on bulk atoms indicates the fluctuation range of the EM force in the bulk. No error on the average forces from the GB and near GB regions is considered since the average there are used to extract region behavior from the violently varying forces shown in Figure 4 in a qualitative way only. The figure was prepared using Gnuplot. EM: Electromigration; GB: grain boundary.


