


fig3
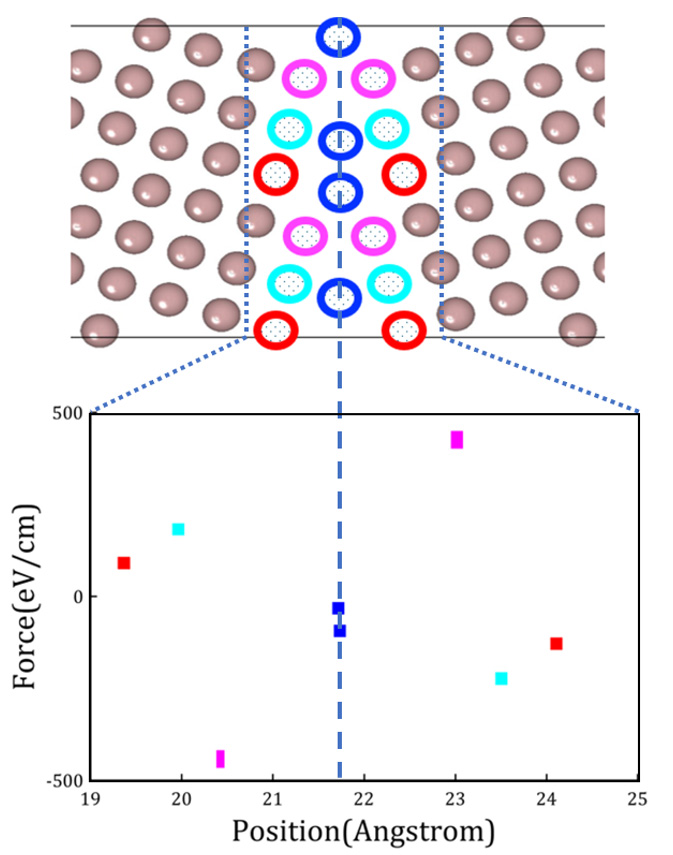
Figure 3. The EM force on GB atoms along the electron current direction are shown at the bottom panel under the applied electric field of 6.8 V/cm. The GB atom configuration is shown in the top panel. The center dash line marks the GB position in the two panels. The dotted lines in the top panel marks the region for the force plot shown in the bottom panel. The center dark blue data points in the bottom panel are the forces on the dark blue atoms shown in the GB region in the top panel. Data points are mostly overlapped since there are two identical structural units along the GB plane. The pink, cyan and red data points correspond to the same colored atoms at the top panel. The figure was prepared using Matlab. EM: Electromigration; GB: grain boundary.


