


fig12
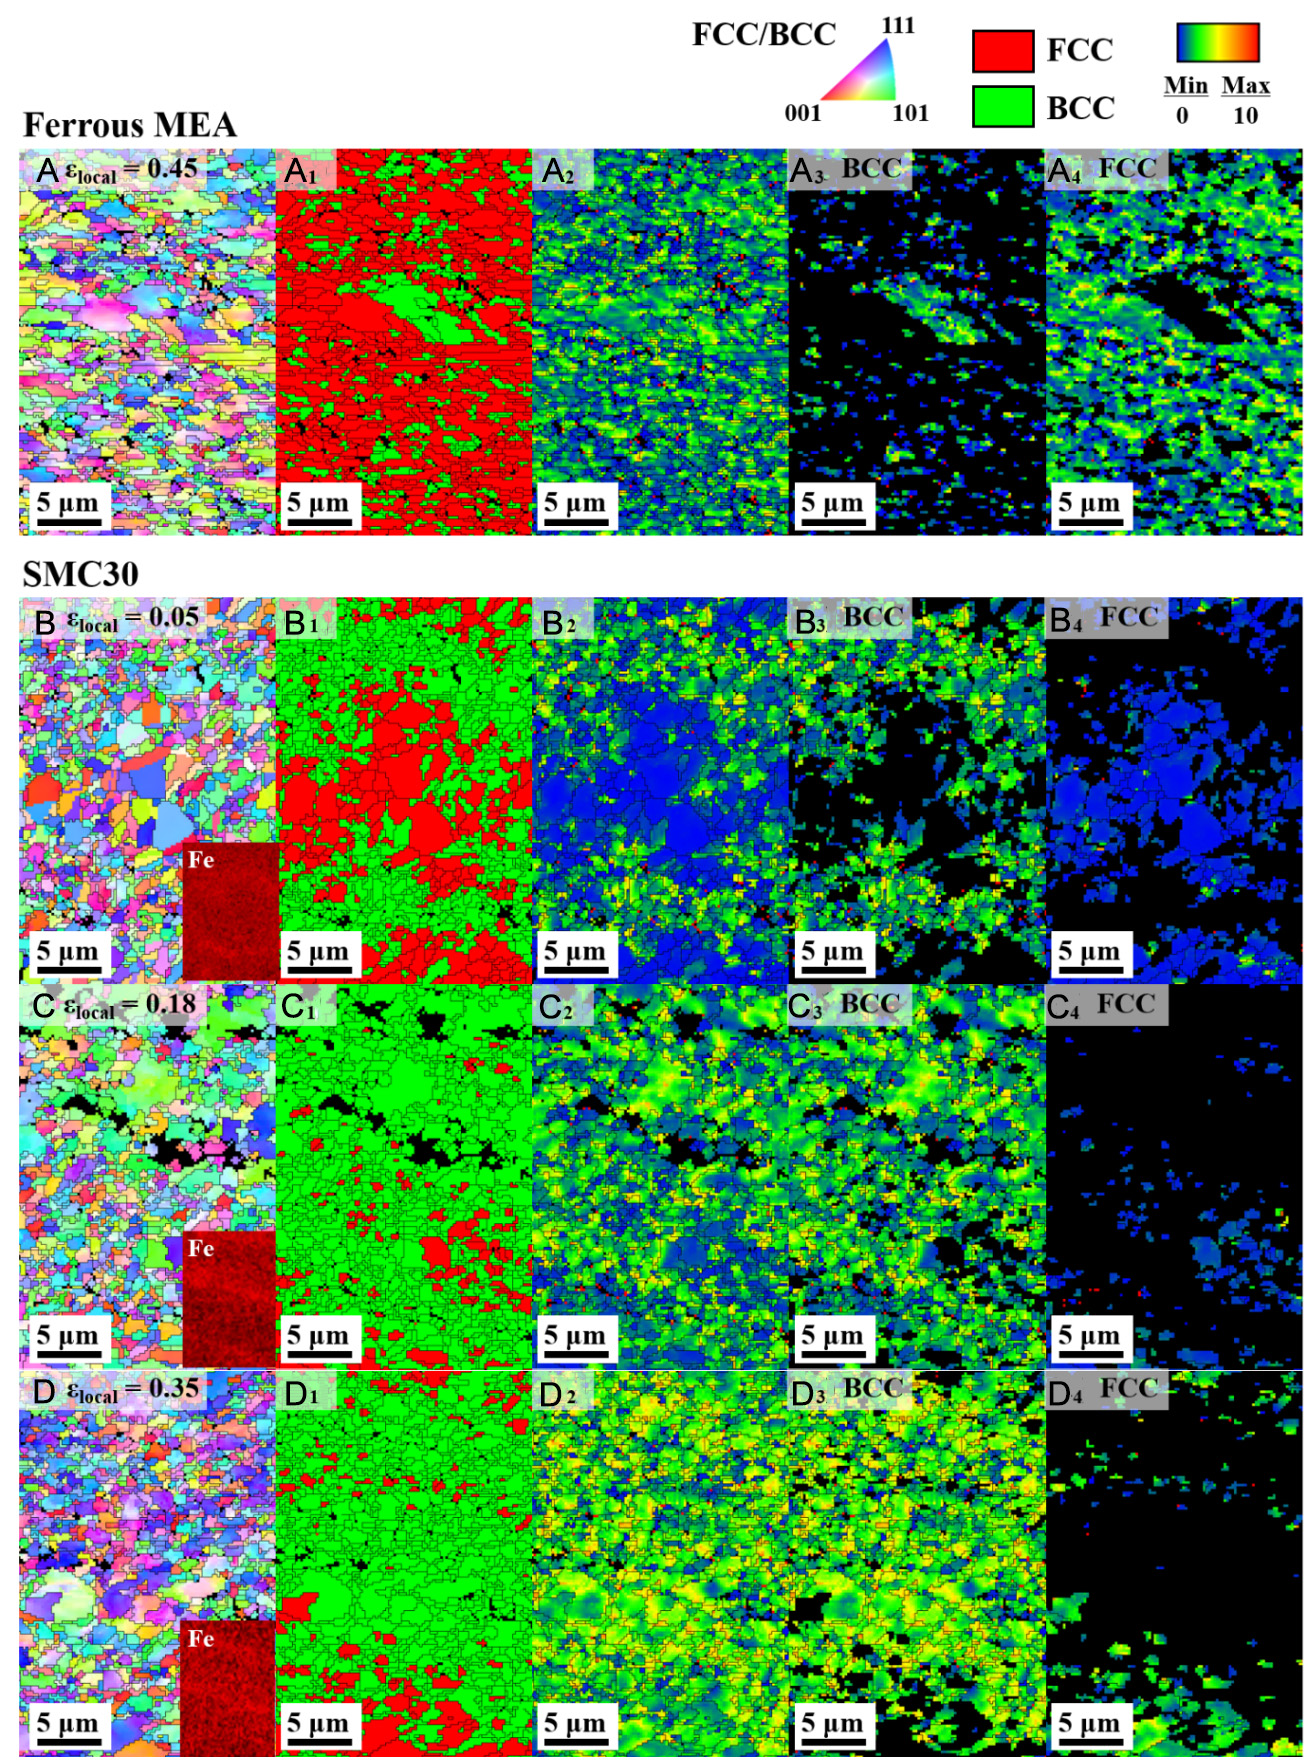
Figure 12. EBSD-IPF maps with (1) EBSD-phase, (2-4) EBSD-KAM maps of the (A) ferrous MEA and (B-D) SMC30 samples deformed at 298 K. The deformed microstructures of SMC30 at various local strains of (B) 0.05, (C) 0.18, and (D) 0.35 were identified using DIC strain mapping. Fe elemental distribution maps of SMC30 samples are shown as insets in (B-D). (2) The overall KAM maps are further separated into (3) BCC-KAM and (4) FCC-KAM maps. The KAM maps are measured up to the third nearest neighbor with a maximum misorientation of 10°. EBSD: Electron backscatter diffraction; MEA: medium-entropy alloy; FCC:face-centered cubic; SMC: spatial metastability control; DIC:digital image correlation; IPF: inverse pole figure; BCC: body-centered cubic; KAM: kernel average misorientation.


