


Integrating 3D CNN and phase-field simulation for TiAlN coating property prediction via 3D microstructure
 0
0 Abstract
Microstructure evolution in service significantly influences the properties of advanced materials. Numerical simulation can effectively capture microstructure development and provide abundant high-fidelity data. However, effective 3D microstructure-informed property prediction methods are lacking due to the complexity and richness of 3D microstructural data. In this work, a novel approach combining phase-field simulation and a 3D convolutional neural network is proposed to explore the composition-process-structure-property relationship in Ti1-xAlxN coatings. A large dataset of 4,962 simulated 3D microstructures under various heat treatment conditions was first generated using phase-field simulations. Then, a reconstructible feature extraction model was trained to compress each 48 × 48 × 48-grid microstructure into a 128-dimensional latent vector with a reconstruction accuracy of up to 99%. Using the extracted features, a microstructure-based hardness prediction model was constructed, achieving a low prediction error of 1.6 GPa (ca. 5.3% error for an average hardness of 30.8 GPa). The results demonstrate the effectiveness of 3D microstructure-informed deep learning for accurate property prediction, providing a promising tool for the data-driven design of high-performance materials.
Keywords
INTRODUCTION
Constructing the composition-process-structure-property relationship is pivotal to enhancing material properties, optimizing process parameters, and developing novel materials[1]. In recent years, data-driven machine learning (ML) has achieved outstanding results in the design of various materials, including aluminum alloys[2,3], copper alloys[4], high entropy alloys[5,6], coatings[7], and others[8,9]. Among the many research areas advanced by ML methods, an important finding is that when constructing relationships, incorporating the structural information of materials leads to more accurate and interpretable material-performance prediction models. It has been found that prediction accuracy is significantly improved compared with models using only composition as input. Similar findings are also proved by other research, which stresses the need to consider the microstructure information for modeling and inferring the material properties[10], e.g., aluminum alloys, superalloys, etc.
The microstructure of a material is usually presented as unstructured data (e.g., images, patterns, and fields), obtained either from experimental measurements using transmission electron microscopy, electron probe, scanning electron microscopy, etc.[11-13], or from numerical simulations using phase-field simulation[14], cellular automata[15,16], crystal plasticity finite element methods[17-19], etc. However, the effort to directly adopt naive microstructure as input to ML models, e.g., fully connected artificial neural networks (ANNs), is considered impractical because the required network could be extremely complex, especially in cases involving 3-dimensional (3D) microstructure information. As a remedy, naive material microstructure data usually relies on empirical analysis and information extraction, leading to complex representations, e.g., phase fractions, size distributions of phases, etc. Moreover, a key challenge lies in microstructure information that is inhomogeneously distributed and thus difficult to abstract and rationally quantify, for example, composition segregation caused by alloy solidification conditions. Therefore, approaches for precise representation of microstructure information, capturing both characteristic features and subtle distributions, are urgently needed.
Recently, many research efforts have been devoted to the quantitative characterization of microstructure evolution in various materials, including coatings, solid oxide cell materials, functional materials, and alloys[20-22]. In particular, experimental microstructure information is expensive, scarce, and potentially biased. The phase-field method has emerged as a powerful heuristic tool, widely used to study the microstructure evolution of generic phase-transition processes, such as alloy solidification, recrystallization, and solid-state phase transitions[23-25]. Vivid microstructure information is therefore available, especially with support from high-performance computing and advanced algorithms. With a quantitative phase-field simulation framework, the acquisition of high-fidelity simulations is facilitated. This is helpful for providing necessary microstructure information to optimize material preparation parameters (e.g., for coatings) and to understand the mechanisms of material degradation in depth. In addition, phase-field simulations, after validation with a small amount of 2D experimental data, can yield large and reliable 3D microstructure information to capture more complex interactions among different phases[22,26]. Therefore, a remaining issue to be resolved is how to further leverage such 2D/3D material microstructure information for materials innovation.
However, intuitive simulation results in vivid 2D/3D forms are generally indirect for establishing quantitative relationships for materials innovation, which calls for a generic abstraction approach to extract essential microstructure features and thus enable subsequent quantitative relation construction. Deep learning techniques in materials science and engineering have also been widely applied for material image segmentation[27], classification[28], microstructure reconstruction[29], microstructure generation[30], and alloy design. Among them, convolutional neural networks (CNNs) have the advantage of automatically extracting image features and capturing their spatial distribution[31]. Zhu et al. have applied an improved fully convolutional network to extract the microstructure feature parameters of eutectic Si from images, which were then used to predict the strength of Al-Si alloys based on composition and structure[32]. Similarly, Kondo et al. directly used a CNN model to establish a quantitative relation between microstructure and ionic conductivity of porous ZrO2-Y2O3 solid electrolytes[33]. Although CNN-based image feature extraction techniques have shown good results in 2D image data analysis, accurate and efficient analysis of large 3D material microstructures remains challenging. Data compression or slicing is often required when processing 3D microstructure information, which inevitably disrupts spatial relationships and leads to information loss. In practice, however, 3D material microstructure is closely related to properties. It is therefore particularly important to develop a deep learning model suitable for 3D microstructure feature extraction and structure-property relation construction. Compared with 2D CNNs, 3D CNN models can consider information from multiple consecutive sections simultaneously, capturing complete features and interrelationships in 3D space, which enables more accurate feature extraction.
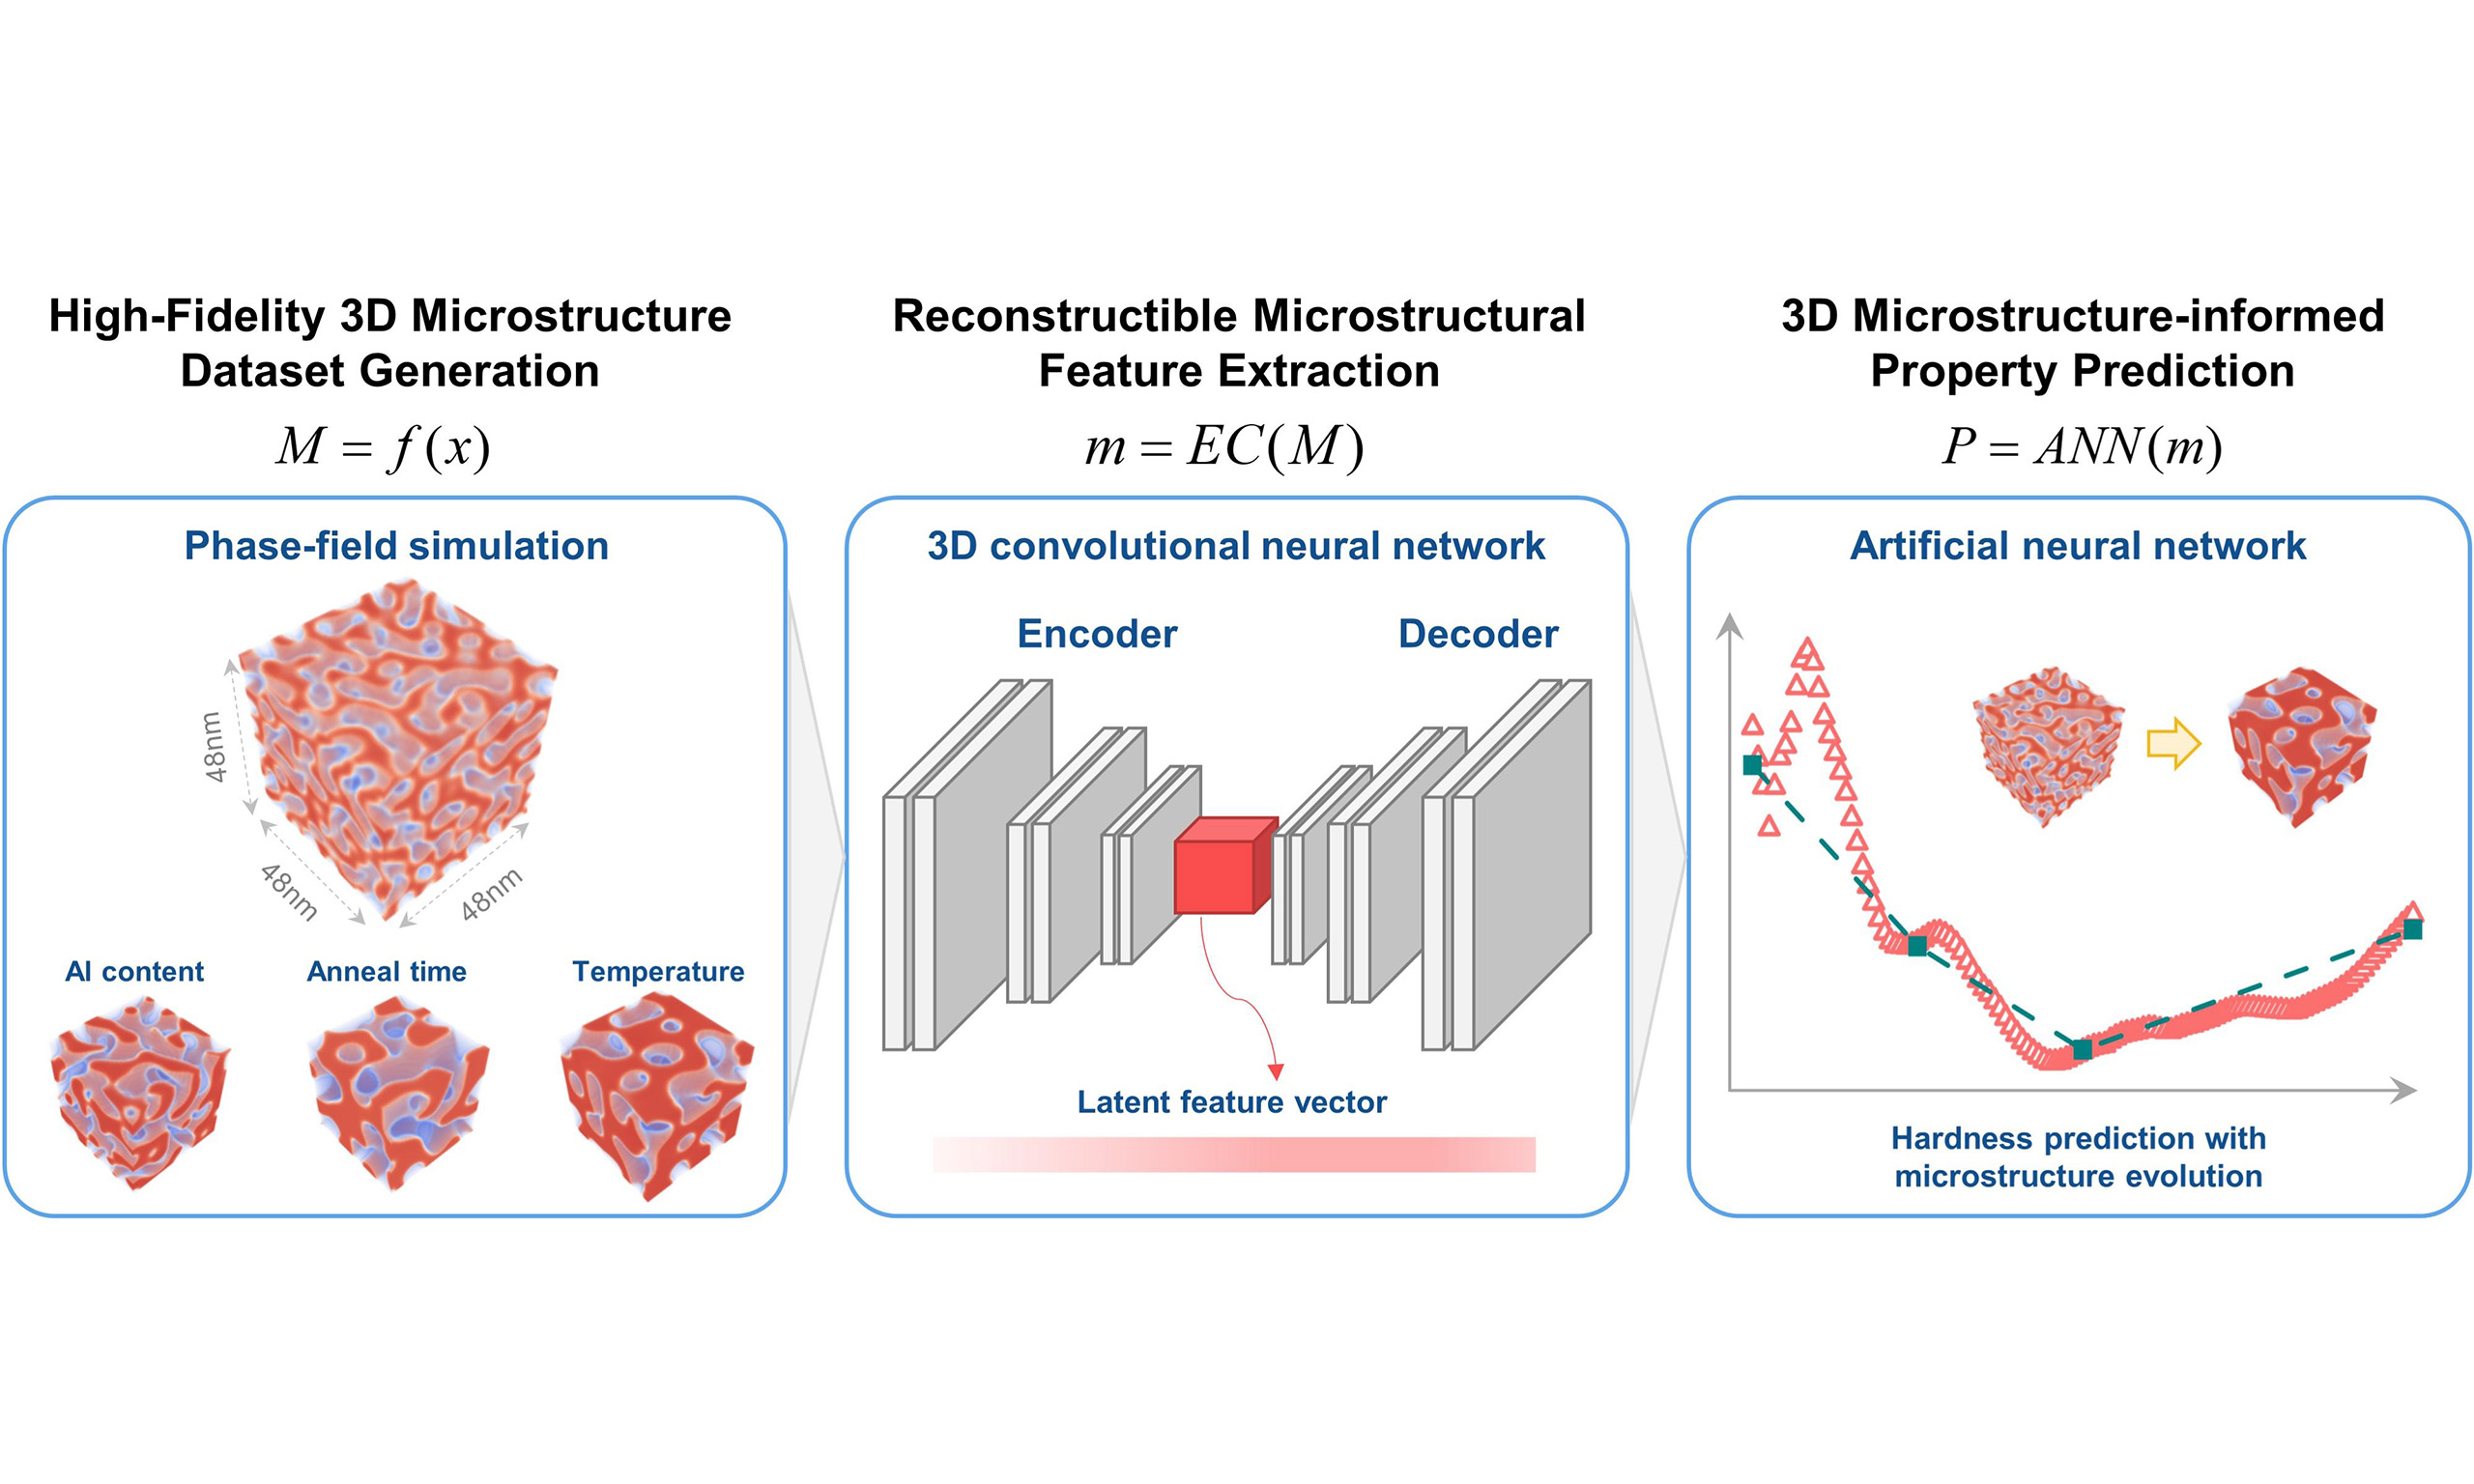
In this work, a novel approach for leveraging high-fidelity simulation results for property prediction with ML and numerical simulation was proposed. The schematic of the 3D microstructure-centered property prediction framework is shown in Figure 1. A widely used Ti1-xAlxN coating was selected for the study as a demonstration. The coating shows noticeable change in hardness during high-temperature service, resulting from the spinodal decomposition into metastable cubic (c) TiN-rich and cubic (c) AlN-rich domains[34-36]. Accurate property prediction is particularly important for the modulation of coating compositions and processes. Consequently, the main aims of this work are: (i) to acquire quantitative 3D microstructure evolution results of spinodal decomposition in TiAlN coatings with a wide composition and temperature range by using phase-field simulation and limited experimental microstructures; (ii) to establish a reconstructible 3D microstructure feature extraction model and distill the critical microstructure features of TiAlN coating 3D microstructure information, and (iii) to train the hardness prediction model and obtain the quantitative relation between the critical microstructure features and the hardness of TiAlN coatings.
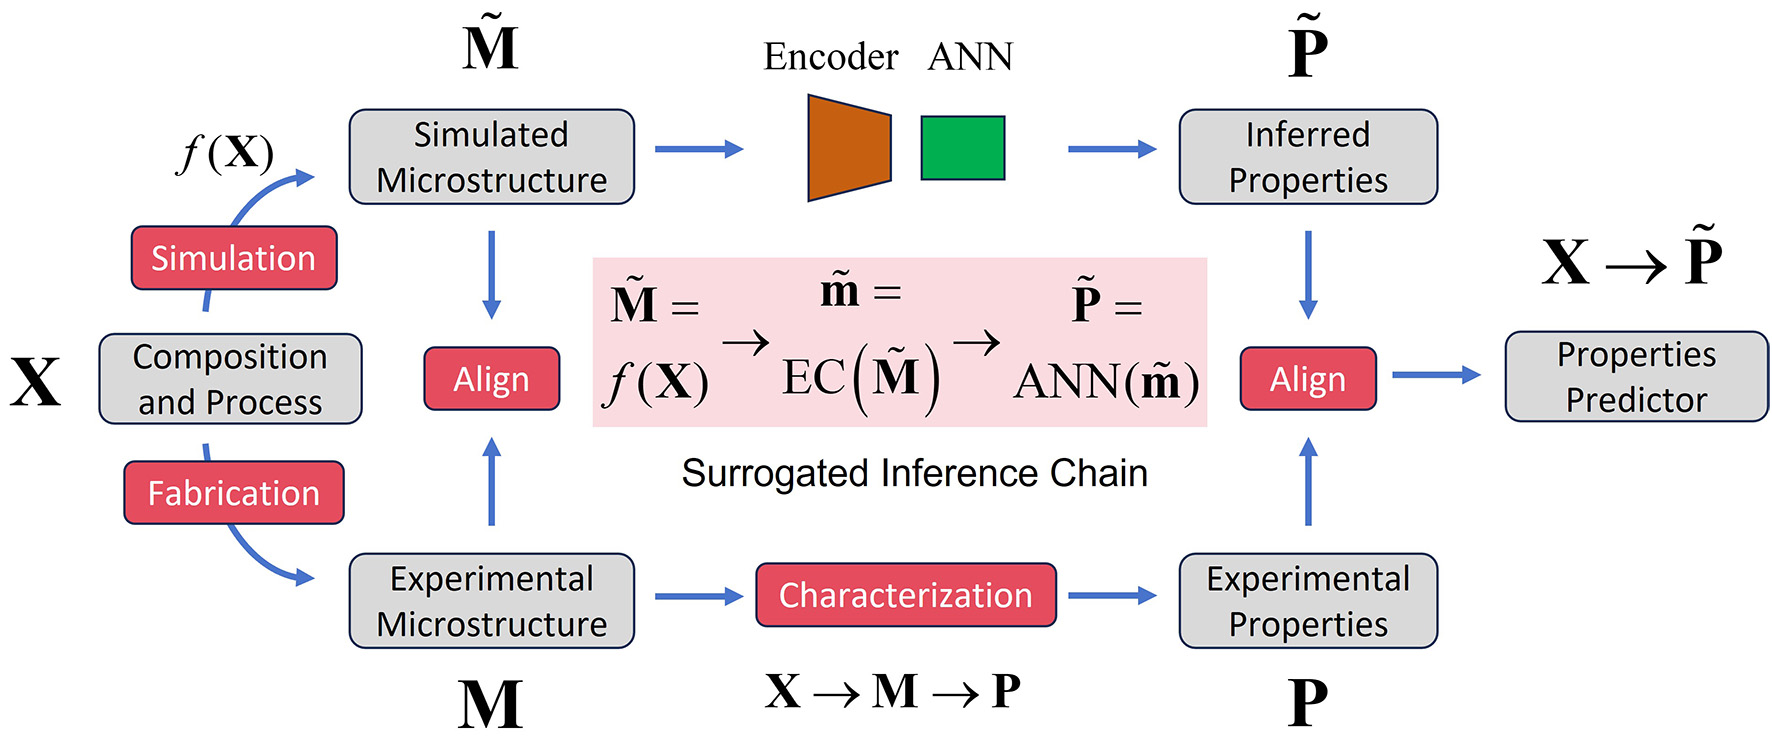
Figure 1. Flowchart for present work. Constructing the “composition-process-structure-property” relation by using high-fidelity simulation results and machine learning method based on limited experiment data.
MATERIALS AND METHODS
Framework for fusing numerical simulation and experimental information towards materials property prediction
A chain model for alloy property prediction can be constructed based on limited experimental data:
where X denotes alloys with different compositions and processes,
Phase-field model of spinodal decomposition
To simulate the microstructure evolution of TiAlN coatings during spinodal decomposition, the Cahn-Hilliard model was applied. The total energy functional in the TiAlN coating system is expressed as follows:
where Vm represents the molar volume, G denotes the free energy, and κ is the gradient energy coefficient.
where M refers to the chemical mobility. κ represents the gradient energy which can be calculated based on thermodynamic parameters, as given by
where the interatomic distance, denoted as b, is typically chosen as a value ranging between 1/3 and 1/4 of the lattice constant a. xA and xB stand for the molar fractions of components A and B respectively, and Li represents the interaction parameter, which can be determined by the CALPHAD thermodynamic database[37].
Eel in Equation (1) is elastic energy density given as:
where λijkl is the inhomogeneous elastic modulus tensor; the elastic strain
Structure of feature extraction model and property prediction model
The raw data for each simulated microstructure represent a numerical array of Al concentration values (a floating-point number between 0 and 1 for each grid point). However, directly using such large scale 3D phase-field simulation numerical array data as training input may lead to unnecessarily large network sizes and poor convergence during the model training process. With the lower-dimensional representation of data, the relation towards prediction for the microstructure-determined property would also be beneficial. Therefore, aiming to extract the low-dimensional latent vectors of microstructural features, a 3D-CNN-based autoencoder model was constructed. Figure 2 illustrates a schematic with the underlying network architectures for encoder, decoder, and regressor networks used in this study. This autoencoder model consists of two parts: an encoder-decoder model for extracting and reconstructing 3D microstructure information, and an encoder-regressor model for predicting the hardness of TiAlN coatings. All models are implemented in Python 3.12.3 within the PyTorch framework (version: 2.7.1+cu118).
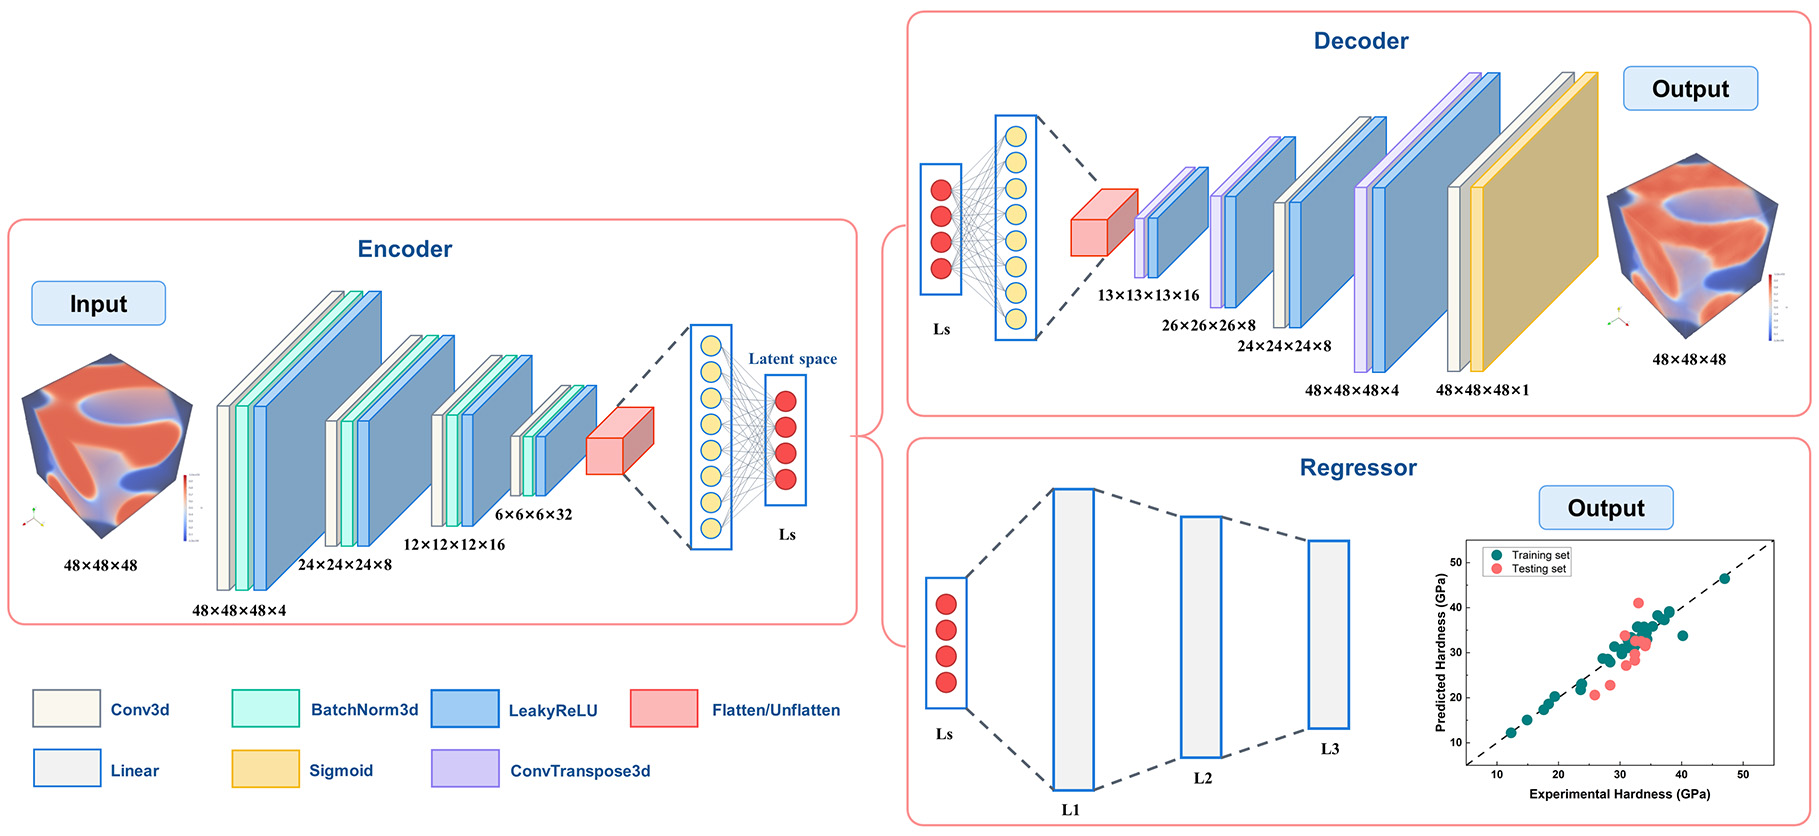
Figure 2. Schematic diagram of 3D-CNN-based reconstructible microstructure feature extraction model (Encoder-Decoder) and property prediction model (Encoder-Regressor).
The reconstructible microstructure feature extraction model is constructed by a series of 3D convolutional layers (Conv3d), batch normalization, flattened, and dense layers, and each adjacent Conv3d layer is connected by a Leaky Rectified Linear Unit (LeakyReLU) as activation function. The detailed hyperparameters regarding each network can be found in Supplementary Table 1. The microstructure results of TiAlN coatings, obtained from high-fidelity phase-field model simulations with dimensions of 48 × 48 × 48 grids, were gradually compressed and transformed into a latent vector with a latent space size (Ls). Compared with feature dimensionality reduction methods such as principal component analysis and multidimensional scaling, the encoder can handle much more complex features using deeper Conv3d layers. The decoder then maps the latent vector back to the 3D microstructure image of 48 × 48 × 48 grids through a series of 3D transpose convolutional layers (ConvTranspose3d), gradually reconstructing the original microstructures and features. By comparing the reconstruction results with the original microstructure, we can further analyze the reliability of the feature extraction model and evaluate the applicability of the extracted features. The regressor unit is an ANN consisting of two hidden layers. The low-dimensional microstructure latent space from the encoder module was further processed by the regressor. Finally, the structure-property relation was established by introducing fully connected layers, which were used for the hardness prediction of TiAlN coatings.
Model training and evaluation metrics
During the training process, the mean absolute error, L1 loss function, was used to evaluate the differences between the original and reconstructed microstructures. The model parameters are inversely optimized by minimizing the L1 loss:
where yi is the true value and f(xi) is predicted value. n is the number of samples.
To get a qualitative analysis of the prediction accuracy, a structural similarity index measure (SSIM) was applied to calculate the 3D similarity between reconstructed and simulated structures, which is defined as:
where μφ, μϕ, σφ, and σϕ denote the average value and variance of original image φ and reconstructed ϕ images, respectively. σφφ indicates the covariance between the two images. C1 and C2 are constants.
RESULTS AND DISCUSSION
Construction of high-fidelity 3D microstructure dataset
High-fidelity microstructure datasets are essential for establishing a linkage between composition/temperature and hardness. For c-TiAlN coatings, the Cahn-Hilliard model is a crucial approach for simulating the microstructure evolution during spinodal decomposition. However, precise model parameters are generally not readily obtainable, which leads to subtle distinctions between the simulated results and those of high fidelity, e.g., regarding the wavelength and corresponding distribution.
In this work, the microstructure evolution of TiAlN coatings with Al content of 0.42~0.66 and annealing temperatures in the range of 1,073~1,273 K was simulated, following the same free energy formulation, diffusion coefficients, and gradient energy coefficients as described in our previous work[38]. Microstructure simulation data were extracted every 60 s for a total simulation duration of 2 h (partially 4 h). The specific microstructure information list is illustrated in Supplementary Table 2. An ultra-large dataset containing 4,962 high-fidelity simulation microstructure results was finally constructed for the autoencoder model training, where the simulation domain is 48 × 48 × 48 nm3 with a grid spacing of 1 nm. It is important to acknowledge the simplifications inherent in our phase-field model to contextualize the simulation results. The current model focuses on the bulk spinodal decomposition driven by chemical free energy and interfacial energy, neglecting other potential factors such as residual stresses from deposition, the presence of grain boundaries, and the influence of the substrate. These factors can, in reality, influence the kinetics and morphology of decomposition. However, for the primary objective of this study, to establish a generalized, high-throughput framework for linking 3D microstructure to properties, the chosen model is both appropriate and effective. It successfully captures the fundamental physical process (uphill diffusion and phase separation) that governs the age-hardening behavior in TiAlN coatings. The high fidelity of the simulation microstructure provides a robust foundation for the subsequent property prediction.
Training of reconstructible microstructure feature extraction model
For an accurate autoencoder model, over 4,962 phase-field simulation structures were used to enrich the high-quality dataset and train the model. Databases constructed from microstructural results of phase-field simulations provide more detailed and varied data information, which in turn leads to more complex and variable data patterns that need to be handled. Exact training on such large datasets is a time-consuming task. Thus, as shown in Figure 3, a transfer learning-based model training strategy was applied in this work. A pretraining process was first implemented, and only a small data sample was used for multi-step model training and optimization. After that, based on the trained pretraining model, the model parameters are retrained and fine-tuned in a few epochs using the 4,962 large dataset. The final encoder-decoder model with high-fidelity feature extraction ability is obtained. Supplementary Figure 1 shows the loss curve of 2,000 epochs of pretraining and 500 epochs of retraining. Each autoencoder training took only 1 h (approximately 17 min for pretraining and 43 min for retraining) on one NVIDIA GeForce RTX 4070Ti GPU. Since a pretrained base model was already provided, it can converge to the optimal solution faster when training on large sample datasets.
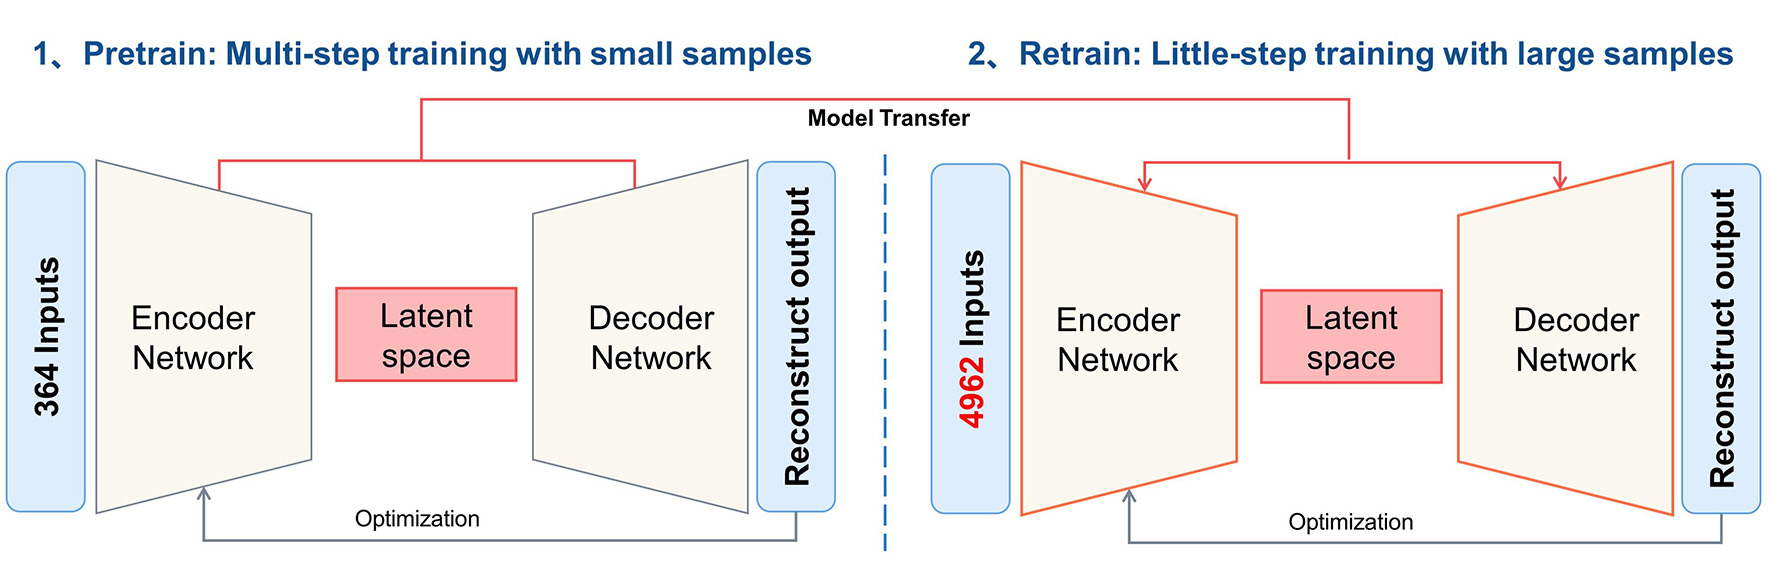
Figure 3. A transfer learning-based model training strategy. Start by training the model parameters with small data samples to obtain a base model, and then continue to train on large data samples in small batches to obtain a high-performance model.
To obtain low-dimensional and exhaustive microstructure information, the impact of the latent space size of autoencoder, Ls, on the model performance was investigated. To this end, we trained four autoencoder models with Ls = 512, 256, 128, and 64, respectively. The L1 loss values of train and test datasets for different models are reported in Table 1. From this survey, we observe that reducing the size of latent space does not influence the accuracy of models pretrained on small datasets, but significantly worsens the performance of retrained models with large datasets. Adhering to the goal of describing large-scale microstructural information with as few features as possible, we finally chose the model with Ls = 128. The loss value of this model is less than 0.015 on both the training and testing sets. These results demonstrate not only the ability of our framework to accurately provide a compact representation of the complex 3D microstructure data in a low-dimensional latent space but also illustrate the robustness of the training of this framework.
Detailed survey of different latent space sizes, Ls, on the pretrained and retrained model
| Ls | Pretrain | Retrain | ||
| L1 loss train | L1 loss test | L1 loss train | L1 loss test | |
| 512 | 0.011254 | 0.012894 | 0.010694 | 0.012184 |
| 256 | 0.010586 | 0.012114 | 0.010961 | 0.012813 |
| 128 | 0.010481 | 0.013354 | 0.015425 | 0.017205 |
| 64 | 0.011286 | 0.011703 | 0.022322 | 0.025672 |
Accuracy of 3D microstructure reconstruction
A comparison of the reconstruction microstructure from the decoder model with that from high-fidelity phase-field simulations is demonstrated in Figures 4 and 5. The microstructure evolution of Ti0.44Al0.56N coatings during annealing at 1,073.15 K is illustrated in Figure 4A. During the initial time steps
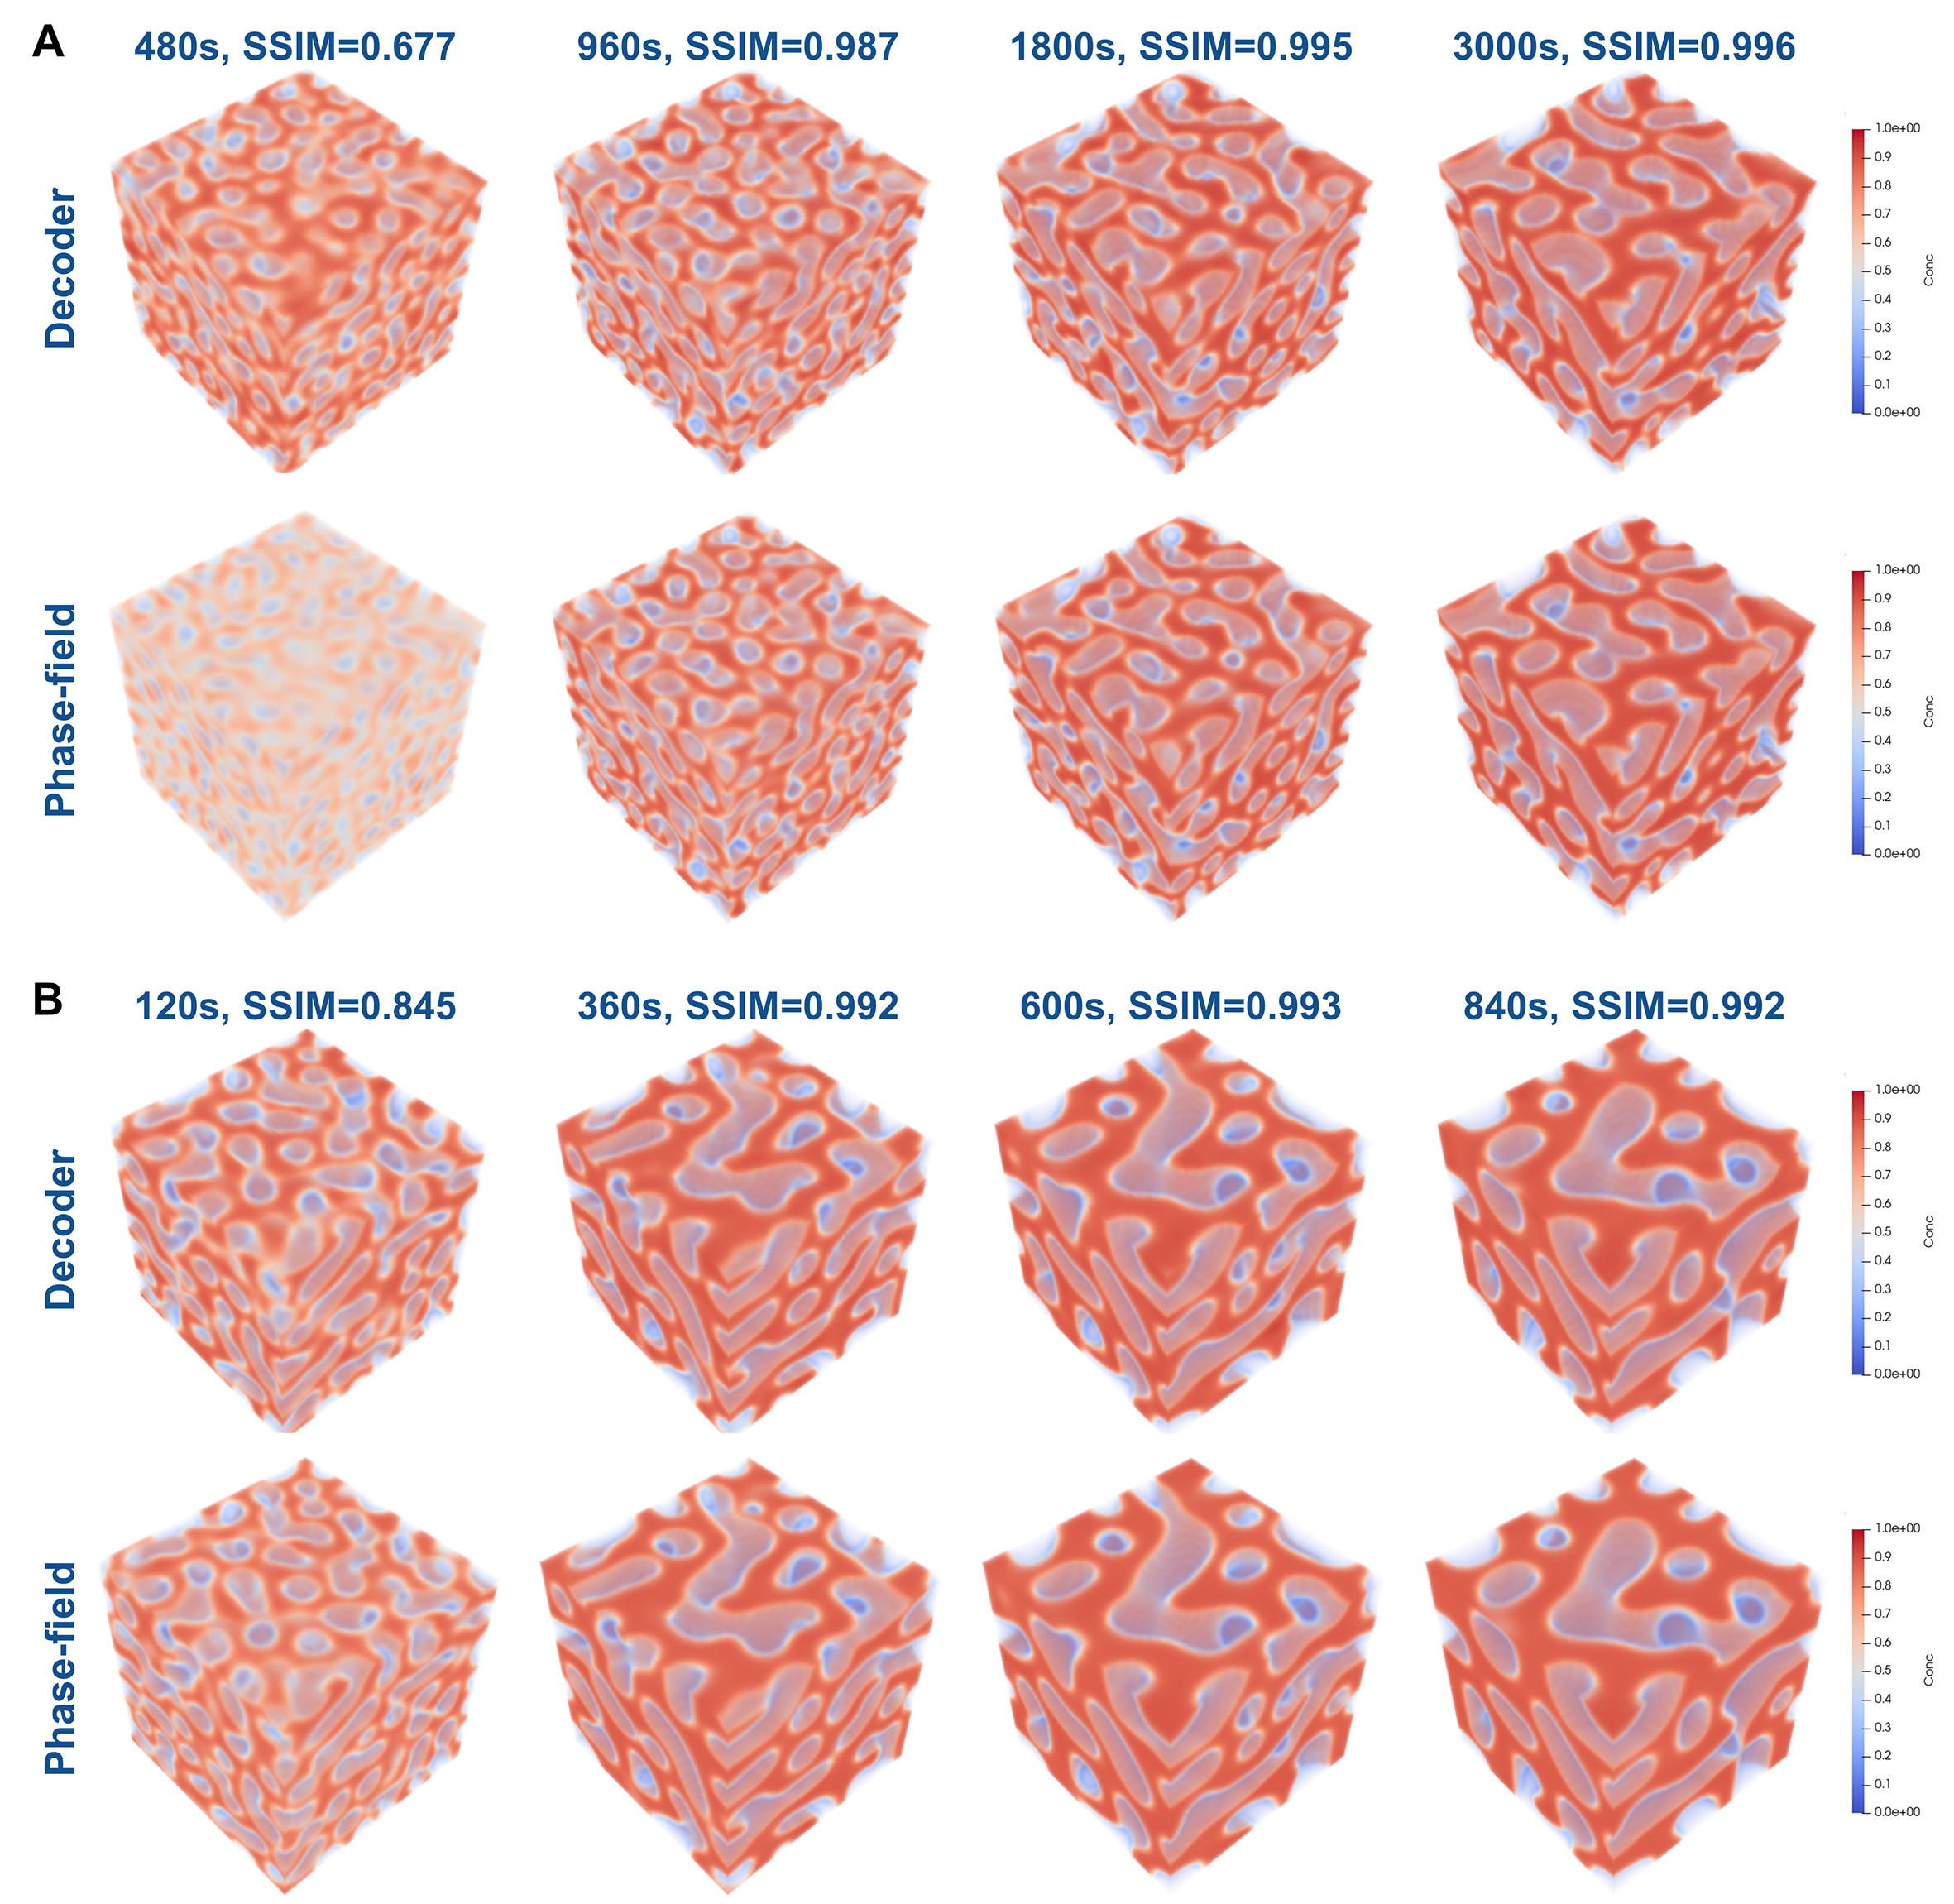
Figure 4. Comparison of decoder reconstruction and phase-field simulation microstructure. (A) Result of Ti0.44Al0.56N coating annealed at 1,073.15 K. (B) Result of Ti0.44Al0.56N coating annealed at 1,173.15 K.
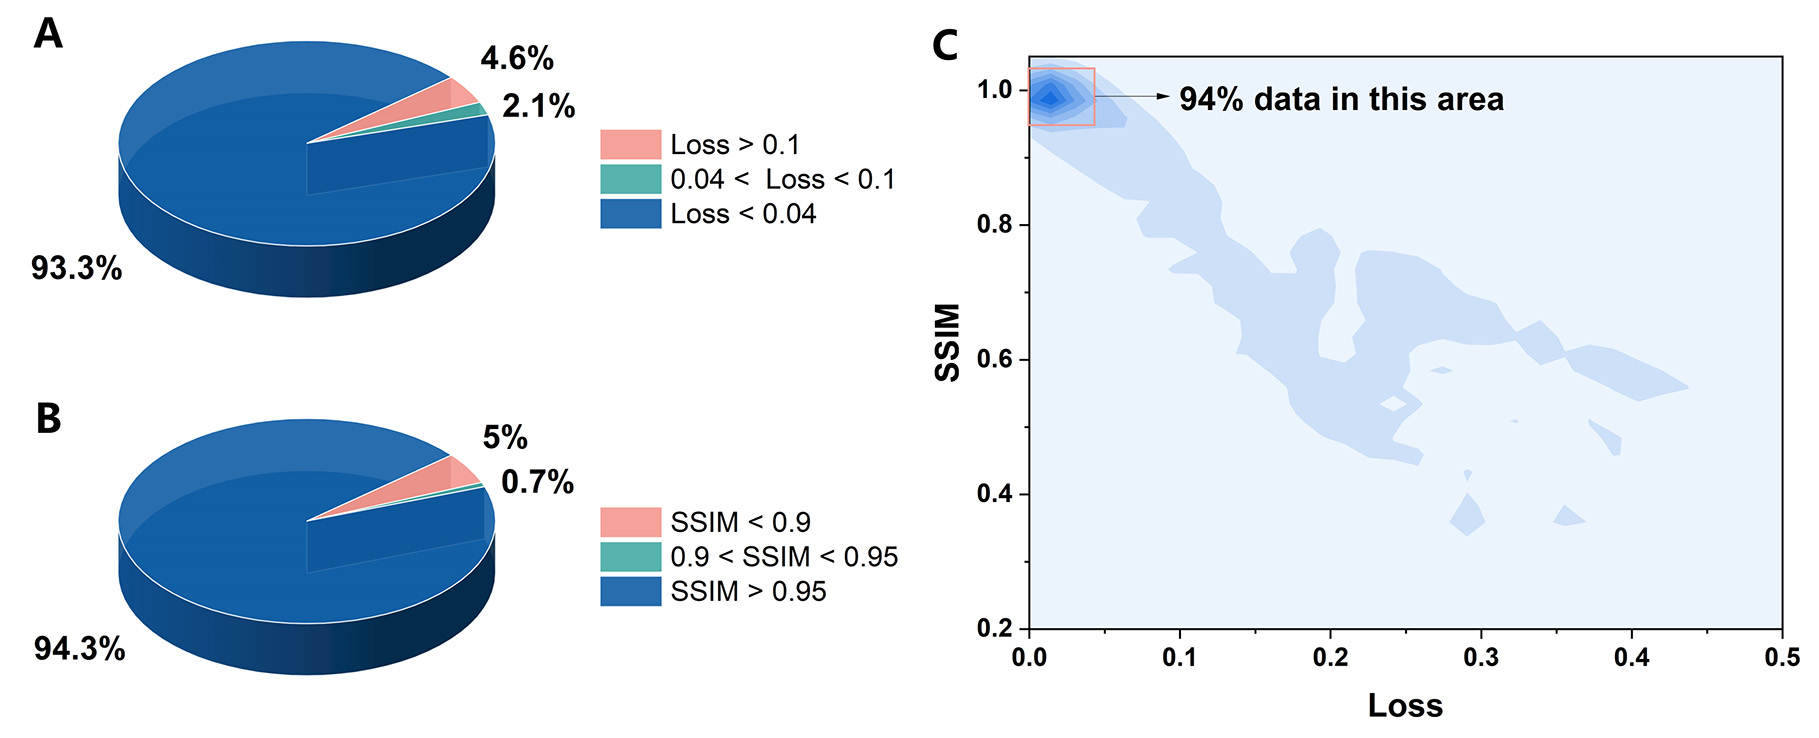
Figure 5. Result of accuracy analysis between all the reconstructed and simulated microstructures. (A) L1 loss value. (B) Structural similarity index. (C) Kernel density contour fill map for L1 loss-SSIM values.
To get a qualitative analysis of the prediction accuracy, a SSIM was applied to calculate the 3D similarity between reconstructed and simulated structures. Since there is no available codebase that supports the direct calculation of 3D SSIM, we can use an approximation that slices the 3D image into 48 pieces of 2D pictures along the Z-axis and calculates the 2D SSIM for each slice, using the average value to express the similarity of 3D microstructures. Higher SSIM values refer to more realistic reconstructed microstructures. As shown in Figure 4, the SSIM value is low for the initial time steps, where features evolve rapidly with time. However, the similarity improves over time and maintains at 0.99 when the evolution process slows down and the microstructure coarsens. Increasing the annealing temperature leads to faster equilibrium of spinodal decomposition and improves the accuracy of prediction results. We further calculated the error and similarity of the microstructures for all 4,962 samples. Among these, 93.3% had a loss value below 0.04, and no more than 5% exhibited a large prediction error [Figure 5A]. Additionally, 94.3% of the predicted microstructures had a similarity greater than 0.96 to the simulation results [Figure 5B]. It is foreseeable that the dimensionality reduction from a 48 × 48 × 48 microstructure to a 128-dimensional latent vector inevitably leads to the loss of some details, especially in early-stage fine fluctuations. The complexity of the microstructure itself influences reconstruction fidelity. The initial decomposition stage features numerous, small-scale, and low-amplitude compositional fluctuations with high spatial frequency. These features are inherently more difficult to reconstruct compared to the larger, more stable and interconnected domains present in the coarsened stages. The model prioritizes capturing the dominant global morphology, which is most critical for property prediction. From the kernel density contour fill map [Figure 5C], we can see that nearly 94% of the sample points are local at the area with high SSIM and low loss value which confirms the feature extraction efficiency and detail microstructure preservation of the encoder-decoder model. While the 128-dimensional latent space is inherently complex, it encodes salient morphological characteristics critical to mechanical properties. These likely include quantitative measures of the interpenetrating network structure, such as the dominant wavelength of decomposition, the interfacial area density between the c-TiN-rich and c-AlN-rich phases, and the connectivity and curvature of the phases. By compressing the microstructure into a vector that preserves these key features, the encoder provides a highly efficient and information-rich descriptor that serves as a superior input for property prediction compared to traditional, hand-crafted metrics.
Training and validation for hardness prediction model
To further investigate the relationship between coating property changes and microstructure, a regression model for coating hardness prediction was established. The regressor unit is an ANN consisting of two hidden layers (For detailed hyperparameters, see Supplementary Table 1). All latent vectors of TiAlN coatings under different service conditions and time points are merged as input data. By training this regression model, the relationship between coating microstructure and properties can be established, enabling accurate prediction of coating hardness. Before training, the t-distributed stochastic neighbor embedding algorithm was used to perform dimensionality reduction on the microstructural feature vectors of the hardness dataset and compare them with all simulated microstructures. As shown in
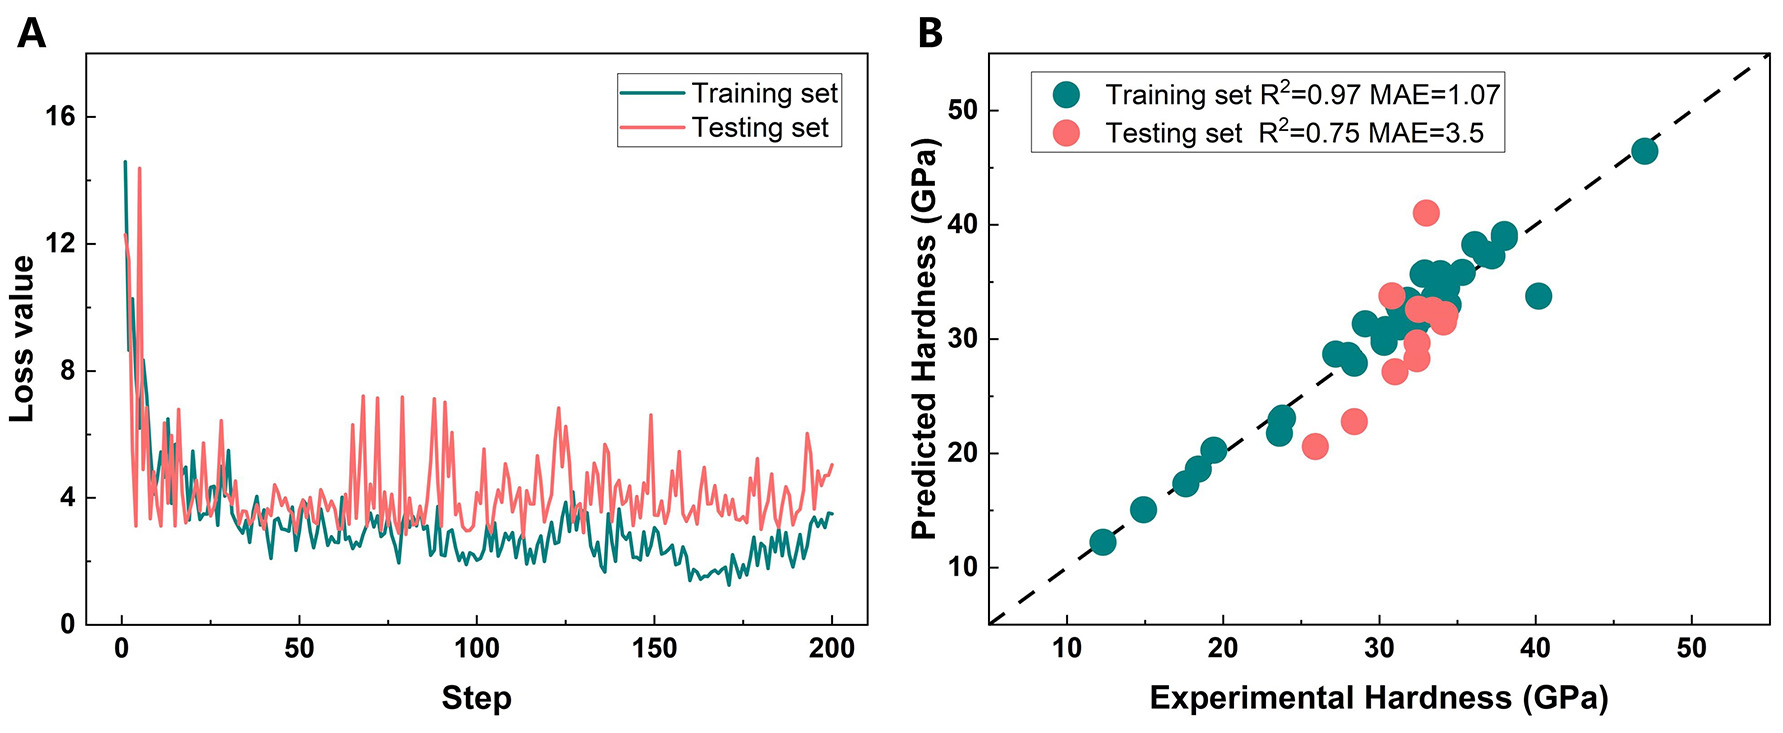
Figure 6. Result of training and evaluation for encoder-regressor model. (A) Loss curve of model training process. (B) Comparison of predicted hardness and actual hardness.
Based on the microstructure-hardness prediction model of TiAlN coatings, we further investigated the trends of hardness with coating composition, annealing time, and annealing temperature, and compared them with the experimentally measured hardness results to verify the accuracy of model prediction. As shown in Figure 7A, the coating hardness gradually increases with Al content and decreases after reaching the peak value. At the same annealing temperature of 1,073 K, extending the annealing time will reduce the hardness. For example, coatings with an Al content around 0.45 exhibit a hardness of ~35 GPa after 0.5 h of annealing, whereas the hardness drops to only ~10 GPa after 2 h of annealing (seen in Figure 7A). From Figure 7B, coatings with high Al content exhibit higher initial hardness in the as-deposited state. Annealing at appropriate temperatures can further enhance hardness, but higher temperatures accelerate the coarsening of the spinodal decomposition microstructure, which in turn reduces coating hardness. The model predictions are in good agreement with experimental measurements. Despite a slight performance gap between the training and testing sets [Figure 6B], this is typical when working with limited experimental data. The model’s primary success lies in its ability to accurately predict the overall trends of hardness evolution with composition and temperature, which align closely with experimental observations. This demonstrates that the model has learned the underlying physical structure-property relationships (i.e., hardening from coherent spinodal structures and softening from coarsening) rather than merely memorizing noise in the training data. Achieving a low prediction error of 1.6 GPa with only 52 data points underscores the effectiveness of the 3D-CNN autoencoder in extracting physically meaningful and predictive features from complex microstructure data.
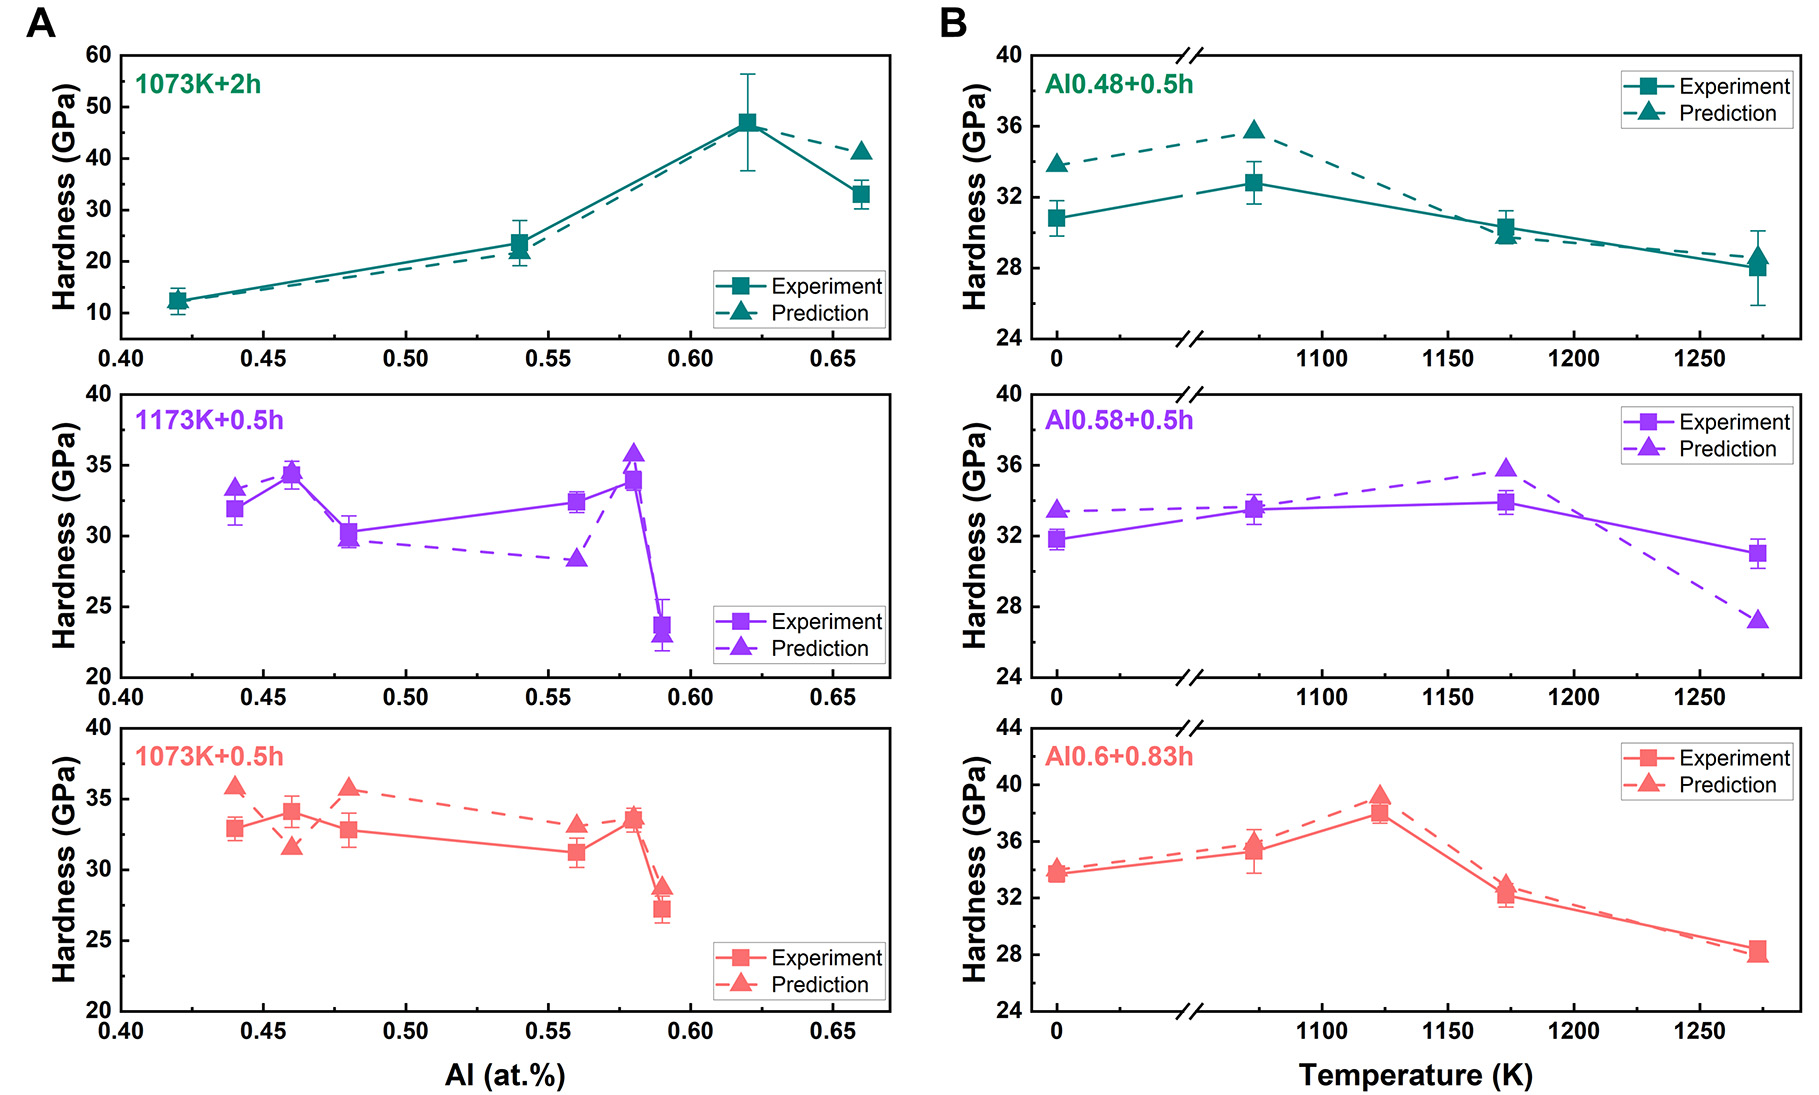
Figure 7. Prediction of hardness evolutions. (A) Variation of coating hardness with composition under the same heat treatment conditions. (B) Variation of coating hardness with annealing temperature for the same composition. The predicted value is the numerical result obtained directly from the model. Experiment data with error bar represent the average value and standard deviation from at least three independent measurements.
Capturing the property-microstructure relation of TiAlN coating
Microstructural evolution in service significantly affects the performance of coatings; however, traditional experimental measures make it difficult to capture the microstructural features and the logistics between them and the property, especially the phase-to-phase positional relationships and interactions in three-dimensional space. By coupling numerical simulation and autoencoder, our proposed framework enables accurate simulation of the TiAlN coating microstructure under different conditions, and directly establishes a quantitative relationship between the microstructure and property by using the extracted key features, thus realizing the prediction of property evolution during varying service processes. Figure 8A demonstrates the evolution of coating hardness over time for Ti0.46Al0.54N coating annealed at 1,073 K. Under prolonged annealing, the coating gradually softens and the predicted hardness values show a decreasing trend in good agreement with the experimental observations.
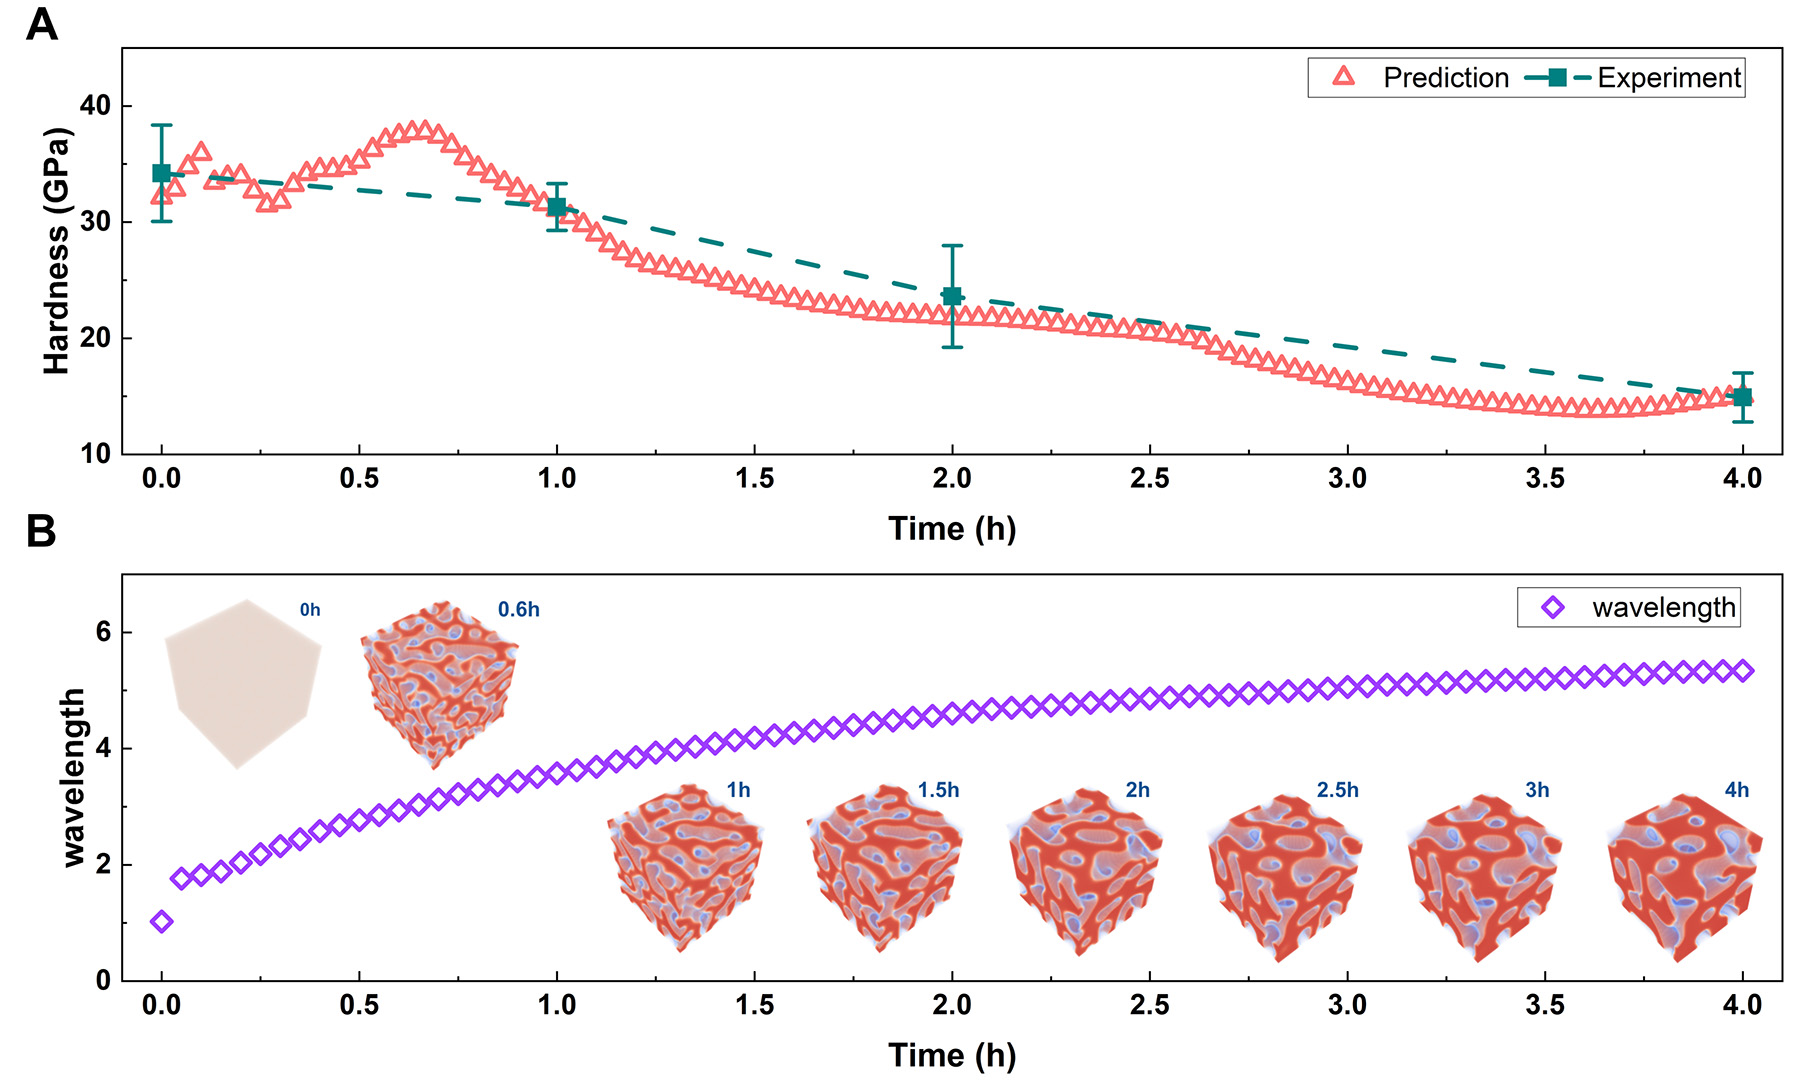
Figure 8. Property and microstructure evolution of Ti0.46Al0.54N coating during annealing at 1,073 K. (A) Time-dependent variations of coating predicted and experimental hardness (B) 3D microstructure and wavelength. The predicted value is the numerical result obtained directly from the model. Experiment data with error bar represent the average value and standard deviation from at least three independent measurements.
Coating properties are closely related to microstructure. We extracted the 3D microstructures and spinodal decomposition wavelengths at different times using the phase-field simulation results [Figure 8B]. Throughout the annealing process, the spinodal decomposition structure of the coating grows, and the wavelength increases, which correspondingly leads to a gradual decrease in the hardness. It reveals that the encoder-regressor hardness model learns the microstructure evolution behavior well and reflects it to the coating hardness variation. Combining the results of hardness and microstructure evolution, an initial spinodal decomposition stage followed by a coarsening stage can be distinguished. The initial decomposition leads to the formation of a nanoscale compositionally modulated structure, which acts as a potent strengthener and results in a slight increase in hardness, reaching a peak of ~37 GPa at approximately 0.65 h. This age-hardening phenomenon is a well-documented characteristic of TiAlN coatings and other systems undergoing spinodal decomposition. As the c-TiN-rich and c-AlN-rich phases grow, the coating enters the roughening stage, and the hardening effect diminishes, leading to the observed gradual decrease in hardness. However, such subtle hardness variations are often difficult to detect experimentally because data points are typically sparse, resulting in an apparently monotonic decay. Overall, the momentary values and trends of hardness predicted by the 3D microstructure-augmented ML model are consistent with experimental results. It is worth noting that our feature extraction and hardness prediction model can capture microstructural evolution with higher temporal resolution. Predicted microstructures and hardness can be obtained for TiAlN coatings at any time point, including information that is often missed in experiments.
Overall, the analysis of the relationship between coating hardness and microstructure further demonstrates the reliability of the hardness prediction models. Using only a small amount of experimental data, we have successfully constructed a quantitative “composition-process-structure-property” relation and achieved dynamic prediction of coating hardness. This success is closely linked to quantitative phase-field simulations and an accurate structure feature extraction ML model. High-fidelity simulation results provide rich 3D microstructural information and high-quality datasets for model training that cannot be obtained through traditional experimental methods. The 3D-CNN-based autoencoder model enables the transformation of large amounts of actual 3D structural information into low-dimensional structural feature vectors, providing the necessary data for constructing a high-precision hardness model. Although this study focuses on hardness prediction of TiAlN coatings, the proposed framework is generalizable. The phase-field model can be adapted to different materials by incorporating appropriate thermodynamic and mobility databases, while the 3D-CNN autoencoder remains effective for extracting latent features from diverse microstructures. Moreover, with suitable experimental training data - such as fracture toughness, wear resistance, or thermal properties - the same framework could be used to predict other mechanical and functional properties. This flexibility underscores the potential of our approach to accelerate the design and optimization of a wide range of advanced materials.
CONCLUSIONS
In this work, we proposed a data-driven framework that integrates phase-field simulation, a 3D convolutional neural network autoencoder, and limited experimental data to establish a quantitative composition-process-structure-property relationship for TiAlN coatings. The results demonstrate that the proposed 3D-CNN-based autoencoder can effectively extract representative latent features from complex 3D microstructures and accurately reconstruct the simulated structures, enabling efficient microstructure representation for deep learning models. By combining the extracted microstructure features with a small experimental dataset, an microstructure-based model was successfully developed to predict the hardness evolution of TiAlN coatings with high accuracy (5.3% error for an average hardness of 30.8 GPa in training set) and to capture the underlying microstructure-property relationship during spinodal decomposition.
This study highlights the potential of integrating high-fidelity simulations with deep learning to bridge microstructure and material performance, providing a promising pathway for accelerating the design and optimization of advanced coating materials and other microstructure-sensitive material systems.
DECLARATIONS
Authors’ contributions
Conception and design of the study: Zhang, L.; Zhong, J.
Simulation and modeling: Gao, T.; Zhang, T.; Long, Y.
Data collation and analisys: Long, Y.
Manuscript writing: Gao, T.; Zhong, J.; Long, Y.
Supervision, review and editing: Zhang, L.
Availability of data and materials
All data used in this study were listed in Supplementary Material. All codes used in this study will be made available upon reasonable request to the corresponding authors.
AI and AI-assisted tools statement
Not applicable.
Financial support and sponsorship
This work was supported by the Scientific Research Fund of Hunan Provincial Education Department (Grant No. 24A0024), the Youth Fund of the National Natural Science Foundation of China (Grant No. 52101028), the Natural Science Foundation of Hunan Province for Distinguished Young Scholars (Grant No. 2021JJ10062), China Postdoctoral Science Foundation (Grant No. 2021M703628), and Natural Science Foundation of Hunan Province (Grant No. 2022JJ40629).
Conflicts of interest
All authors declared that there are no conflicts of interest.
Ethical approval and consent to participate
Not applicable.
Consent for publication
Not applicable.
Copyright
© The Author(s) 2026.
Supplementary Materials
REFERENCES
1. Bostanabad, R.; Zhang, Y.; Li, X.; et al. Computational microstructure characterization and reconstruction: review of the state-of-the-art techniques. Prog. Mater. Sci. 2018, 95, 1-41.
2. Cai, J.; Han, M.; Yan, X.; et al. A process-synergistic active learning framework for high-strength Al-Si alloys design. NPJ. Comput. Mater. 2025, 11, 1721.
3. Jiang, L.; Zhang, Z.; Hu, H.; He, X.; Fu, H.; Xie, J. A rapid and effective method for alloy materials design via sample data transfer machine learning. NPJ. Comput. Mater. 2023, 9, 979.
4. Zhang, H.; Fu, H.; Zhu, S.; Yong, W.; Xie, J. Machine learning assisted composition effective design for precipitation strengthened copper alloys. Acta. Mater. 2021, 215, 117118.
5. Gao, T.; Gao, J.; Yang, S.; Zhang, L. Data-driven design of novel lightweight refractory high-entropy alloys with superb hardness and corrosion resistance. NPJ. Comput. Mater. 2024, 10, 1457.
6. Giles, S. A.; Sengupta, D.; Broderick, S. R.; Rajan, K. Machine-learning-based intelligent framework for discovering refractory high-entropy alloys with improved high-temperature yield strength. NPJ. Comput. Mater. 2022, 8, 926.
7. Jia, B.; Wan, Q.; Yan, L.; et al. Tribological properties and machine learning prediction of FeCoCrNiAlN high entropy coatings. Surf. Coat. Technol. 2024, 477, 130341.
8. Zou, H.; Tian, Y.; Zhang, L.; et al. Integrating machine learning and CALPHAD method for exploring low-modulus near-β-Ti alloys. Rare. Met. 2024, 43, 309-23.
9. Liu, Z.; Wang, T.; Jin, L.; et al. Towards high stiffness and ductility - The Mg-Al-Y alloy design through machine learning. J. Mater. Sci. Technol. 2025, 221, 194-203.
10. Yang, W.; Wang, Y.; Huang, X.; Liu, S.; Wang, P.; Du, Y. Effects of Cu content and Sintering temperature on microstructure and mechanical properties of SiCp/Al-Cu-Mg composites through experimental study, CALPHAD-type simulation and machine learning. J. Mater. Res. Technol. 2024, 33, 2216-25.
11. Qiu, R.; Aboulfadl, H.; Bäcke, O.; Stiens, D.; Andrén, H.; Halvarsson, M. Atom probe tomography investigation of 3D nanoscale compositional variations in CVD TiAlN nanolamella coatings. Surf. Coat. Technol. 2021, 426, 127741.
12. Knutsson, A.; Ullbrand, J.; Rogström, L.; et al. Microstructure evolution during the isostructural decomposition of TiAlN - A combined in-situ small angle X-ray scattering and phase field study. J. Appl. Phys. 2013, 113, 213518.
13. Tai, P.; Pang, L.; Shen, T.; et al. Microstructure evolution and nanohardness of nanostructured TiAlN coating under N+ ion irradiation. Surf. Coat. Technol. 2022, 441, 128494.
14. Salama, H.; Shchyglo, O.; Steinbach, I. The interplay between the martensitic transformation rate and the rate of plastic relaxation during martensitic transformation in low-carbon steel, a phase-field study. NPJ. Comput. Mater. 2025, 11, 1499.
15. Gong, P.; Sun, L.; Wynne, B. P.; Palmiere, E. J.; Rainforth, W. M. The effect of thermomechanical controlled processing on recrystallisation and subsequent deformation-induced ferrite transformation textures in microalloyed steels. J. Mater. Sci. 2018, 53, 6922-38.
16. Zou, Y.; Xu, Y.; Hu, Z.; et al. Austenite stability and its effect on the toughness of a high strength ultra-low carbon medium manganese steel plate. Mater. Sci. Eng. A. 2016, 675, 153-63.
17. Li, Z.; Wang, T.; Chu, D.; Liu, Z.; Cui, Y. A coupled crystal-plasticity and phase-field model for understanding fracture behaviors of single crystal tungsten. Int. J. Plast. 2022, 157, 103375.
18. Zhao, P.; Song, En. Low. T.; Wang, Y.; Niezgoda, S. R. An integrated full-field model of concurrent plastic deformation and microstructure evolution: application to 3D simulation of dynamic recrystallization in polycrystalline copper. Int. J. Plast. 2016, 80, 38-55.
19. Roy, A. M.; Ganesan, S.; Acar, P.; Arróyave, R.; Sundararaghavan, V. Combining crystal plasticity and phase field model for predicting texture evolution and the influence of nuclei clustering on recrystallization path kinetics in Ti-alloys. Acta. Mater. 2024, 266, 119645.
20. Cai, T.; Xu, Y.; Zhang, Z.; Zhang, S.; Huang, H. H.; Hu, C. C. The application of phase-field method in magnetoelastic functional materials. Microstructures 2025, 5, 2025059.
21. Xu, Y.; Cai, T.; Hu, C.; et al. Magnetic-field driven domain wall evolution in rhombohedral magnetostrictive single crystals: a phase-field simulation. Microstructures 2025, 5, 2024052.
22. Zhao, Y. Understanding and design of metallic alloys guided by phase-field simulations. NPJ. Comput. Mater. 2023, 9, 1038.
23. Wang, Y.; Zhang, Y.; Liu, X.; et al. Simulation of microstructure evolution in Mg alloys by phase-field methods: a review. Crystals 2022, 12, 1305.
24. Yang, C.; Xu, Q.; Liu, B. Phase-field-lattice Boltzmann simulation of dendrite growth under natural convection in multicomponent superalloy solidification. Rare. Met. 2020, 39, 147-55.
25. Yang, C.; Xu, Q.; Su, X.; Liu, B. Multiphase-field and experimental study of solidification behavior in a nickel-based single crystal superalloy. Acta. Mater. 2019, 175, 286-96.
26. Oommen, V.; Shukla, K.; Goswami, S.; Dingreville, R.; Karniadakis, G. E. Learning two-phase microstructure evolution using neural operators and autoencoder architectures. NPJ. Comput. Mater. 2022, 8, 876.
27. Ma, B.; Ban, X.; Huang, H.; Chen, Y.; Liu, W.; Zhi, Y. Deep learning-based image segmentation for Al-La alloy microscopic images. Symmetry 2018, 10, 107.
28. Kim, Y.; Park, H. K.; Jung, J.; et al. Exploration of optimal microstructure and mechanical properties in continuous microstructure space using a variational autoencoder. Mater. Des. 2021, 202, 109544.
29. Chowdhury, A.; Kautz, E.; Yener, B.; Lewis, D. Image driven machine learning methods for microstructure recognition. Comput. Mater. Sci. 2016, 123, 176-87.
30. Cang, R.; Li, H.; Yao, H.; Jiao, Y.; Ren, Y. Improving direct physical properties prediction of heterogeneous materials from imaging data via convolutional neural network and a morphology-aware generative model. Comput. Mater. Sci. 2018, 150, 212-21.
31. Long, X.; Lu, C.; Shen, Z.; Su, Y. Identification of Mechanical Properties of Thin-Film Elastoplastic Materials by Machine Learning. Acta. Mech. Solida. Sin. 2023, 36, 13-21.
32. Zhu, L.; Luo, Q.; Chen, Q.; et al. Prediction of ultimate tensile strength of Al-Si alloys based on multimodal fusion learning. Mater. Genome. Eng. Adv. 2024, 2, e26.
33. Kondo, R.; Yamakawa, S.; Masuoka, Y.; Tajima, S.; Asahi, R. Microstructure recognition using convolutional neural networks for prediction of ionic conductivity in ceramics. Acta. Mater. 2017, 141, 29-38.
34. Chen, L.; Paulitsch, J.; Du, Y.; Mayrhofer, P. H. Thermal stability and oxidation resistance of Ti-Al-N coatings. Surf. Coat. Technol. 2012, 206, 2954-60.
35. Biava, G.; de, Araujo. Fernandes. Siqueira. I. B.; Vaz, R. F.; et al. Evaluation of high temperature corrosion resistance of CrN, AlCrN, and TiAlN arc evaporation PVD coatings deposited on Waspaloy. Surf. Coat. Technol. 2022, 438, 128398.
36. Rachbauer, R.; Massl, S.; Stergar, E.; et al. Decomposition pathways in age hardening of Ti-Al-N films. J. Appl. Phys. 2011, 110, 023515.
37. Liu, Z.; Ågren, J.; Suehiro, M. Thermodynamics of interfacial segregation in solute drag. Mater. Sci. Eng. A. 1998, 247, 222-8.
38. Zhang, T.; Zhong, J.; Zhang, L. Pareto optimal driven automation framework for quantitative microstructure simulation towards spinodal decomposition. MRS. Commun. 2023, 13, 877-84.
39. Chavee, L.; Serag, E.; da Silva Pires, M.; Lucas, S.; Haye, E. A mechanistic approach of oxidation resistance, structural and mechanical behaviour of TiAlN coatings. Appl. Surf. Sci. 2022, 586, 152851.
40. Chen, L.; Du, Y.; Wang, A. J.; Wang, S. Q.; Zhou, S. Z. Effect of Al content on microstructure and mechanical properties of Ti-Al-Si-N nanocomposite coatings. Int. J. Reract. Met. Hard. Mater. 2009, 27, 718-21.
41. Sun, X.; Chen, L.; Zhou, J. Structure, mechanical and thermal properties of TiAlBN/TiAlN multilayers. Surf. Coat. Technol. 2022, 441, 128512.
42. Peng, Y. H.; Chen, L.; Xu, Y. X.; Hu, C.; Du, Y. Interface enhanced mechanical and thermal properties of TiSiN/TiAlN multilayers. J. Alloys. Compd. 2021, 861, 158571.
43. Chen, L.; Du, Y.; Wang, S. Q.; Wang, A. J.; Xu, H. Mechanical properties and microstructural evolution of TiN coatings alloyed with Al and Si. Mater. Sci. Eng. A. 2009, 502, 139-43.
44. Chen, Y.; Roa, J.; Yu, C.; et al. Enhanced thermal stability and fracture toughness of TiAlN coatings by Cr, Nb and V-alloying. Surf. Coat. Technol. 2018, 342, 85-93.
45. Zou, H. K.; Chen, L.; Chang, K. K.; Pei, F.; Du, Y. Enhanced hardness and age-hardening of TiAlN coatings through Ru-addition. Scr. Mater. 2019, 162, 382-6.
46. Zhang, J.; Hu, C.; Du, J. W.; Chen, L.; Kong, Y. Evolution of microstructure, mechanical and thermal properties with varied oxygen contents in TiAlON coatings. Int. J. Refract. Met. Hard. Mater. 2023, 111, 106074.
47. Mendez, A.; Monclus, M.; Santiago, J.; et al. Effect of Al content on the hardness and thermal stability study of AlTiN and AlTiBN coatings deposited by HiPIMS. Surf. Coat. Technol. 2021, 422, 127513.
48. Chaar, A.; Rogström, L.; Johansson-jöesaar, M.; et al. Microstructural influence of the thermal behavior of arc deposited TiAlN coatings with high aluminum content. J. Alloys. Compd. 2021, 854, 157205.
49. Forsén, R.; Johansson, M.; Odén, M.; Ghafoor, N. Decomposition and phase transformation in TiCrAlN thin coatings. J. Vac. Sci. Technol. Vac. Surf. Films. 2012, 30, 061506.
Cite This Article
How to Cite
Download Citation
Export Citation File:
Type of Import
Tips on Downloading Citation
Citation Manager File Format
Type of Import
Direct Import: When the Direct Import option is selected (the default state), a dialogue box will give you the option to Save or Open the downloaded citation data. Choosing Open will either launch your citation manager or give you a choice of applications with which to use the metadata. The Save option saves the file locally for later use.
Indirect Import: When the Indirect Import option is selected, the metadata is displayed and may be copied and pasted as needed.
About This Article
Special Topic
Copyright

Data & Comments
Data
0


Comments
Comments must be written in English. Spam, offensive content, impersonation, and private information will not be permitted. If any comment is reported and identified as inappropriate content by OAE staff, the comment will be removed without notice. If you have any queries or need any help, please contact us at [email protected].