


fig8
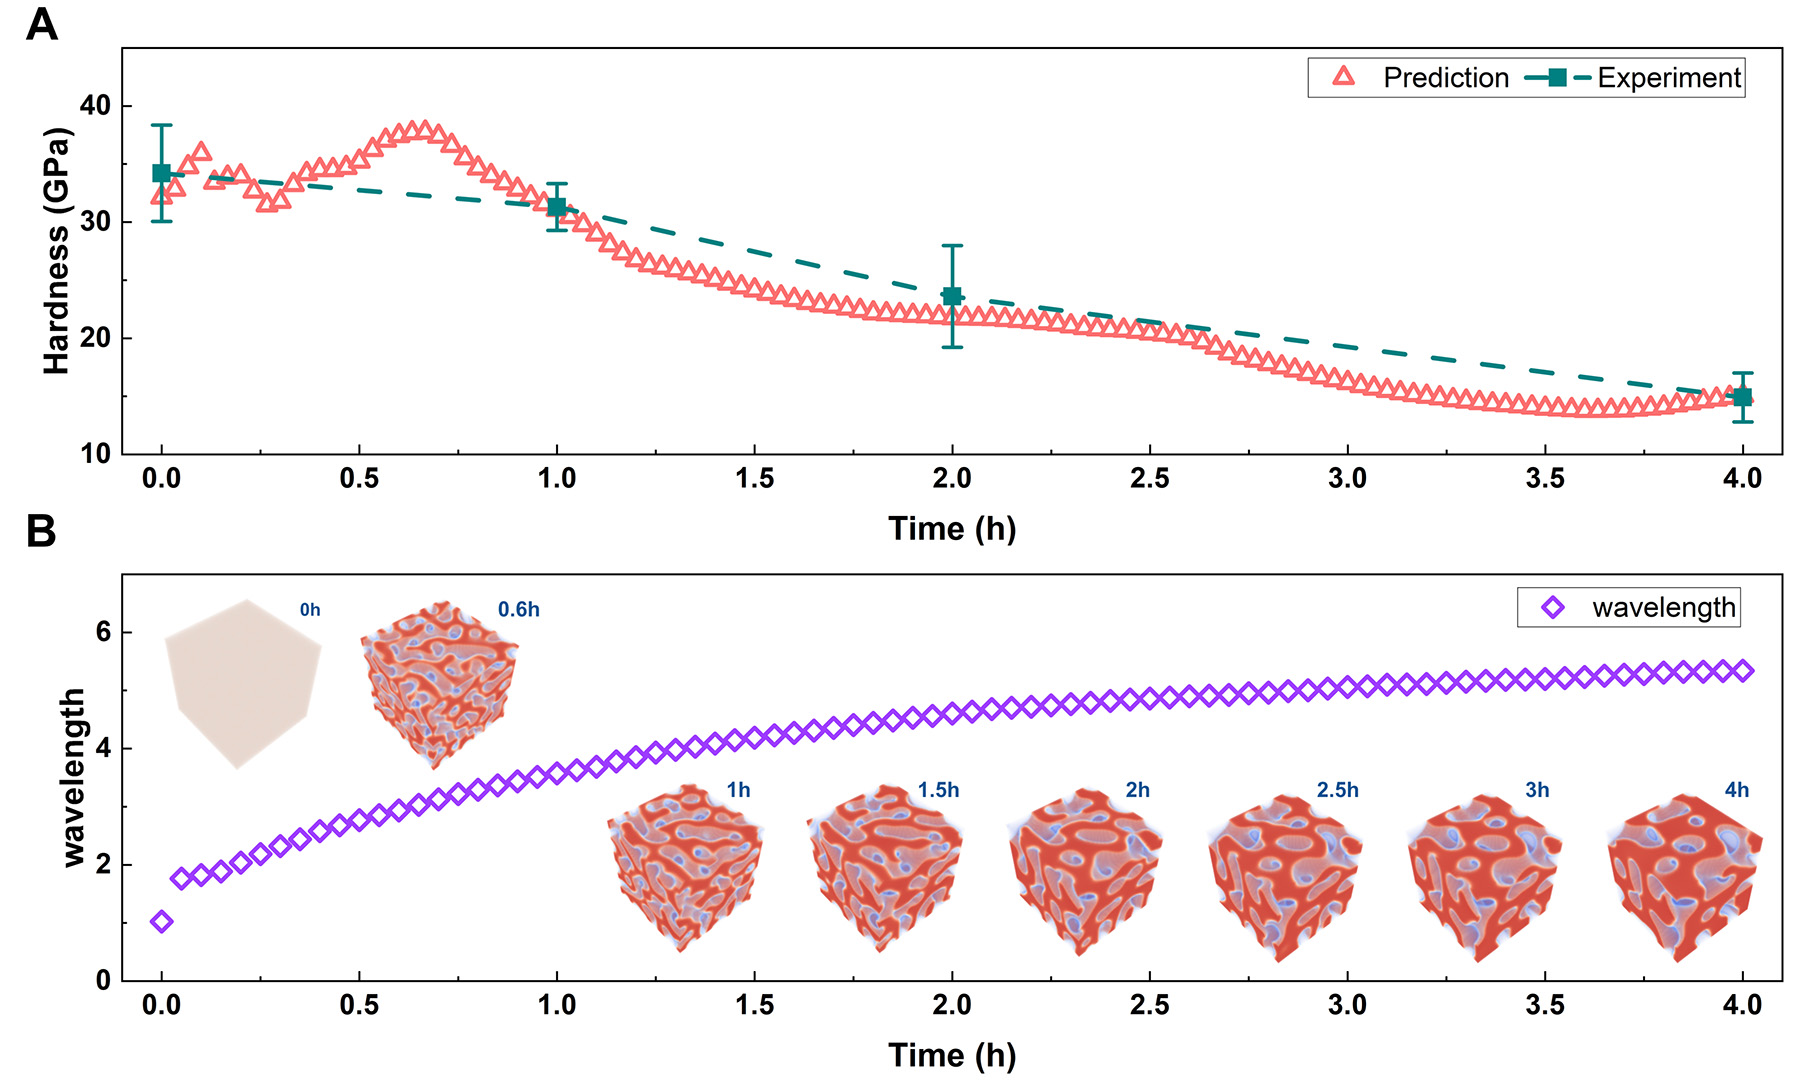
Figure 8. Property and microstructure evolution of Ti0.46Al0.54N coating during annealing at 1,073 K. (A) Time-dependent variations of coating predicted and experimental hardness (B) 3D microstructure and wavelength. The predicted value is the numerical result obtained directly from the model. Experiment data with error bar represent the average value and standard deviation from at least three independent measurements.


