


fig7
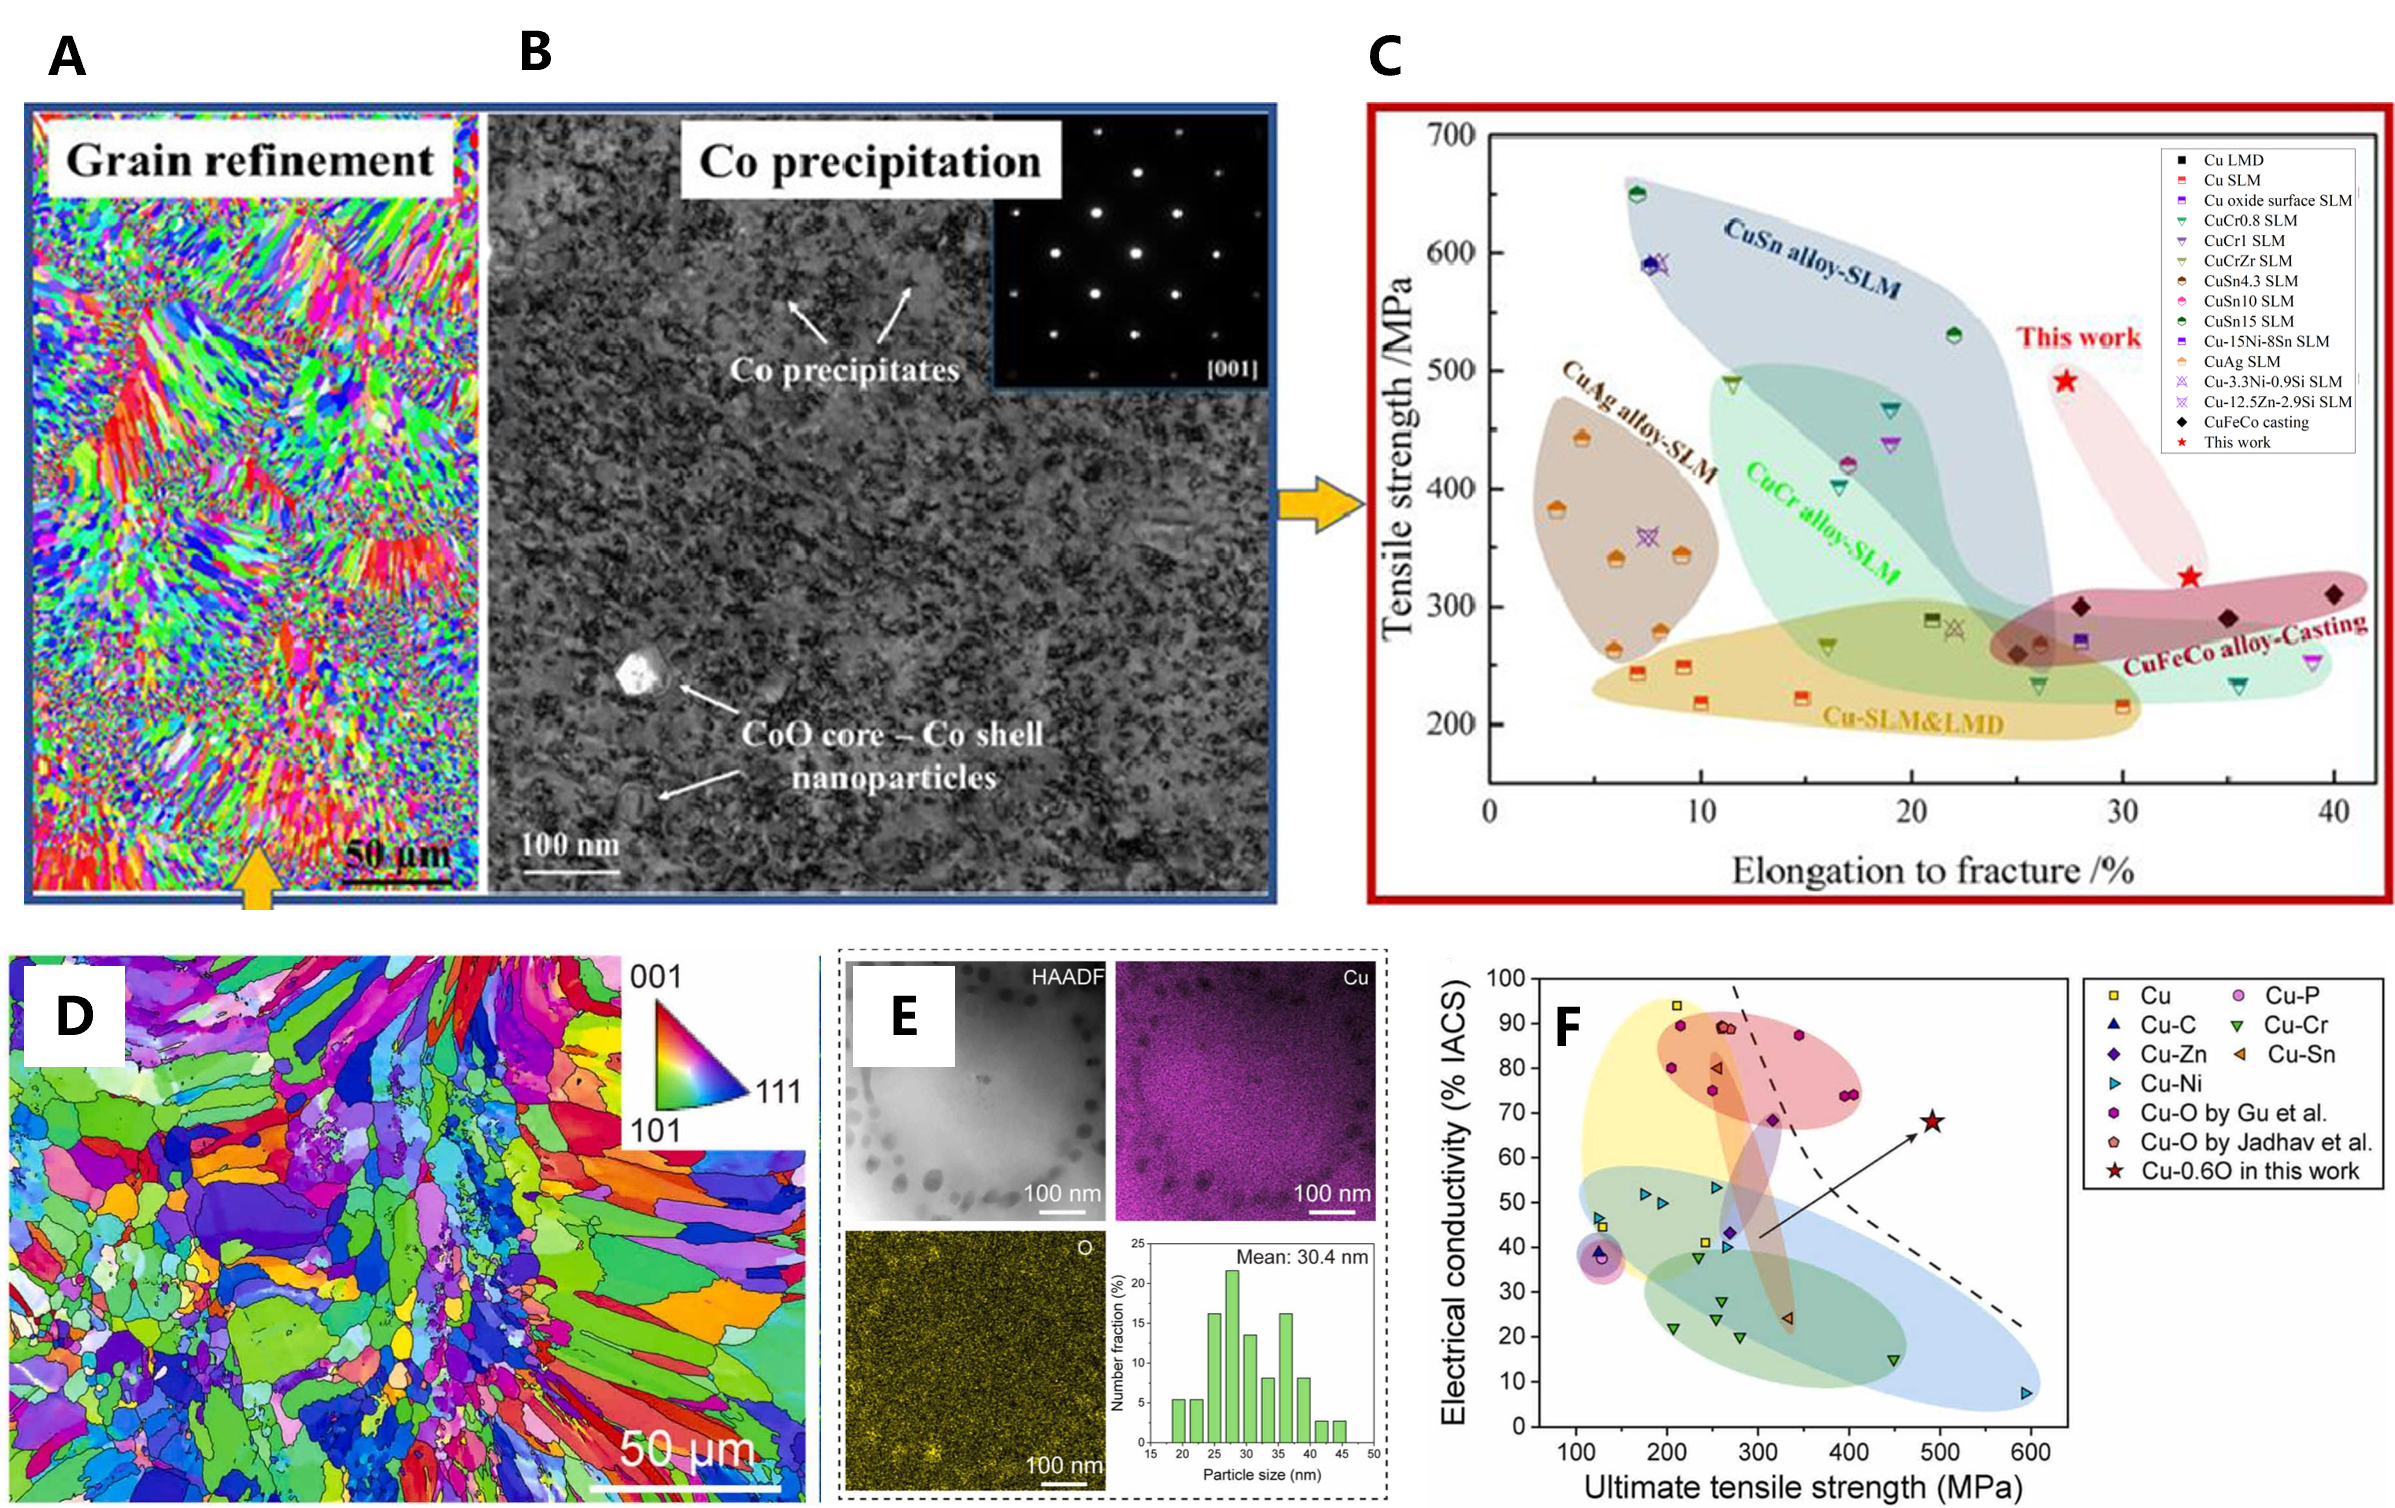
Figure 7. Grain structures and properties of the as-printed Cu alloy, (A-C) Cu-Co alloy[16] (Reprinted from Ref.[16], with permission from Elsevier); (D-F) Cu-0.6O alloy[81] (Reprinted from Ref.[81], with permission from Elsevier). (A) Inverse pole figure (IPF) maps of the L-PBF fabricated Cu-Co alloys. (B) Typical Bright-field TEM image of peak-aged sample, with selected area electron diffraction image inset. (C) Mechanical property comparison: L-PBF fabricated Cu alloy with 6 wt.% Co addition with previously published results. (D) IPF maps of the L-PBF fabricated Cu-0.6O alloy. (E) High-angle dark-field scanning transmission electron microscopy (HADDF-STEM) image and energy-dispersive spectrometry (EDS) mapping showing Cu2O nanoprecipitates at the cellular boundary. (F) The ultimate tensile strength and electrical conductivity of pure Cu and Cu alloys fabricated by L-PBF.


