


fig8
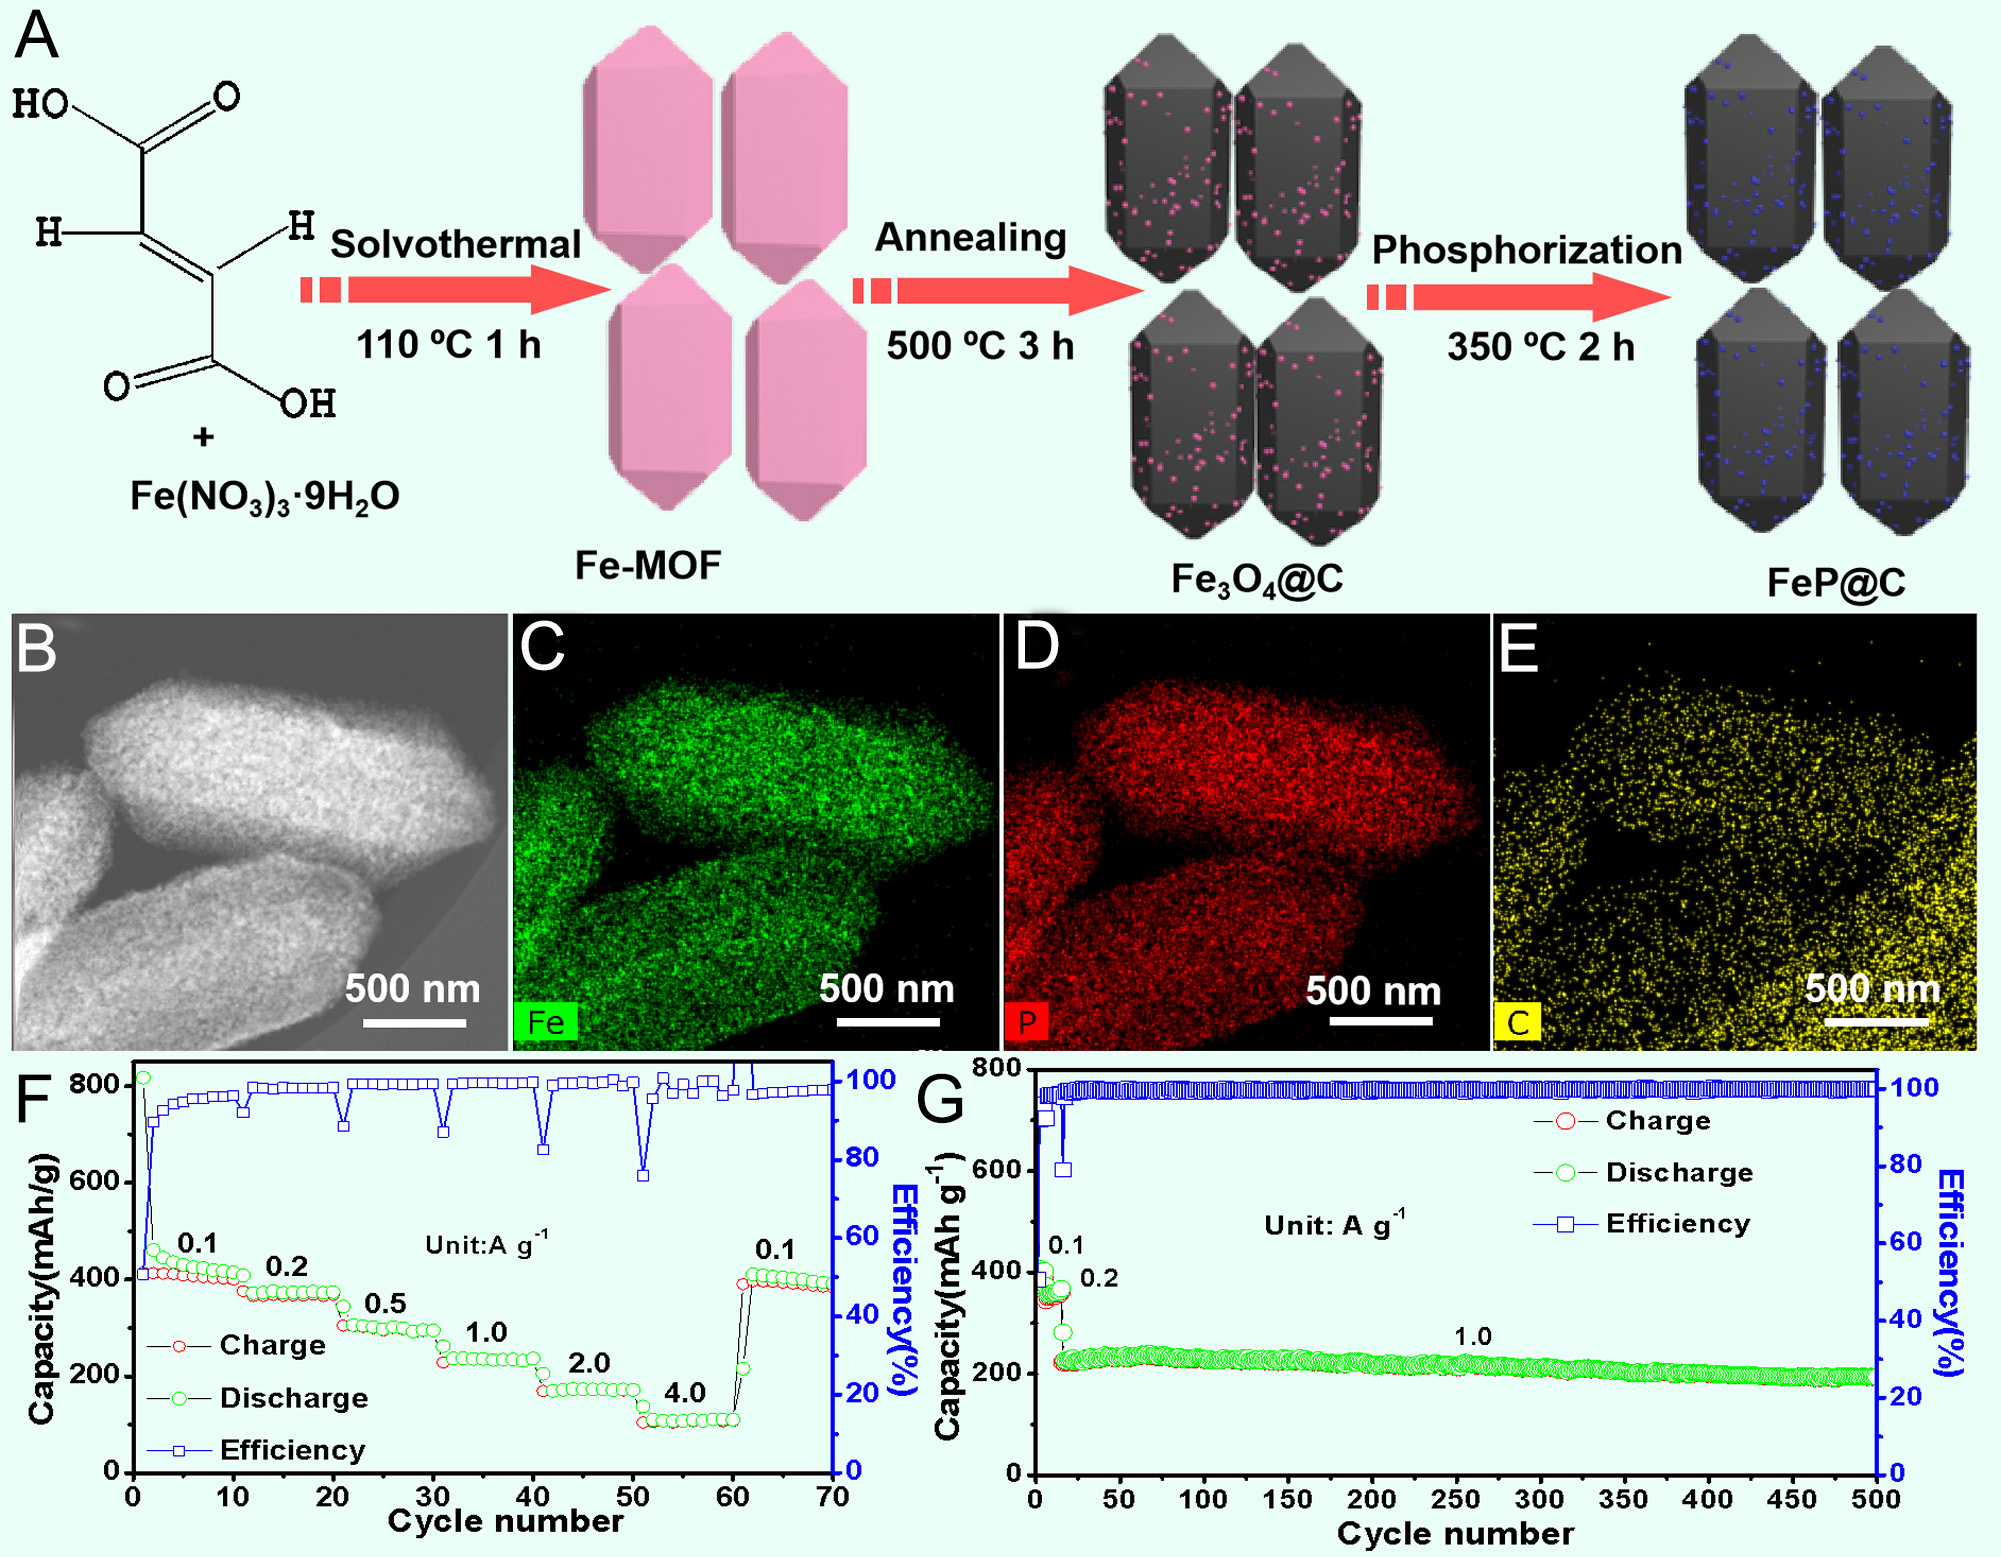
Figure 8. (A) Schematic illustration of the preparation process of FeP@C. (B) Dark-field TEM image; (C-E) corresponding EDX mapping signals of Fe (C), P (D), and C (E) elements. (F) Rate performance of FeP@C measured from 0.1 to 4.0 A g-1 and (G) cycling performance of FeP@C at 2.0 A g-1[67]. Copyright 2019, Elsevier.


