


fig3
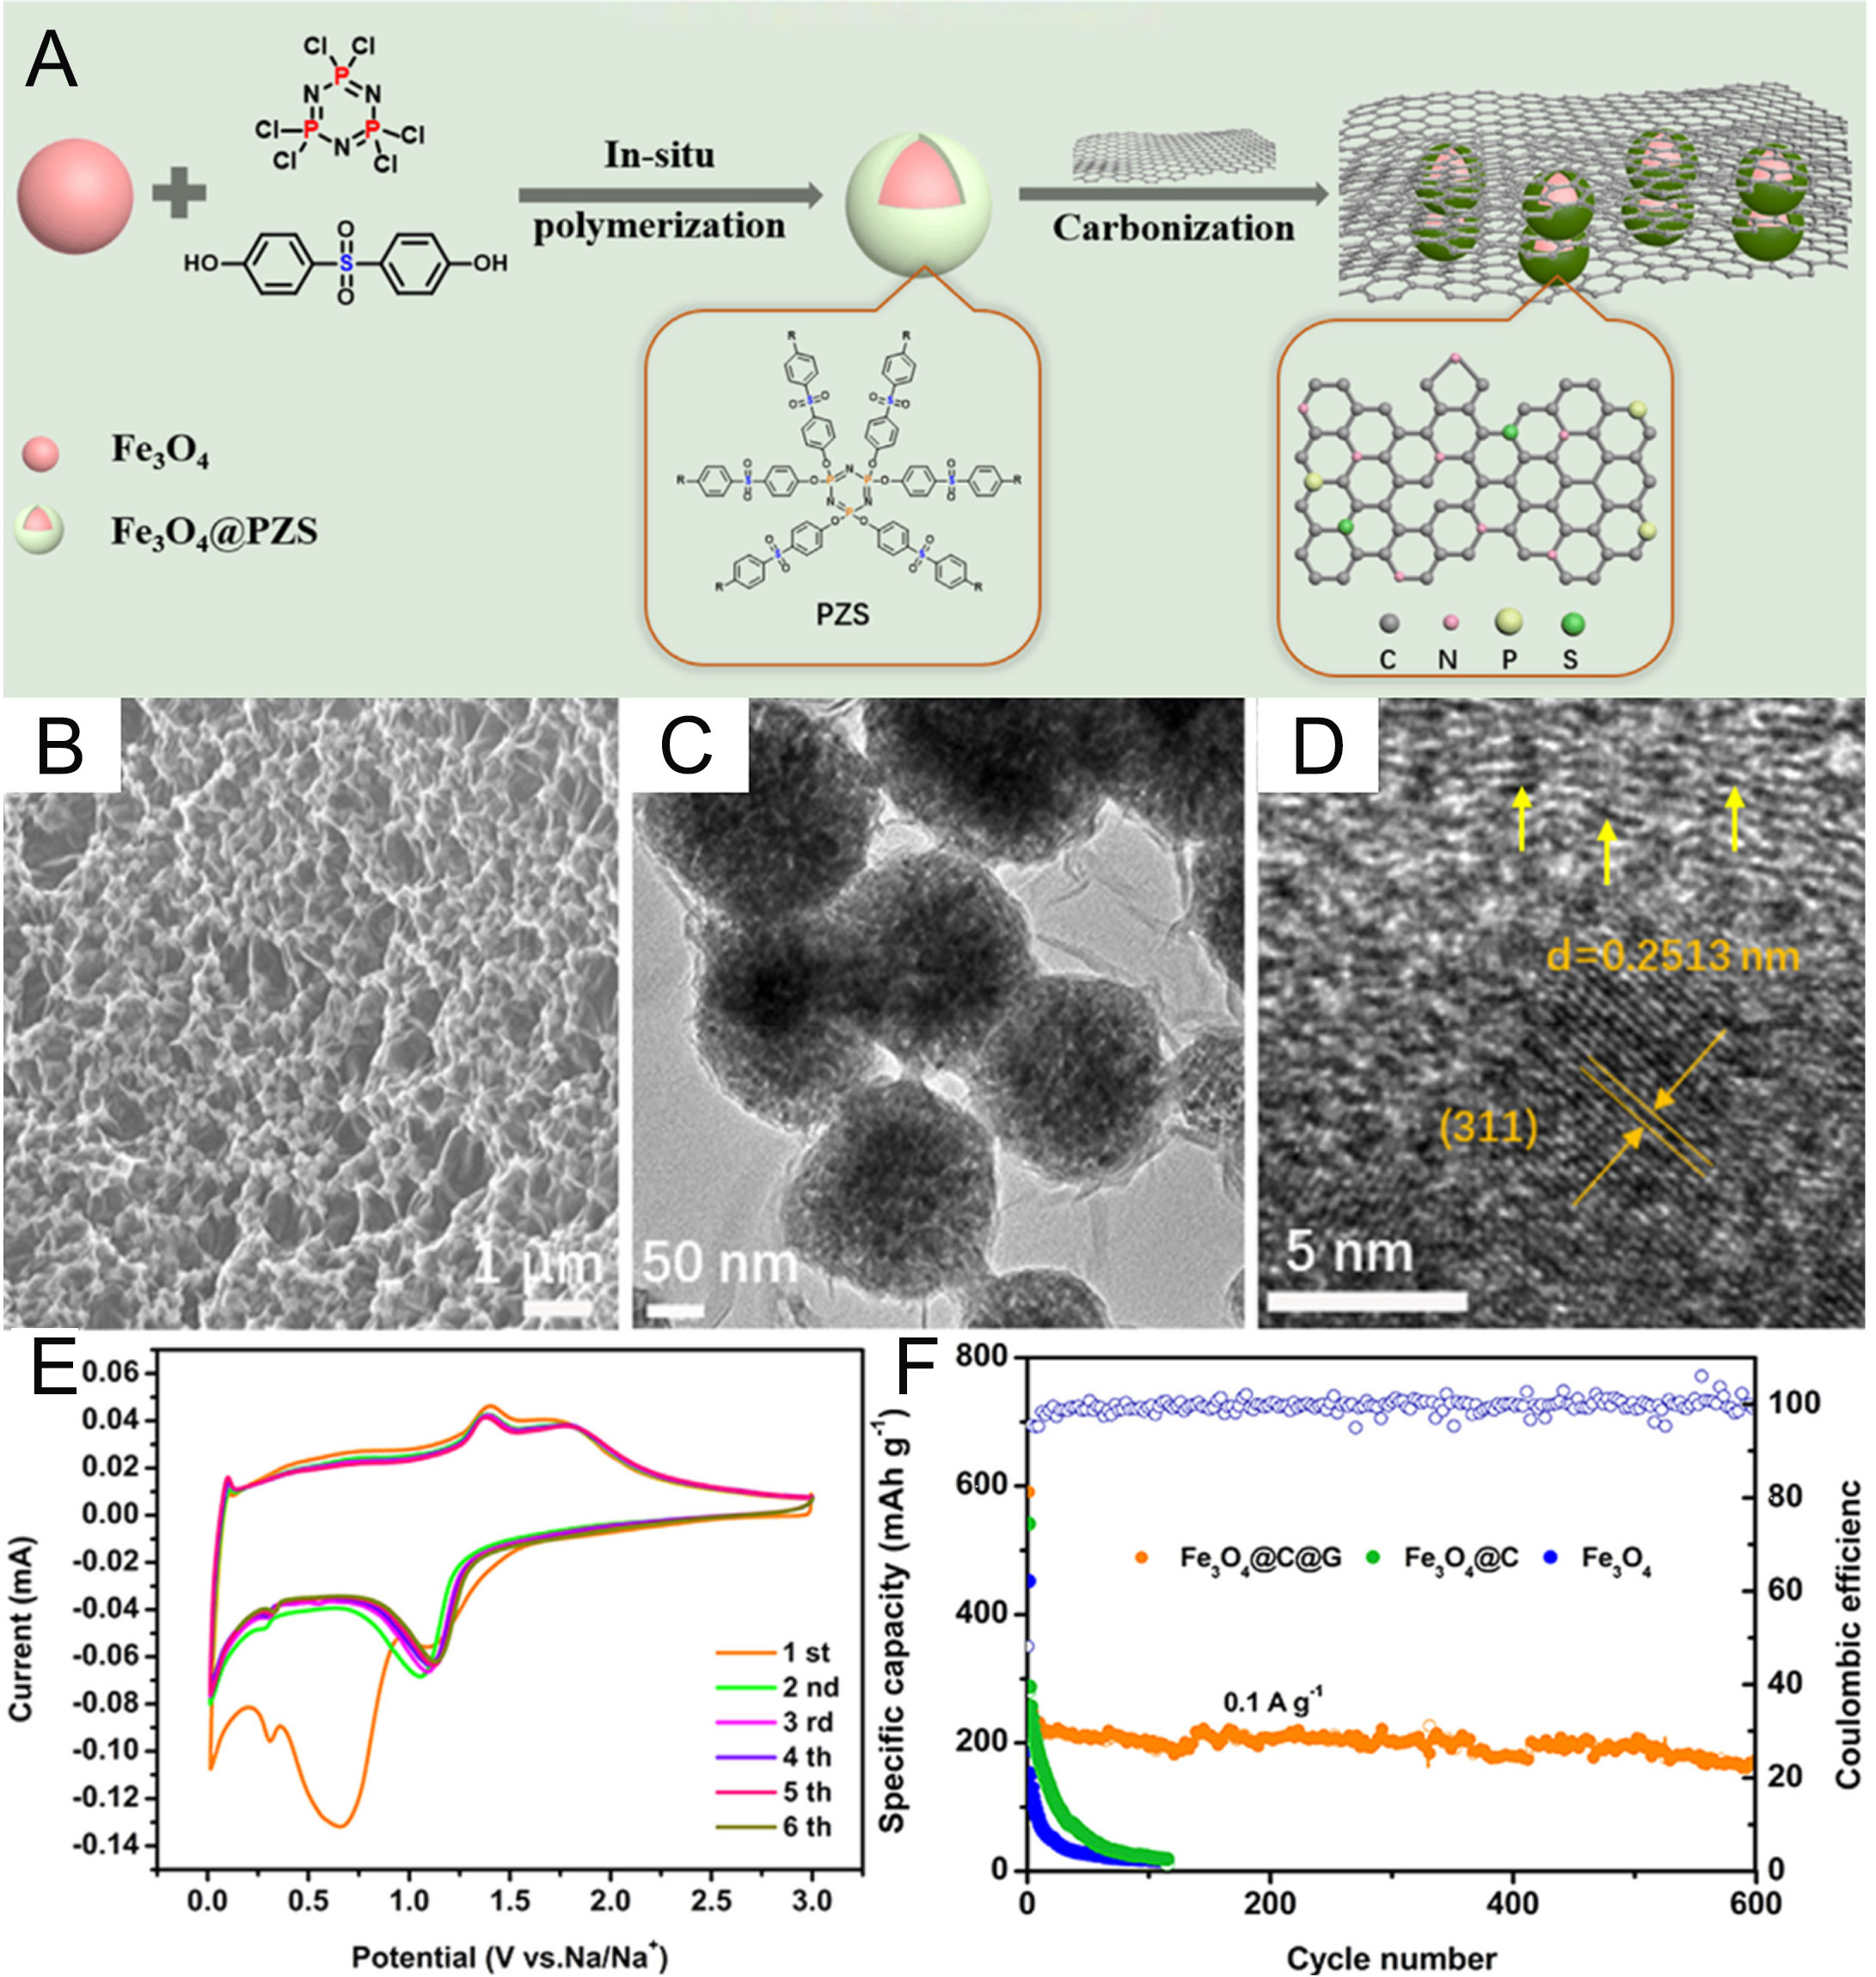
Figure 3. (A) Schematic illustration of the preparation of Fe3O4@C@G. (B) SEM, (C) TEM, and (D) HRTEM images of Fe3O4@C@G. (E) CV curves of Fe3O4@C@G; (F) Comparison of the cycling performance of Fe3O4, Fe3O4@C, and Fe3O4@C@G at 0.1 A g-1[27]. Copyright 2020, Elsevier.


