


fig8
From: Anisotropic strength and plastic deformation behavior of MAX phase Ti3AlC2 under ultrahigh pressure
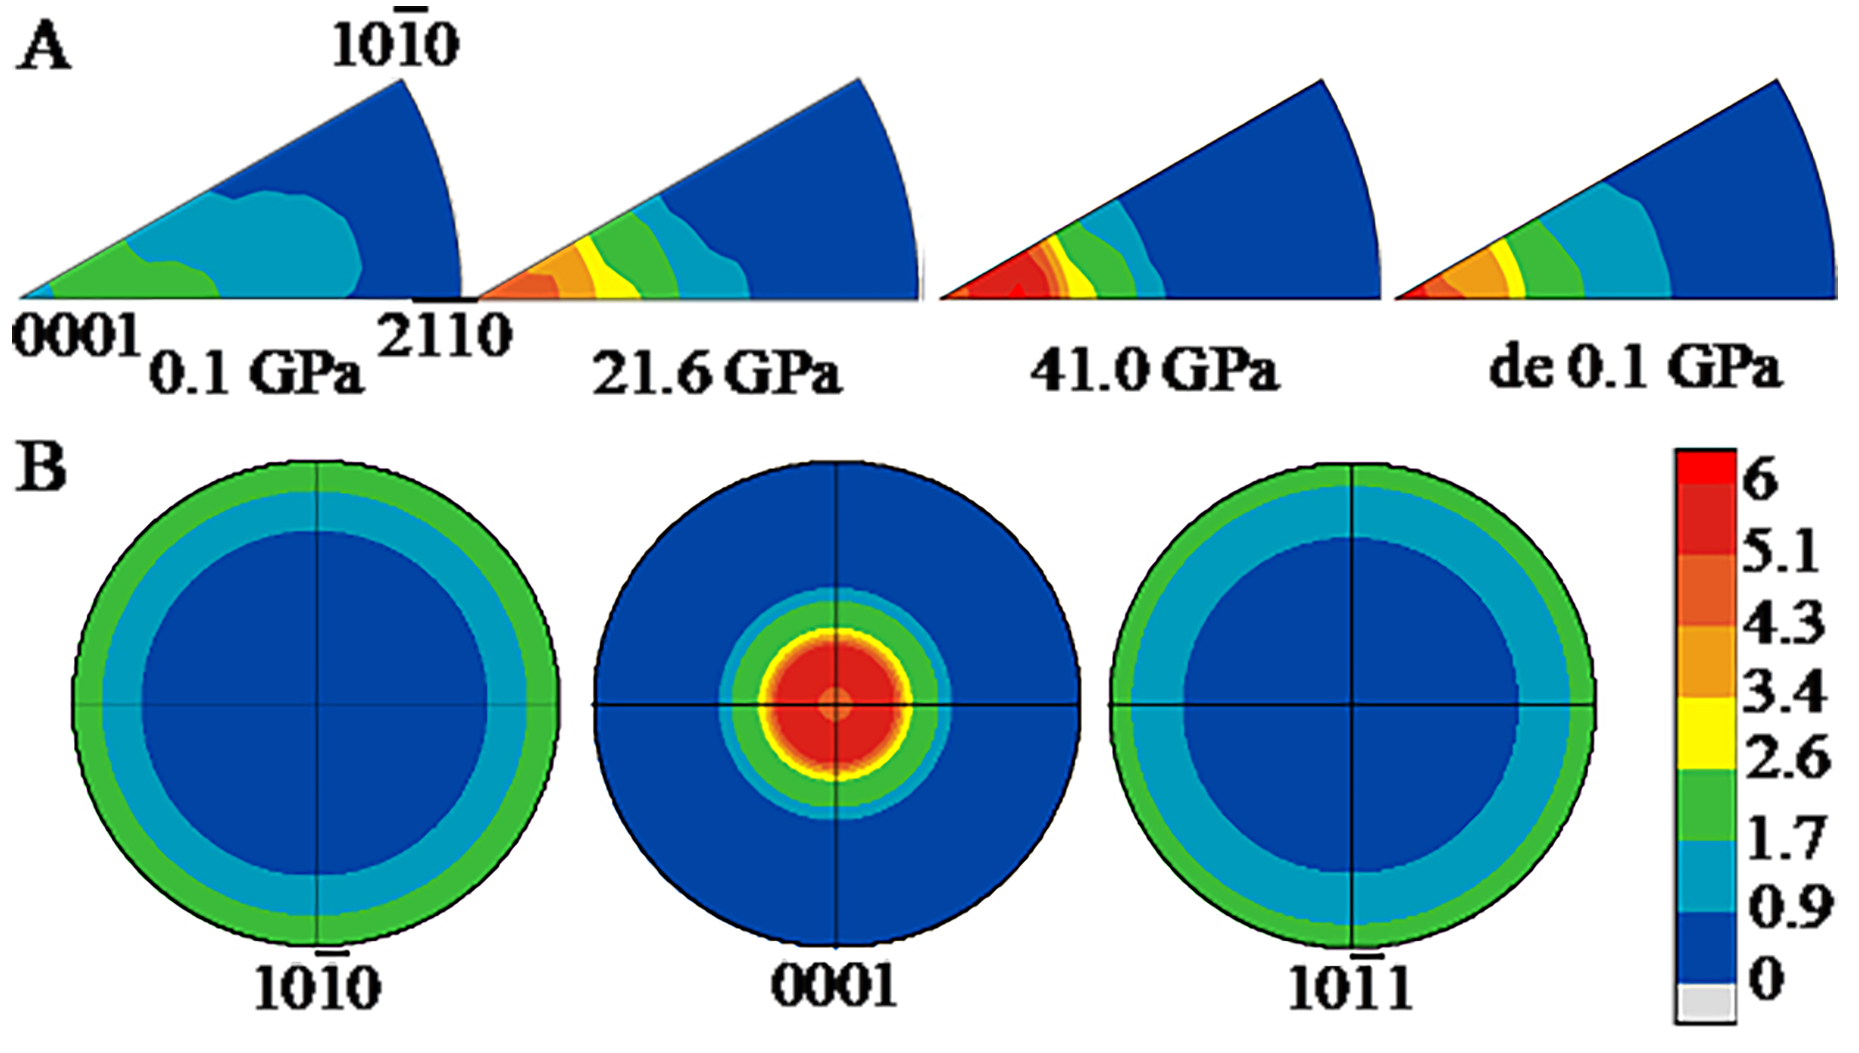
Figure 8. Texture evolution under high pressure. (A) IPFs of the compression direction showing the texture evolution of Ti3AlC2 under high pressure up to 41 GPa. For each case, the experimental pressure values are shown in the figure; (B) Selective PFs at 41 GPa. The compression direction is at the center of the PFs. Pole densities are measured in MRD. Equal area projections. IPF: inverse pole figure; PF: pole figure; MRD: multiples of a random distribution.


