


fig6
From: Anisotropic strength and plastic deformation behavior of MAX phase Ti3AlC2 under ultrahigh pressure
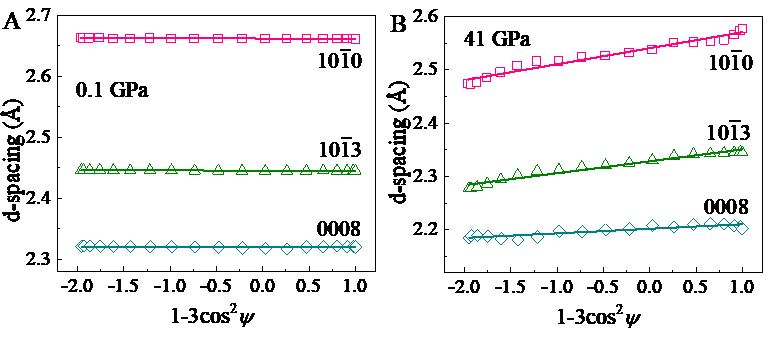
Figure 6. Dependence of measured d-spacing on 1 - 3cos2ψ. (A) 0.1 GPa, (B) 41 GPa. Data are shown for three diffraction planes of Ti3AlC2: (10-10), (10-13), and (0008). The solid lines represent linear fits to the experimental data. At 41 GPa, (10-10) shows the highest slope while (0008) shows the lowest.


