


fig4
From: Anisotropic strength and plastic deformation behavior of MAX phase Ti3AlC2 under ultrahigh pressure
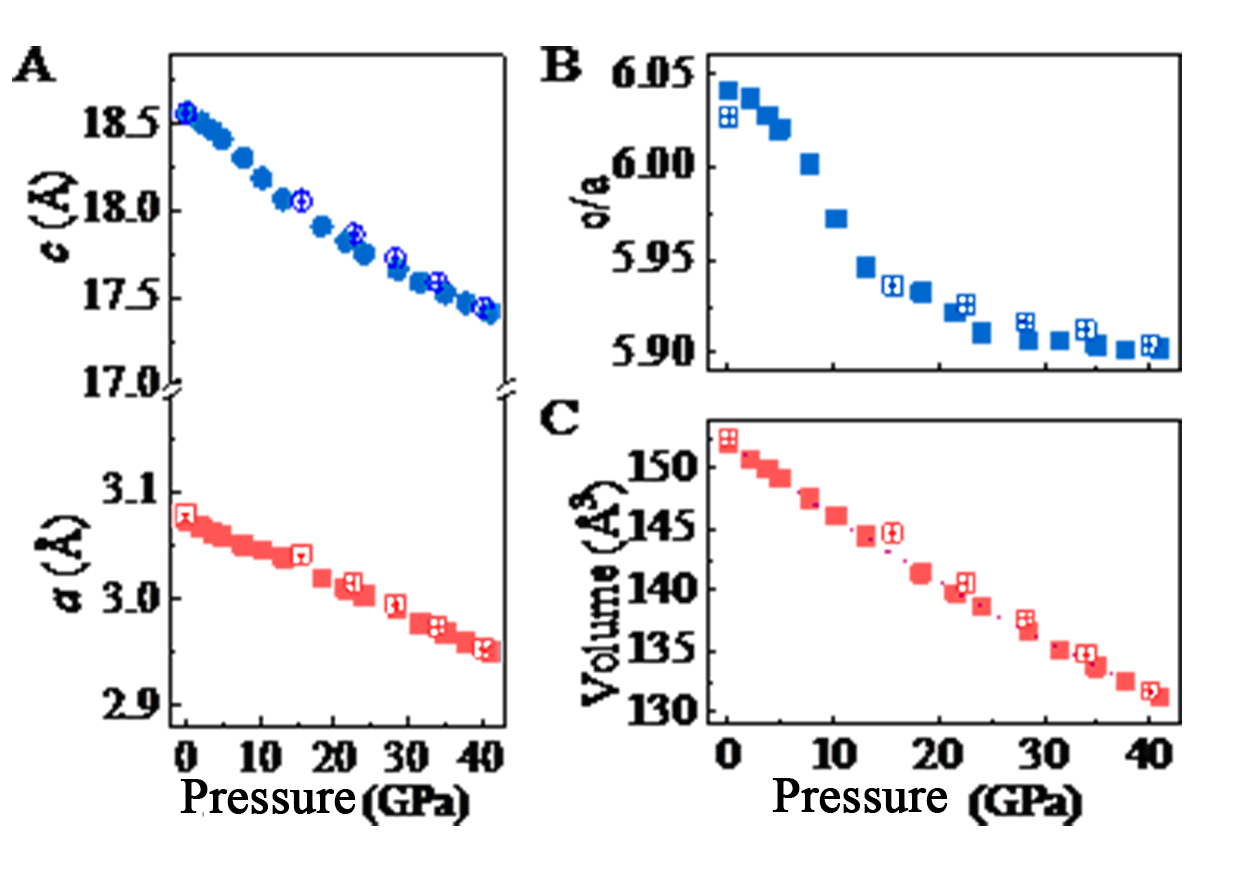
Figure 4. Structure evolution of Ti3AlC2 as a function of pressure. (A) Lattice parameters; (B) c/a ratio; (C) Unit-cell volume. In all figures, solid symbols display values obtained during the compression process and hollow symbols represent values obtained from the decompression process. The dashed line in (C) is the Birch-Murnaghan EOS fitting. The error bars, when not shown, are inside the symbol. EOS: Equation of state.


