


fig3
From: Anisotropic strength and plastic deformation behavior of MAX phase Ti3AlC2 under ultrahigh pressure
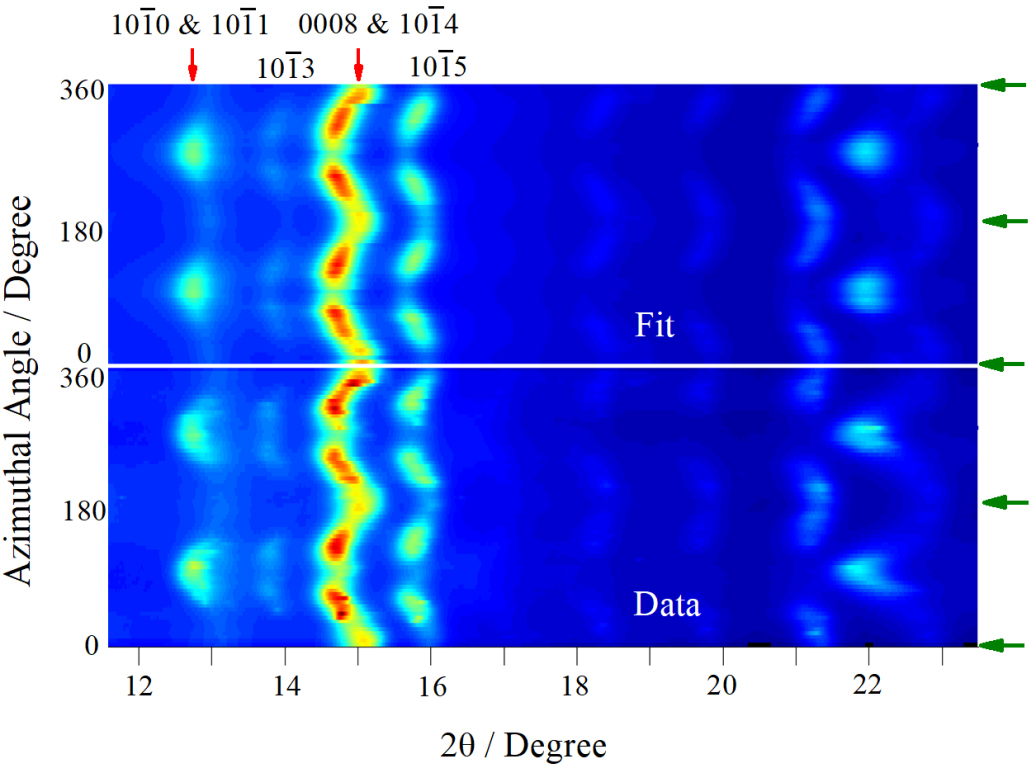
Figure 3. Fitting example of Ti3AlC2 at 41 GPa. The lower portion of the pattern shows the experimental data, while the upper portion displays the calculated pattern obtained from the Rietveld refinement. Green arrows indicate the compression direction.


