


fig2
From: Anisotropic strength and plastic deformation behavior of MAX phase Ti3AlC2 under ultrahigh pressure
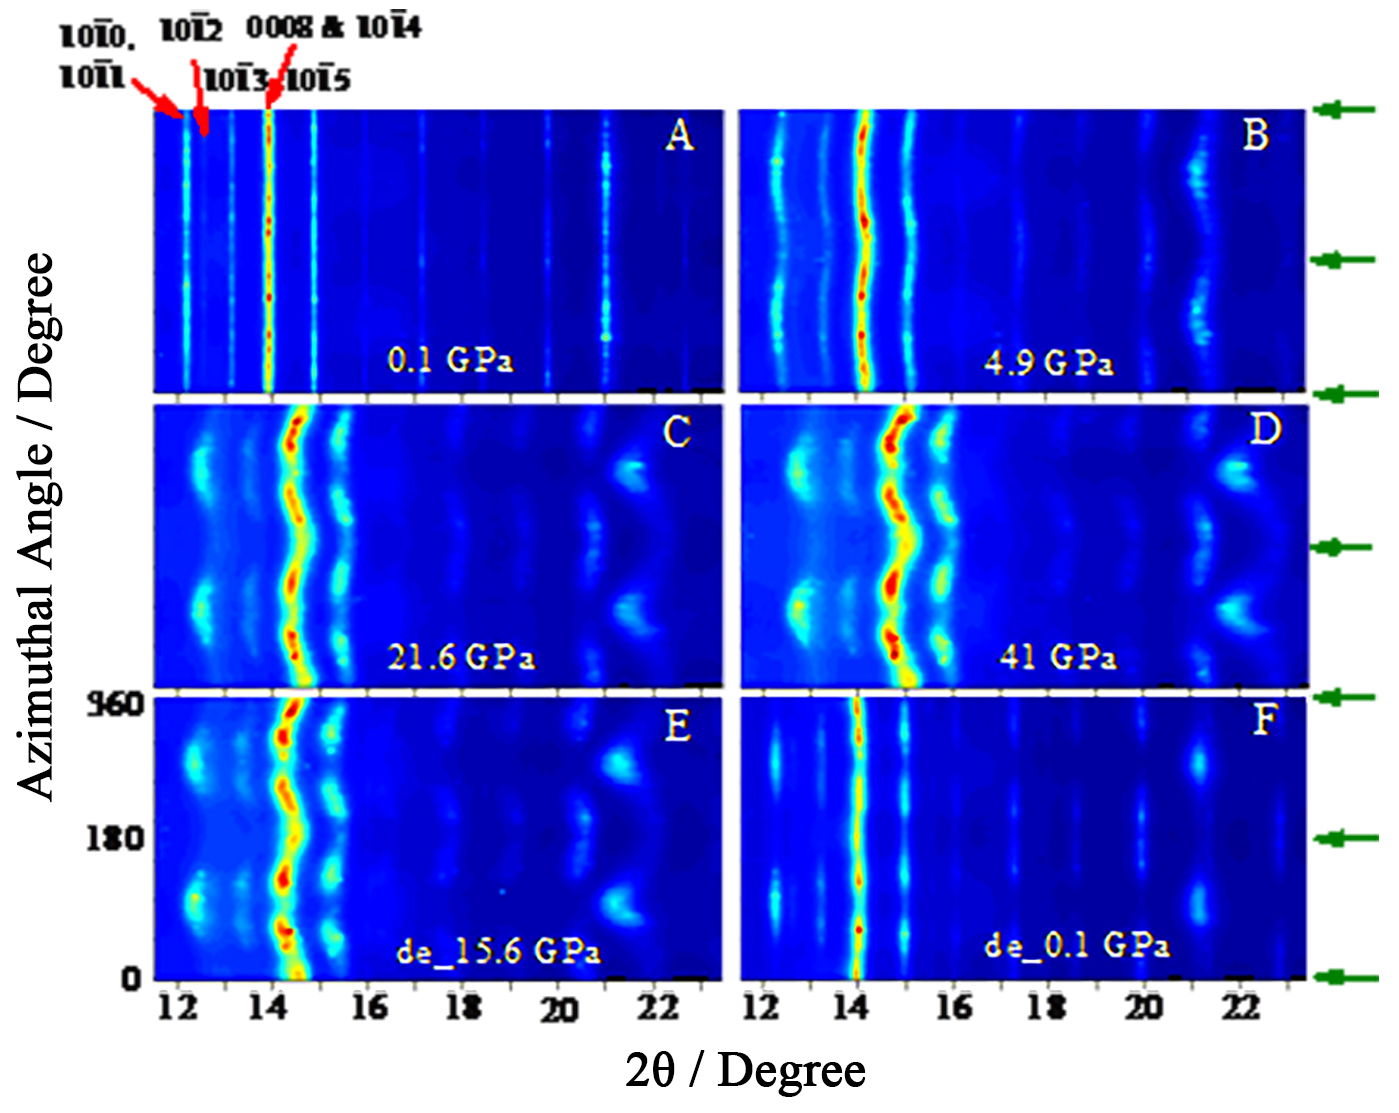
Figure 2. Unrolled diffraction patterns as a function of 2θ for the whole azimuthal range under pressure. Patterns collected during compression at 0.1 GPa (A); 4.9 GPa (B); 21.6 GPa (C); and 41 GPa (D). Patterns collected during decompression at 15.6 GPa (E) and 0.1 GPa (F). Arrows on the right show the compression direction. Major diffraction peaks are labeled.


