


fig4
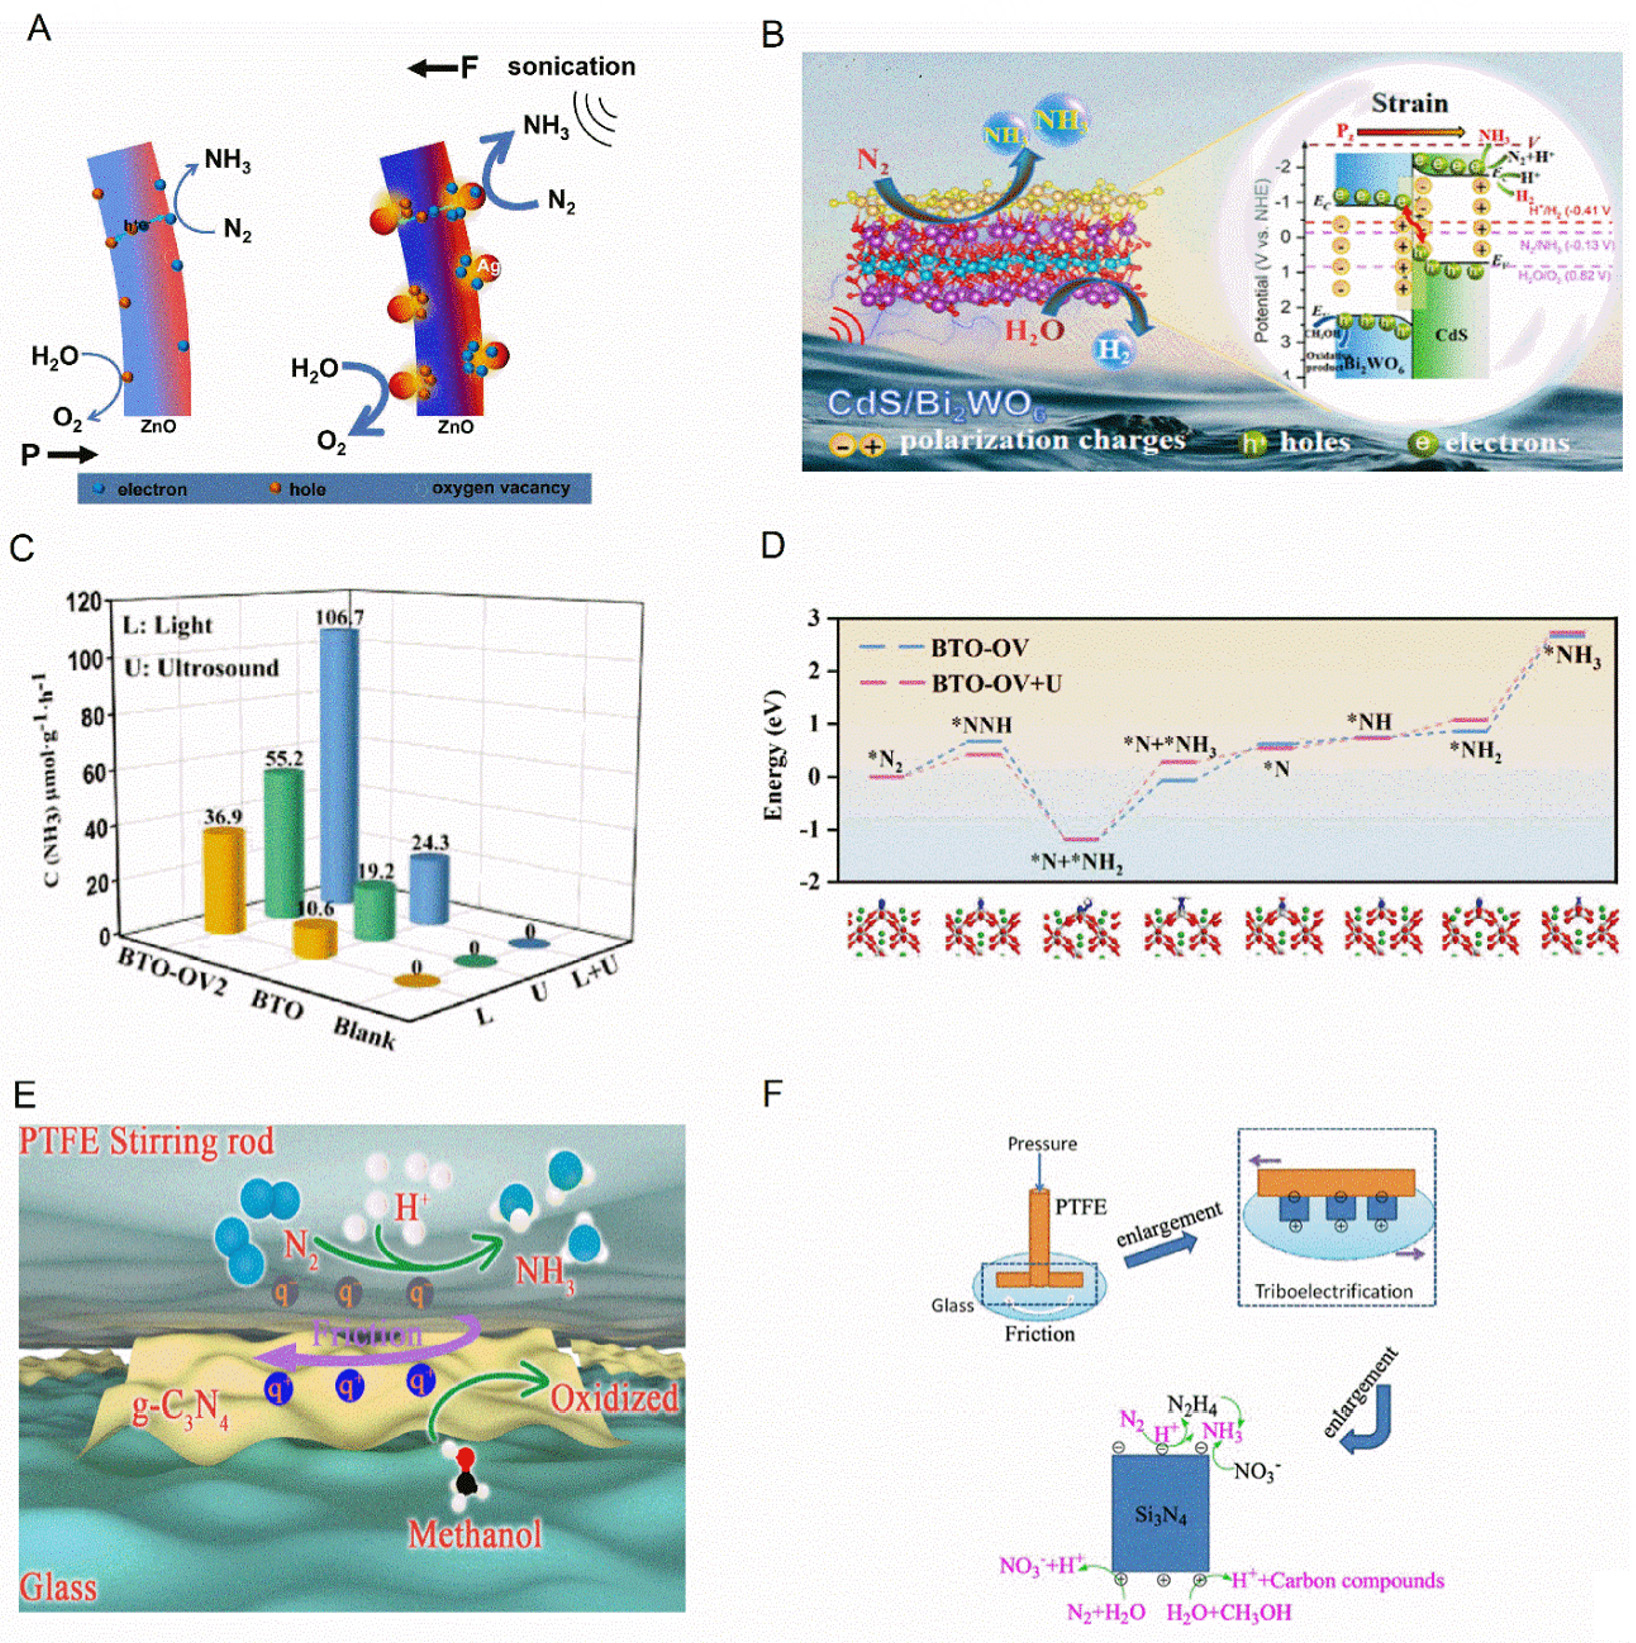
Figure 4. (A) Mechanism diagram of piezoelectric nitrogen fixation for ZnO-based catalysts. This figure is quoted with permission[100]. (B) Piezocatalytic N2 reduction for NH4+ yield versus time and schematic illustration for piezocatalytic mechanism of CdS/Bi2WO6. This figure is quoted with permission[103]. (C and D) NH3 production rate of blank, BTO, and BTO-OV under L, U, and L + U irradiation in the presence of sodium sulfide/sodium sulfite as sacrificial agent and reaction free energy diagrams of BTO-OV and BTO-OV + U. This figure is quoted with permission[105]. (E) Schematic diagram of tribocatalytic nitrogen fixation by g-C3N4. This figure is quoted with permission[106]. (F) Schematic diagram of tribocatalytic nitrogen fixation by Si3N4. This figure is quoted with permission[107].


