
fig8

Dynamic octahedral freezing and polarization rotation in lead zirconate titanate

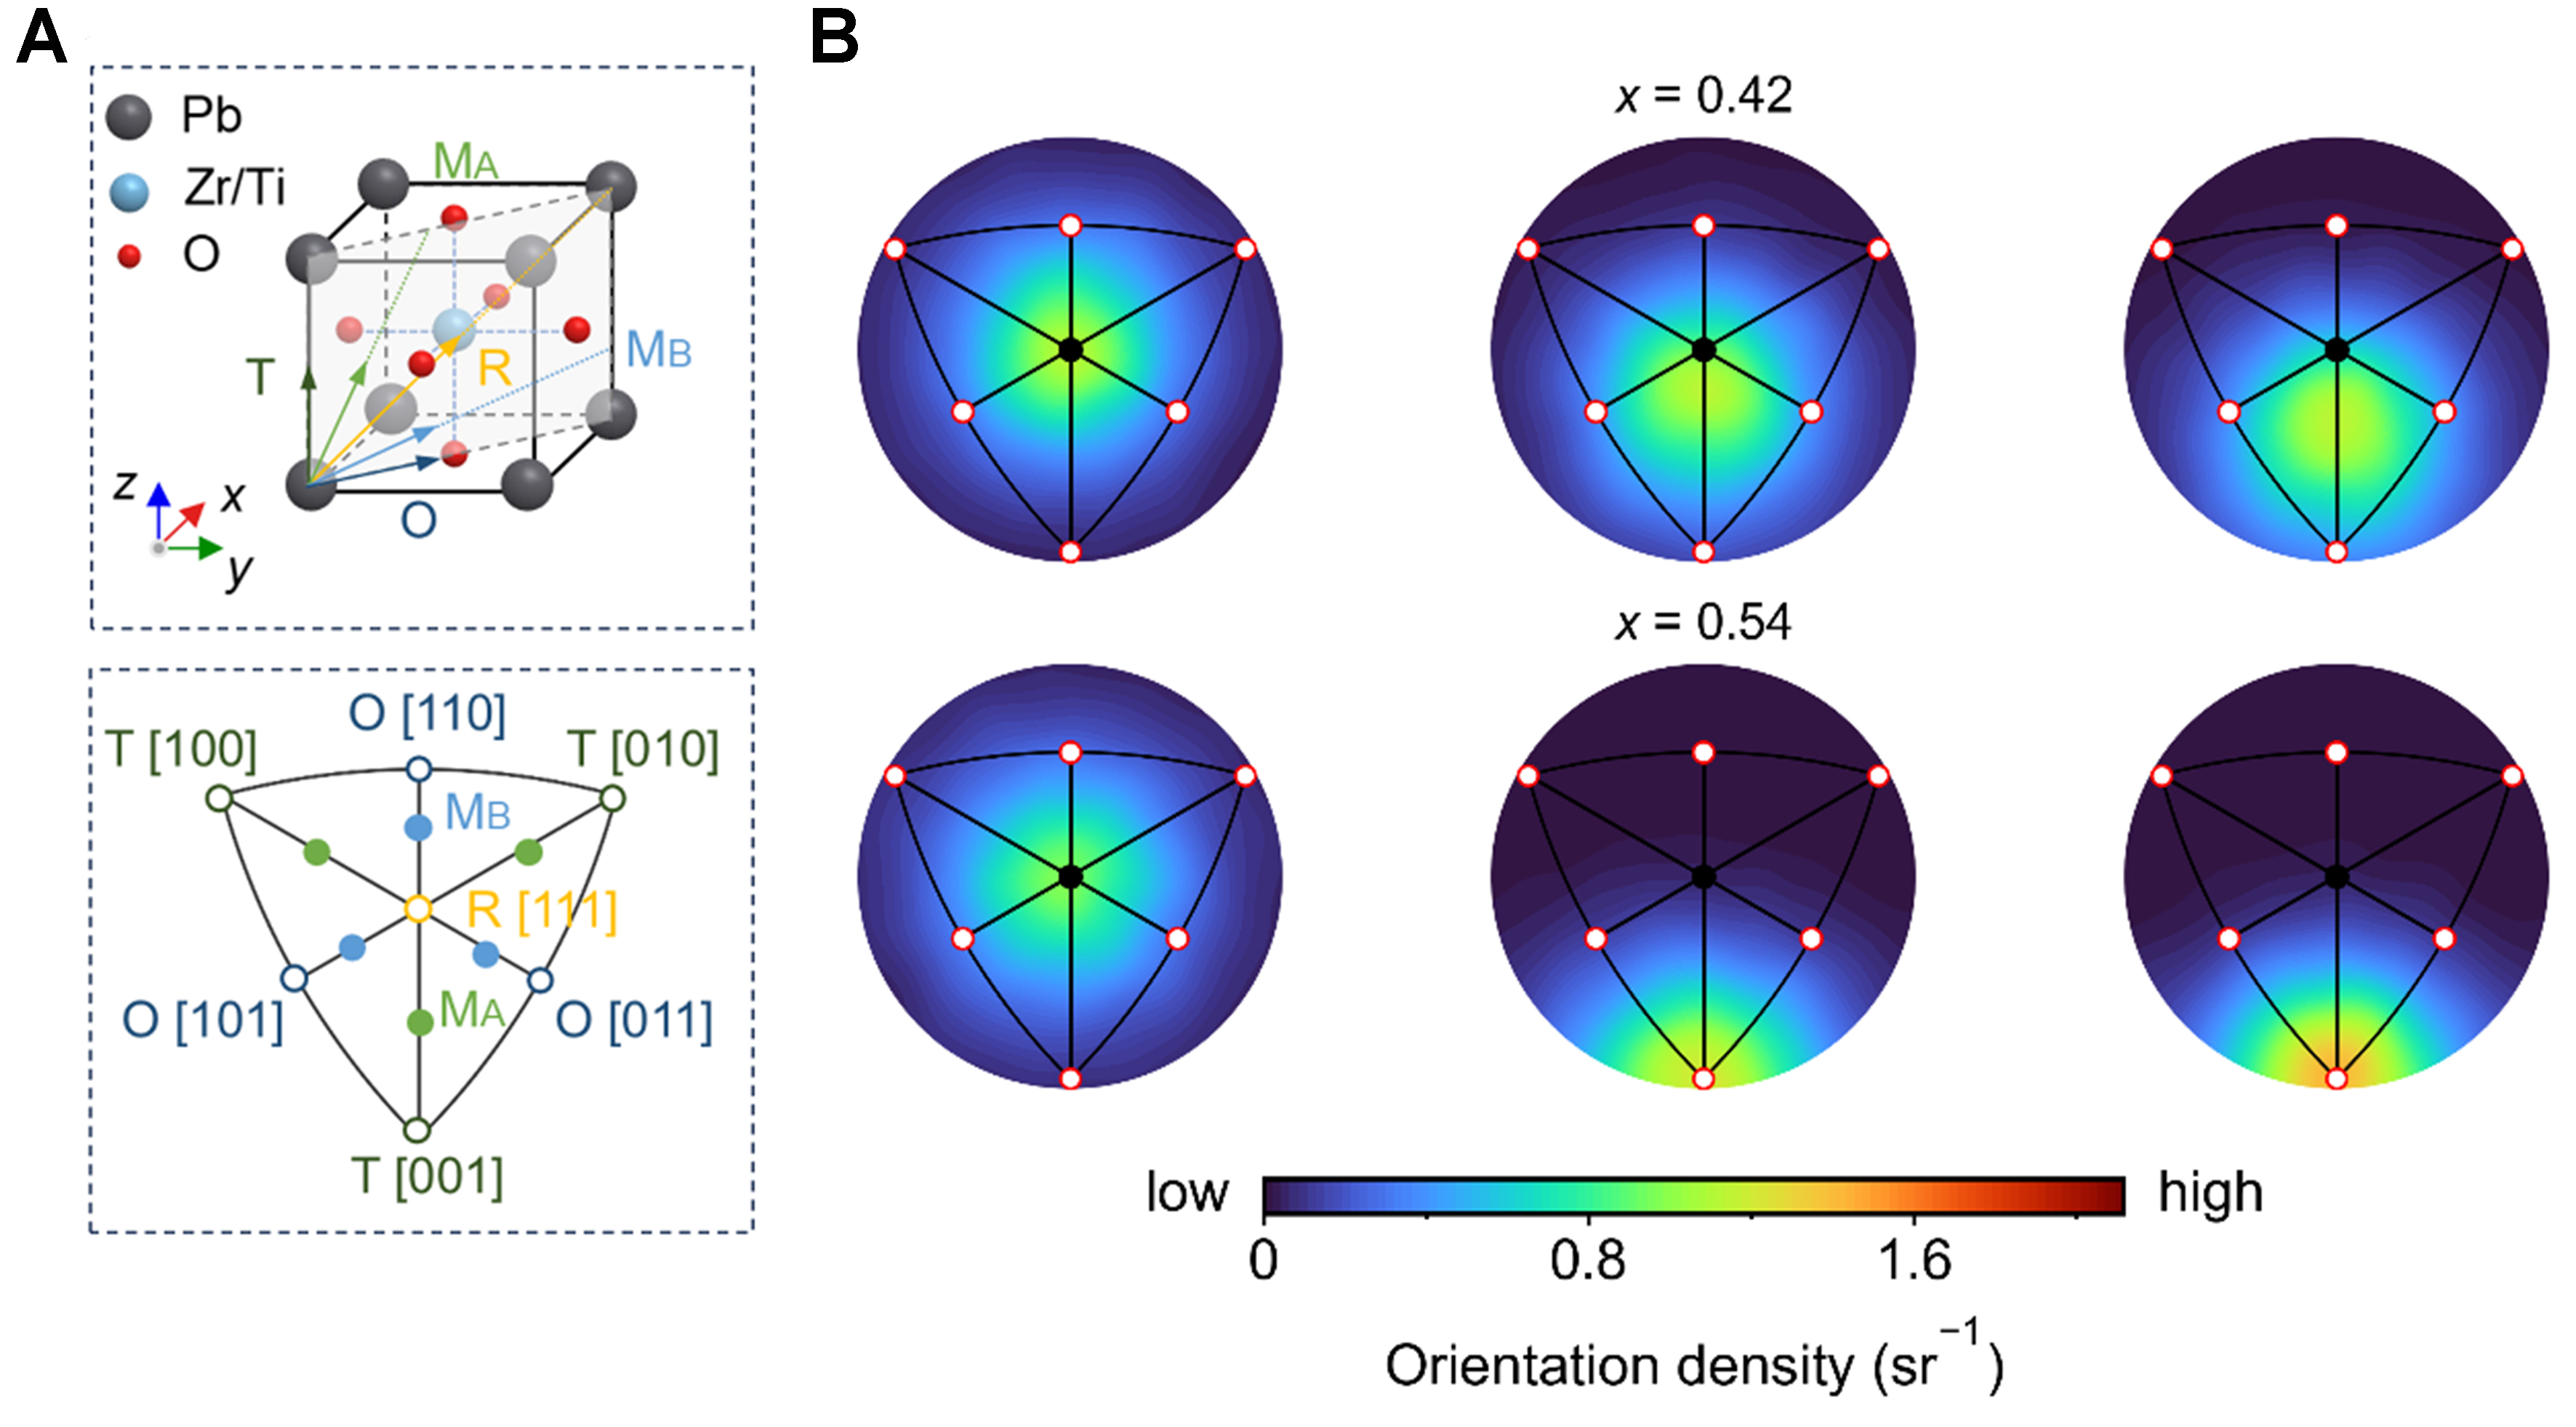
Figure 8. Evolution of Pb off-center displacement directions under an applied electric field. (A) Top, schematic illustration of Pb off-center displacement vectors within the (1$$ \bar{1} $$0)p plane, showing characteristic T-like ([001]p), R-like ([111]p), O-like ([110]p), MA-like (between R and T) and MB-like (between R and O) orientations. Bottom, stereographic representation of these orientations and their symmetry-equivalent directions, viewed along [111]p. These labels denote displacement orientations rather than crystallographically identified phases; (B) Orientational probability density maps of the instantaneous Pb off-center displacement vectors for x = 0.42 (top row), and x = 0.54 (bottom row) at 300 K. Columns correspond to electric fields of 0, 100 and 300 kV/cm, applied along [001]p. Each distribution includes all Pb sites in the final equilibrated frame at the corresponding field strength, without temporal averaging. Probability densities are estimated on the unit sphere using spherical kernel density estimation and displayed by stereographic projection. Colors represent probability density per unit solid angle (sr-1), rather than per unit projected area.