
fig7
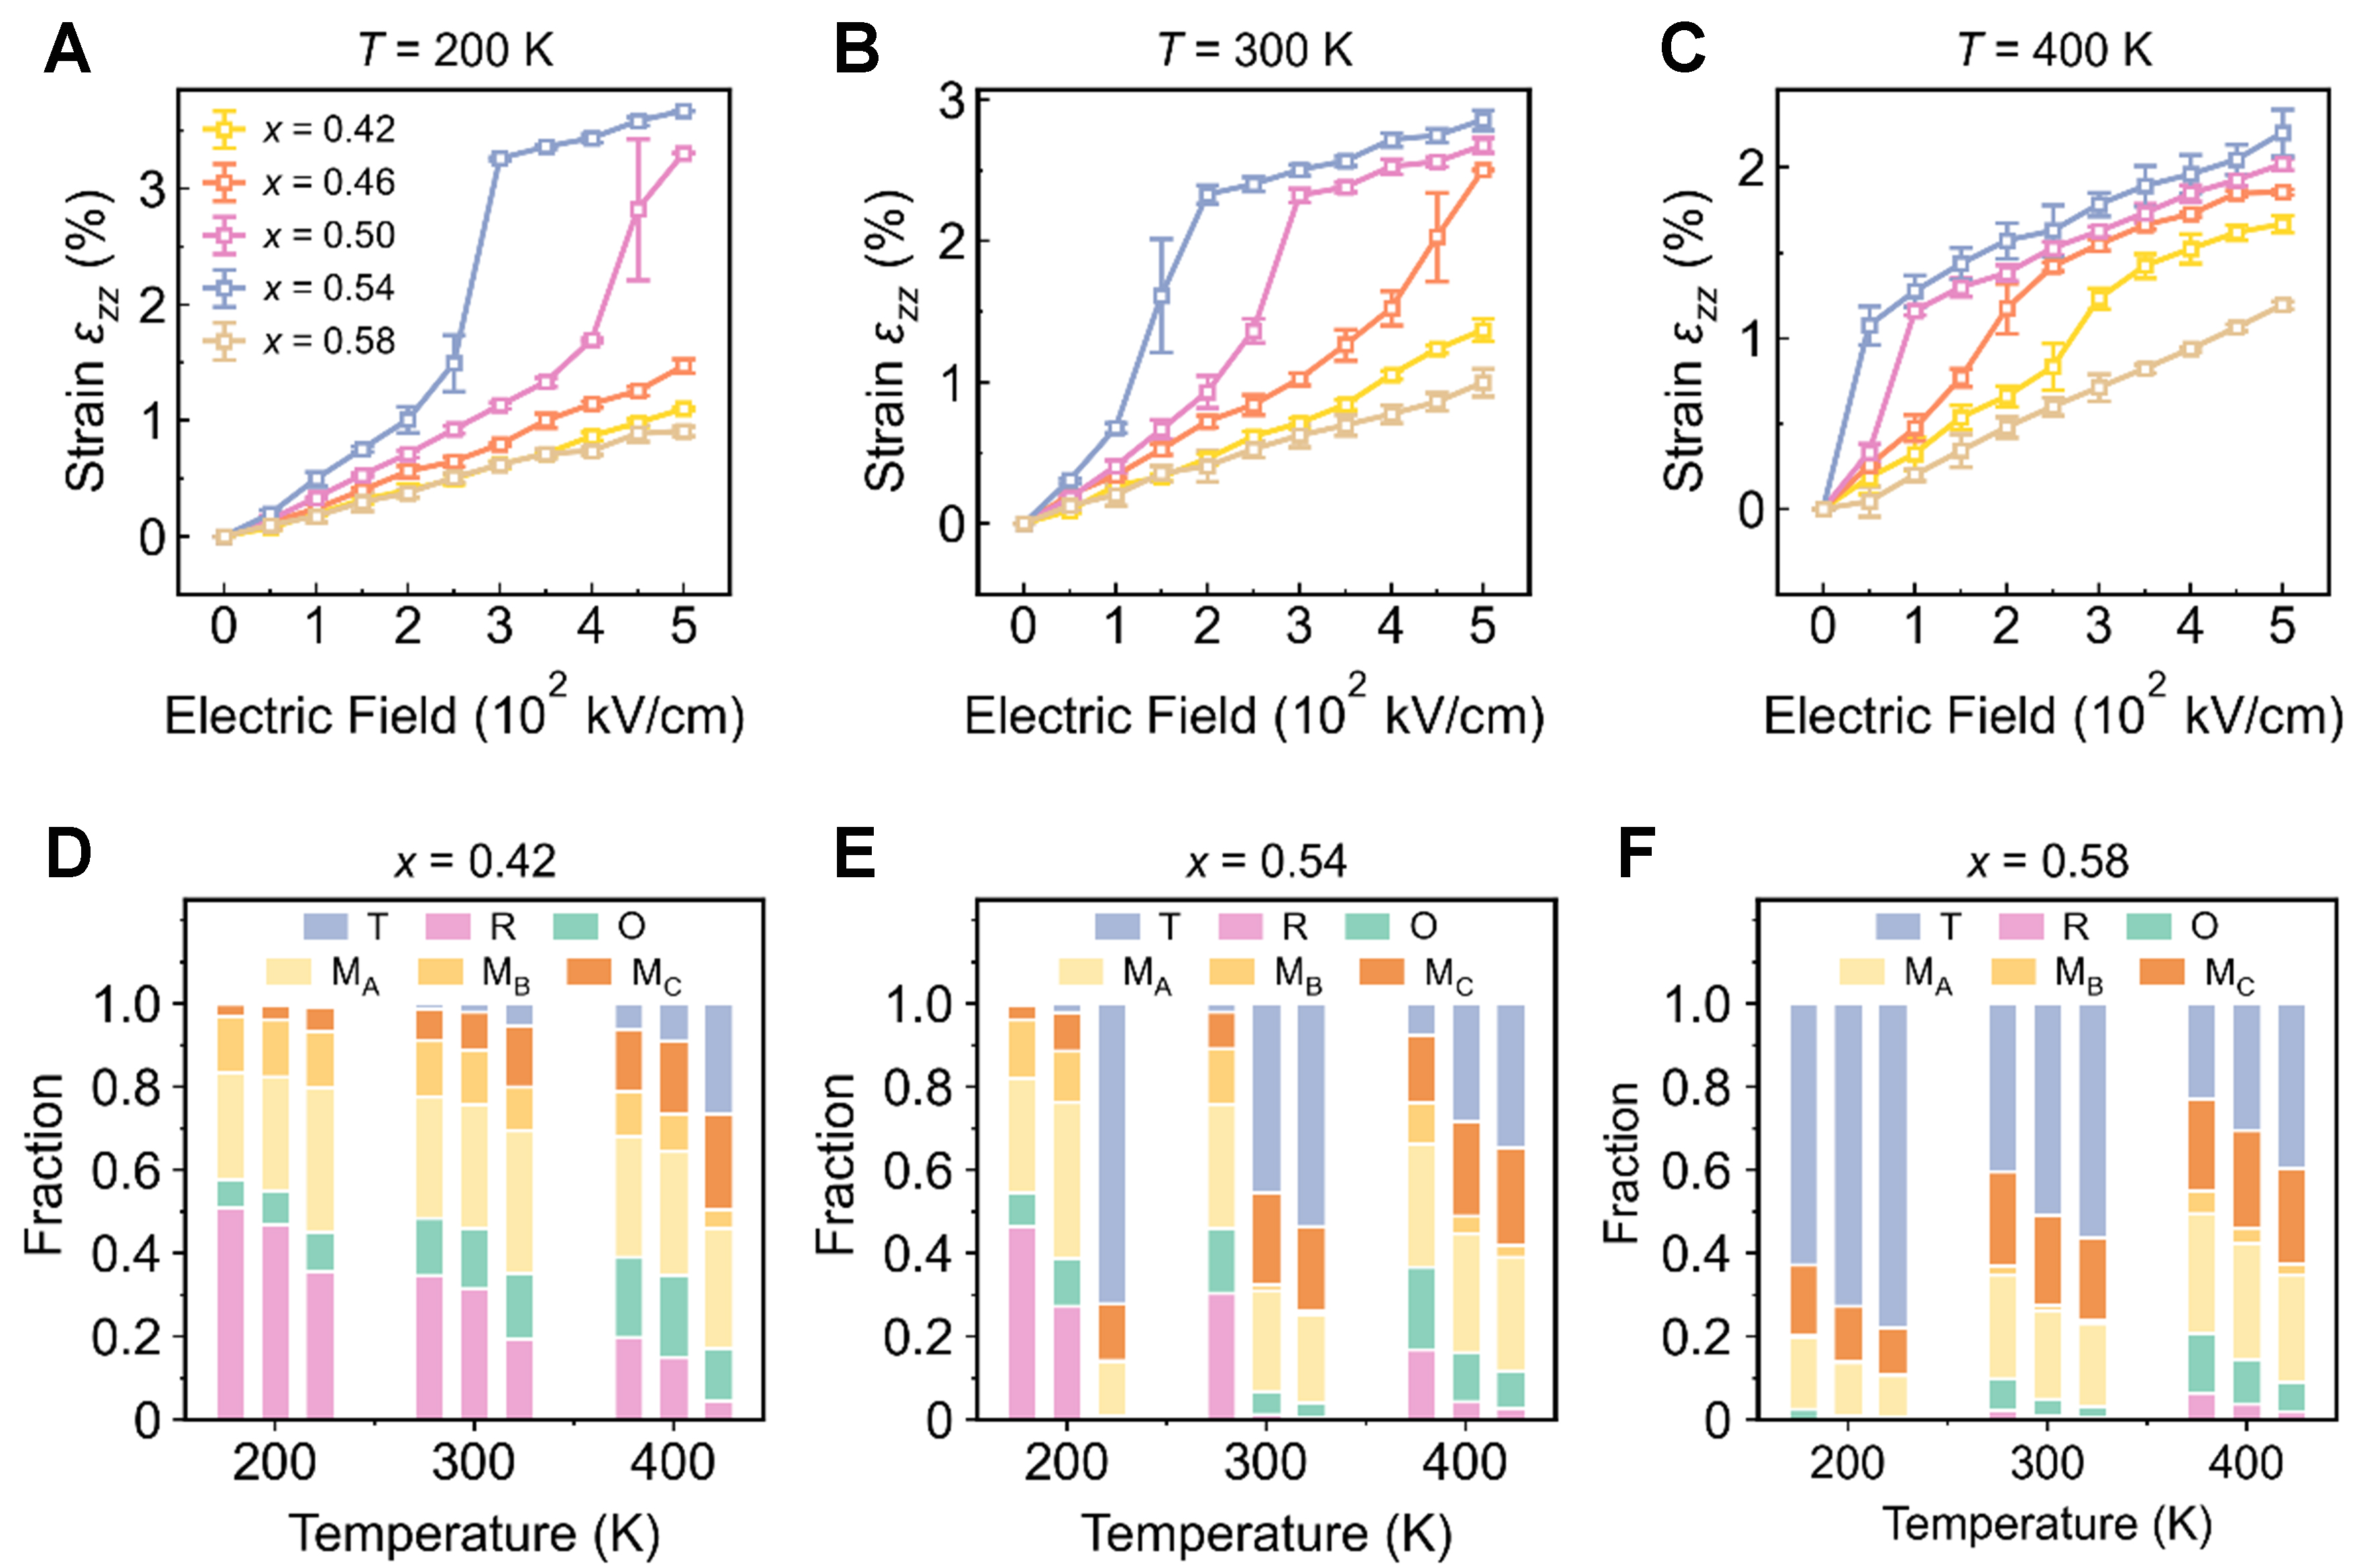
Figure 7. Electric-field-induced strain response and evolution of local polar configurations in PZT. (A-C) Electric-field dependence of the longitudinal strain εzz for different PZT compositions under an electric field applied along the z direction ([001]p) at (A) 200 K, (B) 300 K and (C) 400 K. The color–composition mapping is defined in panel (A); lines in panels (B) and (C) follow the same color scheme. All strain data are extracted from the final equilibrated snapshots after structural relaxation at each electric field. Error bars represent the standard deviation computed from three independent simulation replicas; (D-F) Fractions of local polar configurations classified as T-, R-, O-, MA-, MB- and MC-like according to their instantaneous local polarization directions for (D) x = 0.42, (E) x = 0.54 and (F) x = 0.58. The classification uses an angular tolerance of 15° and assigns each classified configuration to a single category (Methods). These labels describe local polarization orientations rather than crystallographically identified phases. At each temperature, the three bars correspond, from left to right, to electric fields of 0, 200 and 400 kV/cm. PZT: Lead zirconate titanate.