
fig6
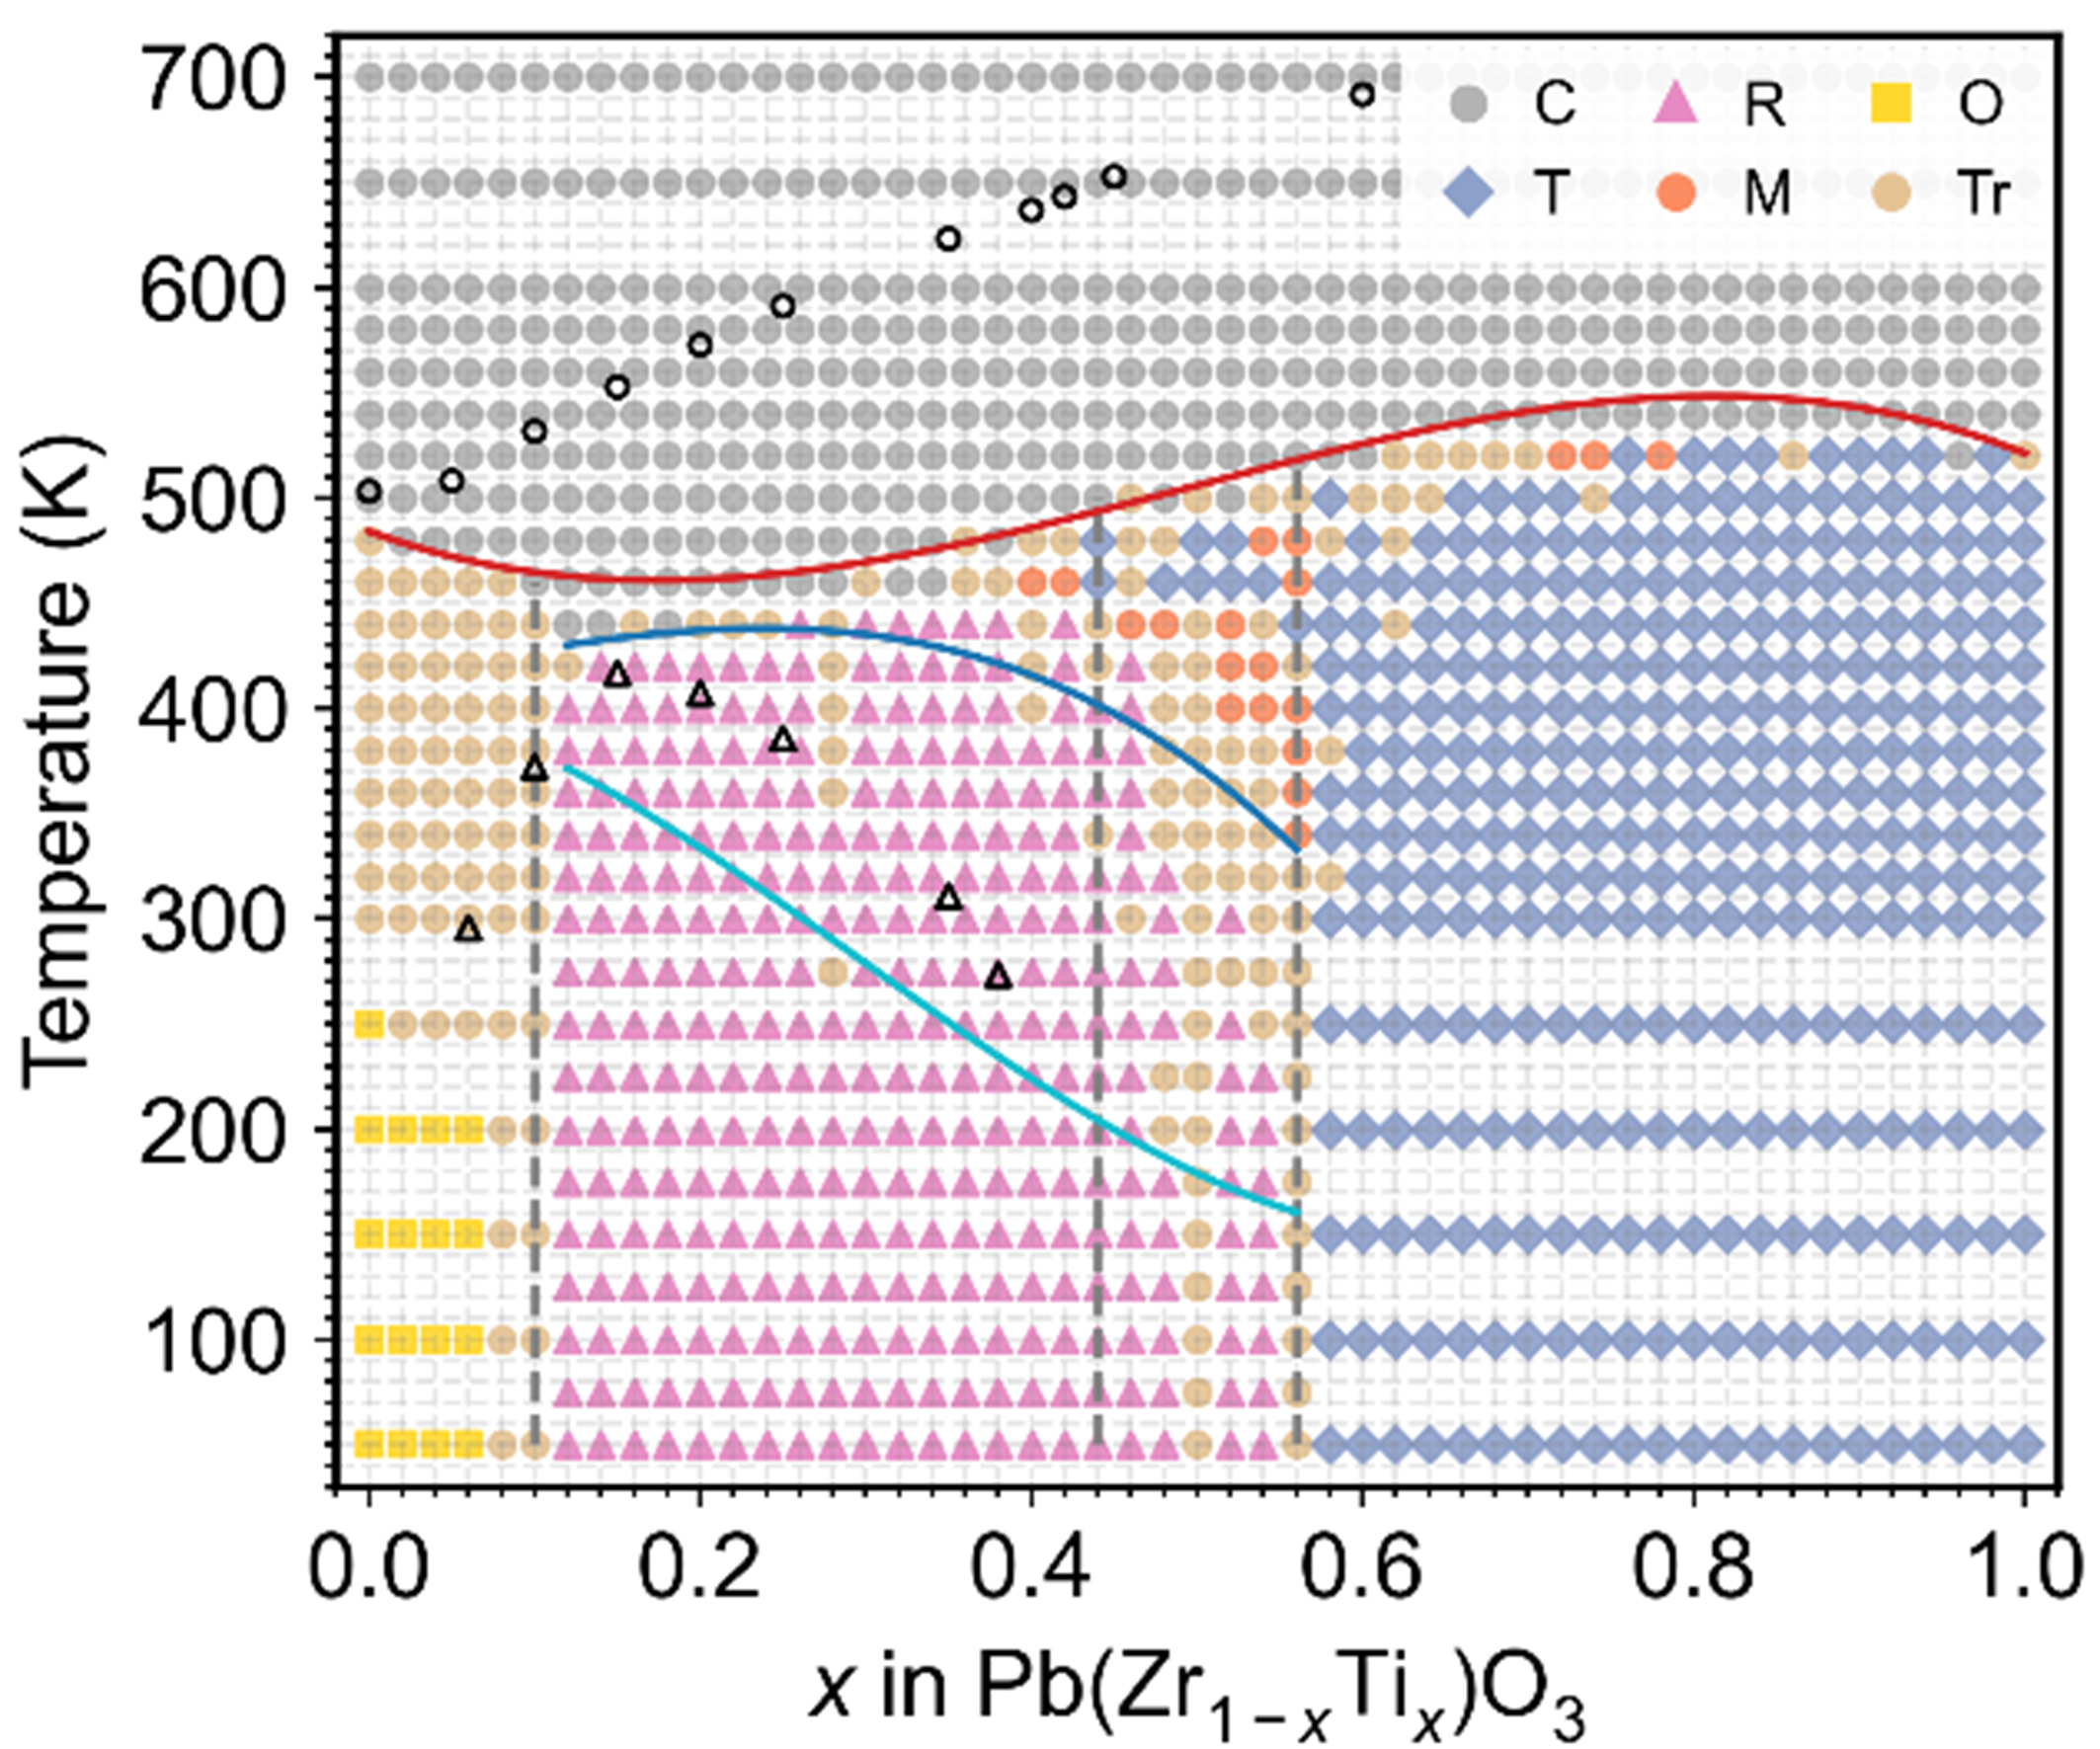
Figure 6. Temperature–composition phase diagram of PZT predicted by the NEP. The phase at each temperature and composition is assigned from the lattice parameters and macroscopic polarization averaged over the equilibrated MD trajectories, with different colors denoting distinct average structural symmetries or transition regions. The phase labels correspond to cubic (C), tetragonal (T), rhombohedral (R), orthorhombic (O), monoclinic (M), and transition regions (Tr). Three vertical black dashed lines divide the phase diagram into four composition regions: orthorhombic, rhombohedral, MPB and tetragonal regions with increasing Ti content. The dark-blue line and light-blue line mark the characteristic temperatures TR1 and TR2, respectively. Open black diamonds denote the experimentally reported R3m–R3c boundary[13]. The red line marks the simulated transition temperature between the paraelectric cubic phase and the low-symmetry phases, and open black squares denote the corresponding experimental transition temperatures[13]. PZT: Lead zirconate titanate; NEP: neuroevolution potential; MD: molecular dynamics; MPB: morphotropic phase boundary.