
fig10
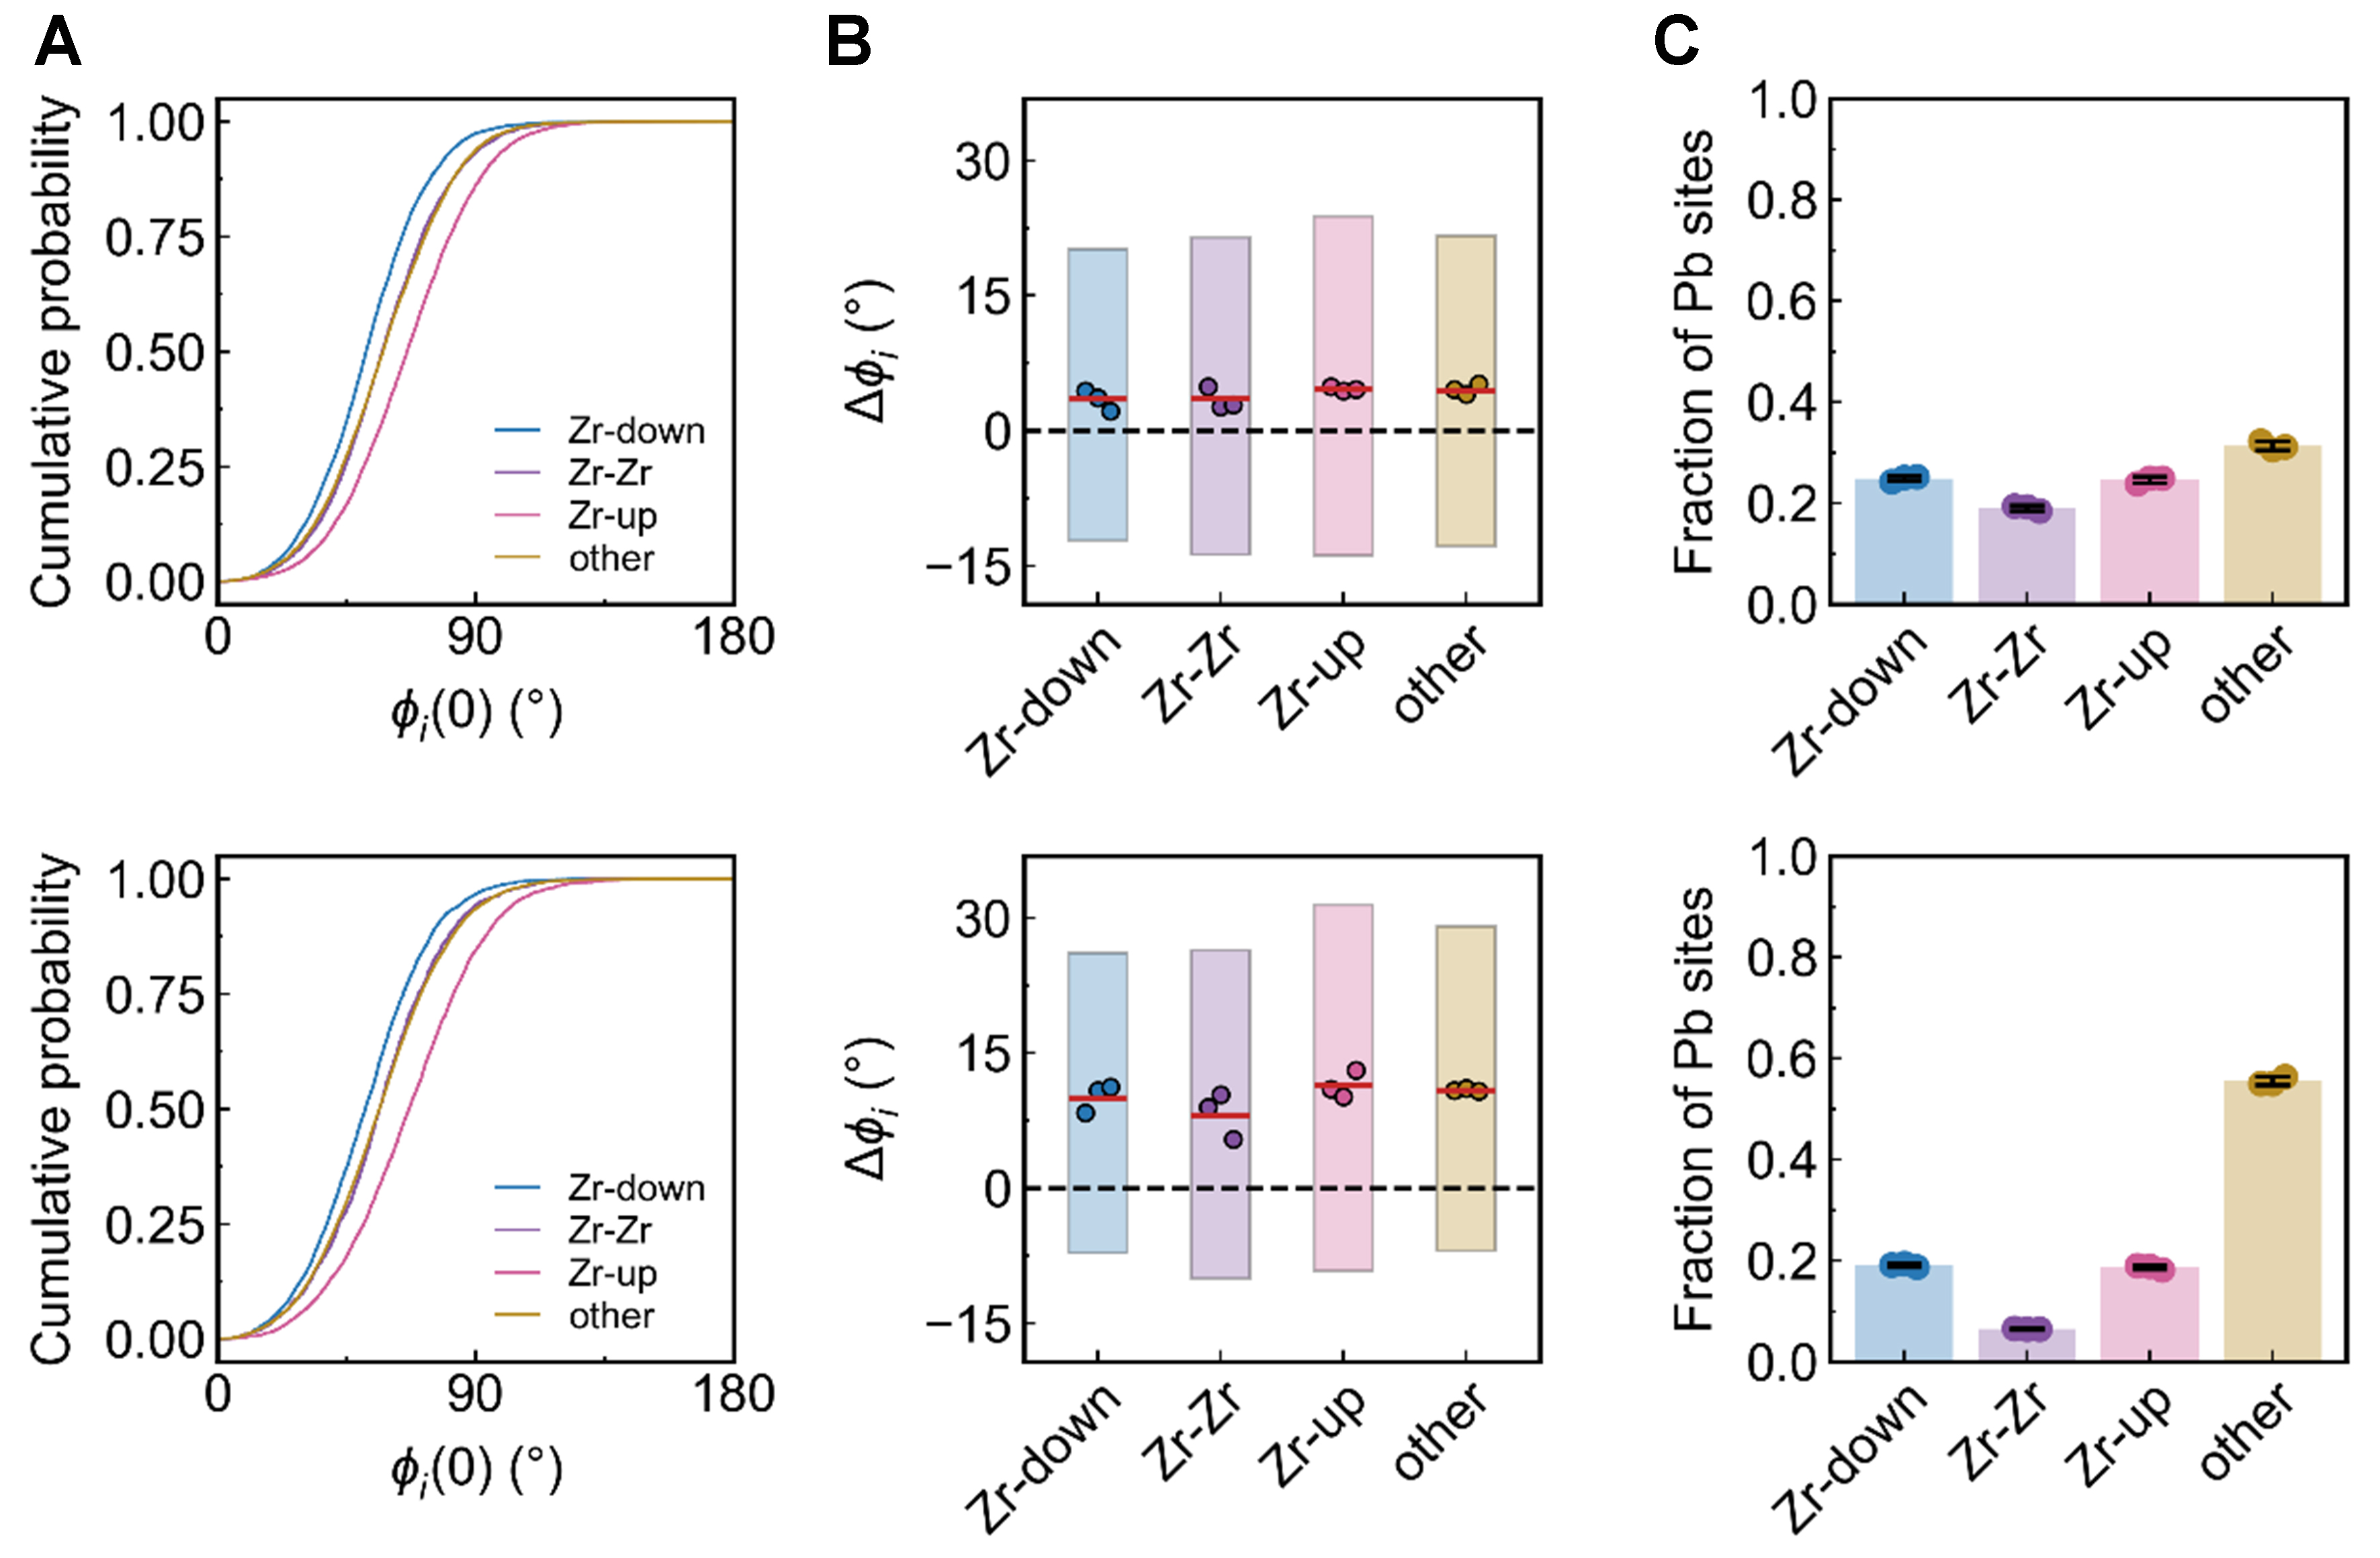
Figure 10. Local chemical dependence of Pb-displacement orientations and field-induced reorientation at 300 K. The upper and lower rows show results for x = 0.42 and x = 0.54, respectively. (A) Cumulative distributions of the zero-field deviation angle ϕ(0) between the local Pb off-center displacement and [001]p, resolved into Zr-down, Zr-Zr, Zr-up and other-environments as defined in the text; (B) Site-resolved angular changes, Δϕ = ϕ(0) - ϕ(100), upon increasing the electric field from 0 to 100 kV/cm along [001]p. Positive values indicate rotation towards the field direction. Shaded boxes span the 25th-75th percentiles, red horizontal lines indicate medians, and circles show the median values from three independent simulation replicas. Dashed horizontal lines mark Δϕ = 0; (C) Fractions of Pb sites belonging to each local-environment category. Bars show the mean fractions across three independent simulation replicas, circles indicate the values for individual replicas, and black error bars represent the standard deviation. Angular quantities are calculated from the final equilibrated frame at each field strength, retaining the same Pb sites selected by the zero-field criterion (|u(0)| ≥ 0.2 Å).