
fig1
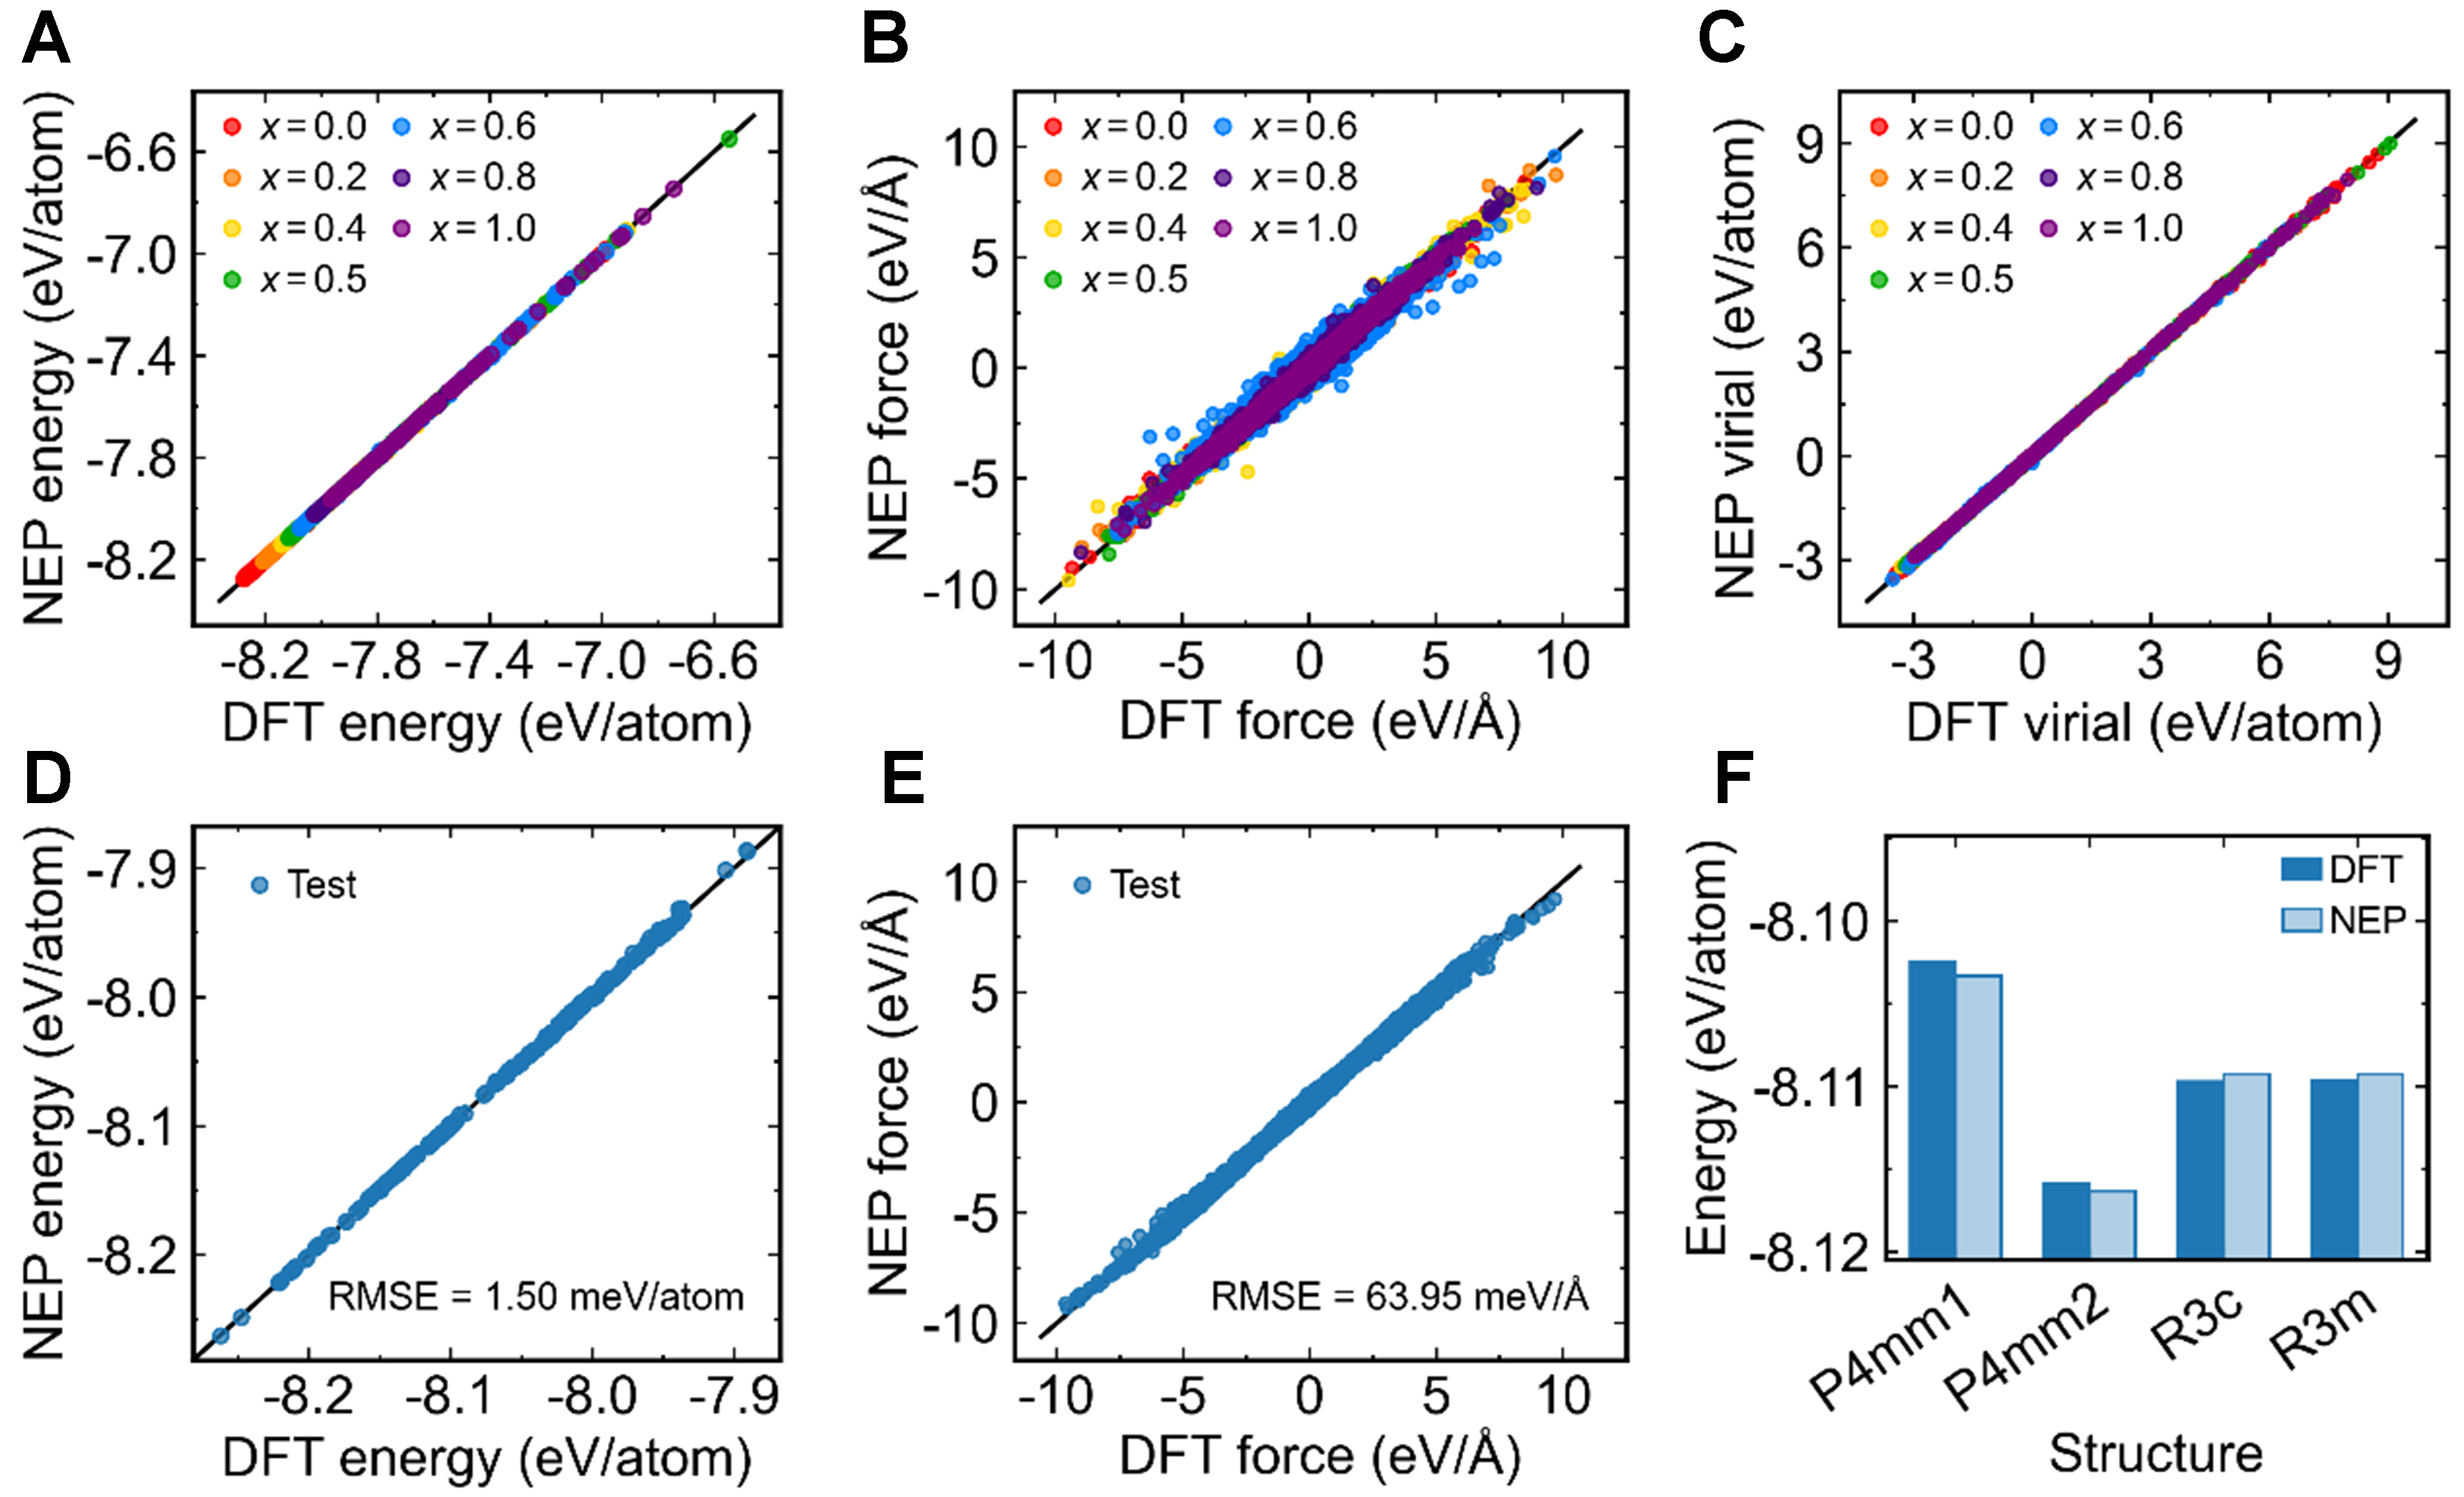
Figure 1. Validation of the NEP against DFT calculations. Comparison between the NEP predictions and DFT reference values for (A) energies per atom, (B) atomic forces and (C) virials per atom in the training set. Colors indicate the Ti fraction x. The corresponding root-mean-square errors are 1.63 meV/atom, 76.88 meV/Å and 20.57 meV/atom, respectively; Comparison of NEP predictions with DFT reference values for (D) energies per atom and (E) atomic forces in the independent test set. The corresponding root-mean-square errors are 1.50 meV/atom and 63.95 meV/Å, respectively; (F) Comparison of DFT and NEP energies per atom for four competing structures at x = 0.5, labeled P4mm1, P4mm2, R3c and R3m. The corresponding unit-cell structures are shown in Supplementary Figure 2. NEP: Neuroevolution potential; DFT: density functional theory; RMSE: root-mean-square error.