
fig3
From: Machine-learning-assisted understanding of discontinuous precipitation behavior in Cu-Ni-Si alloy
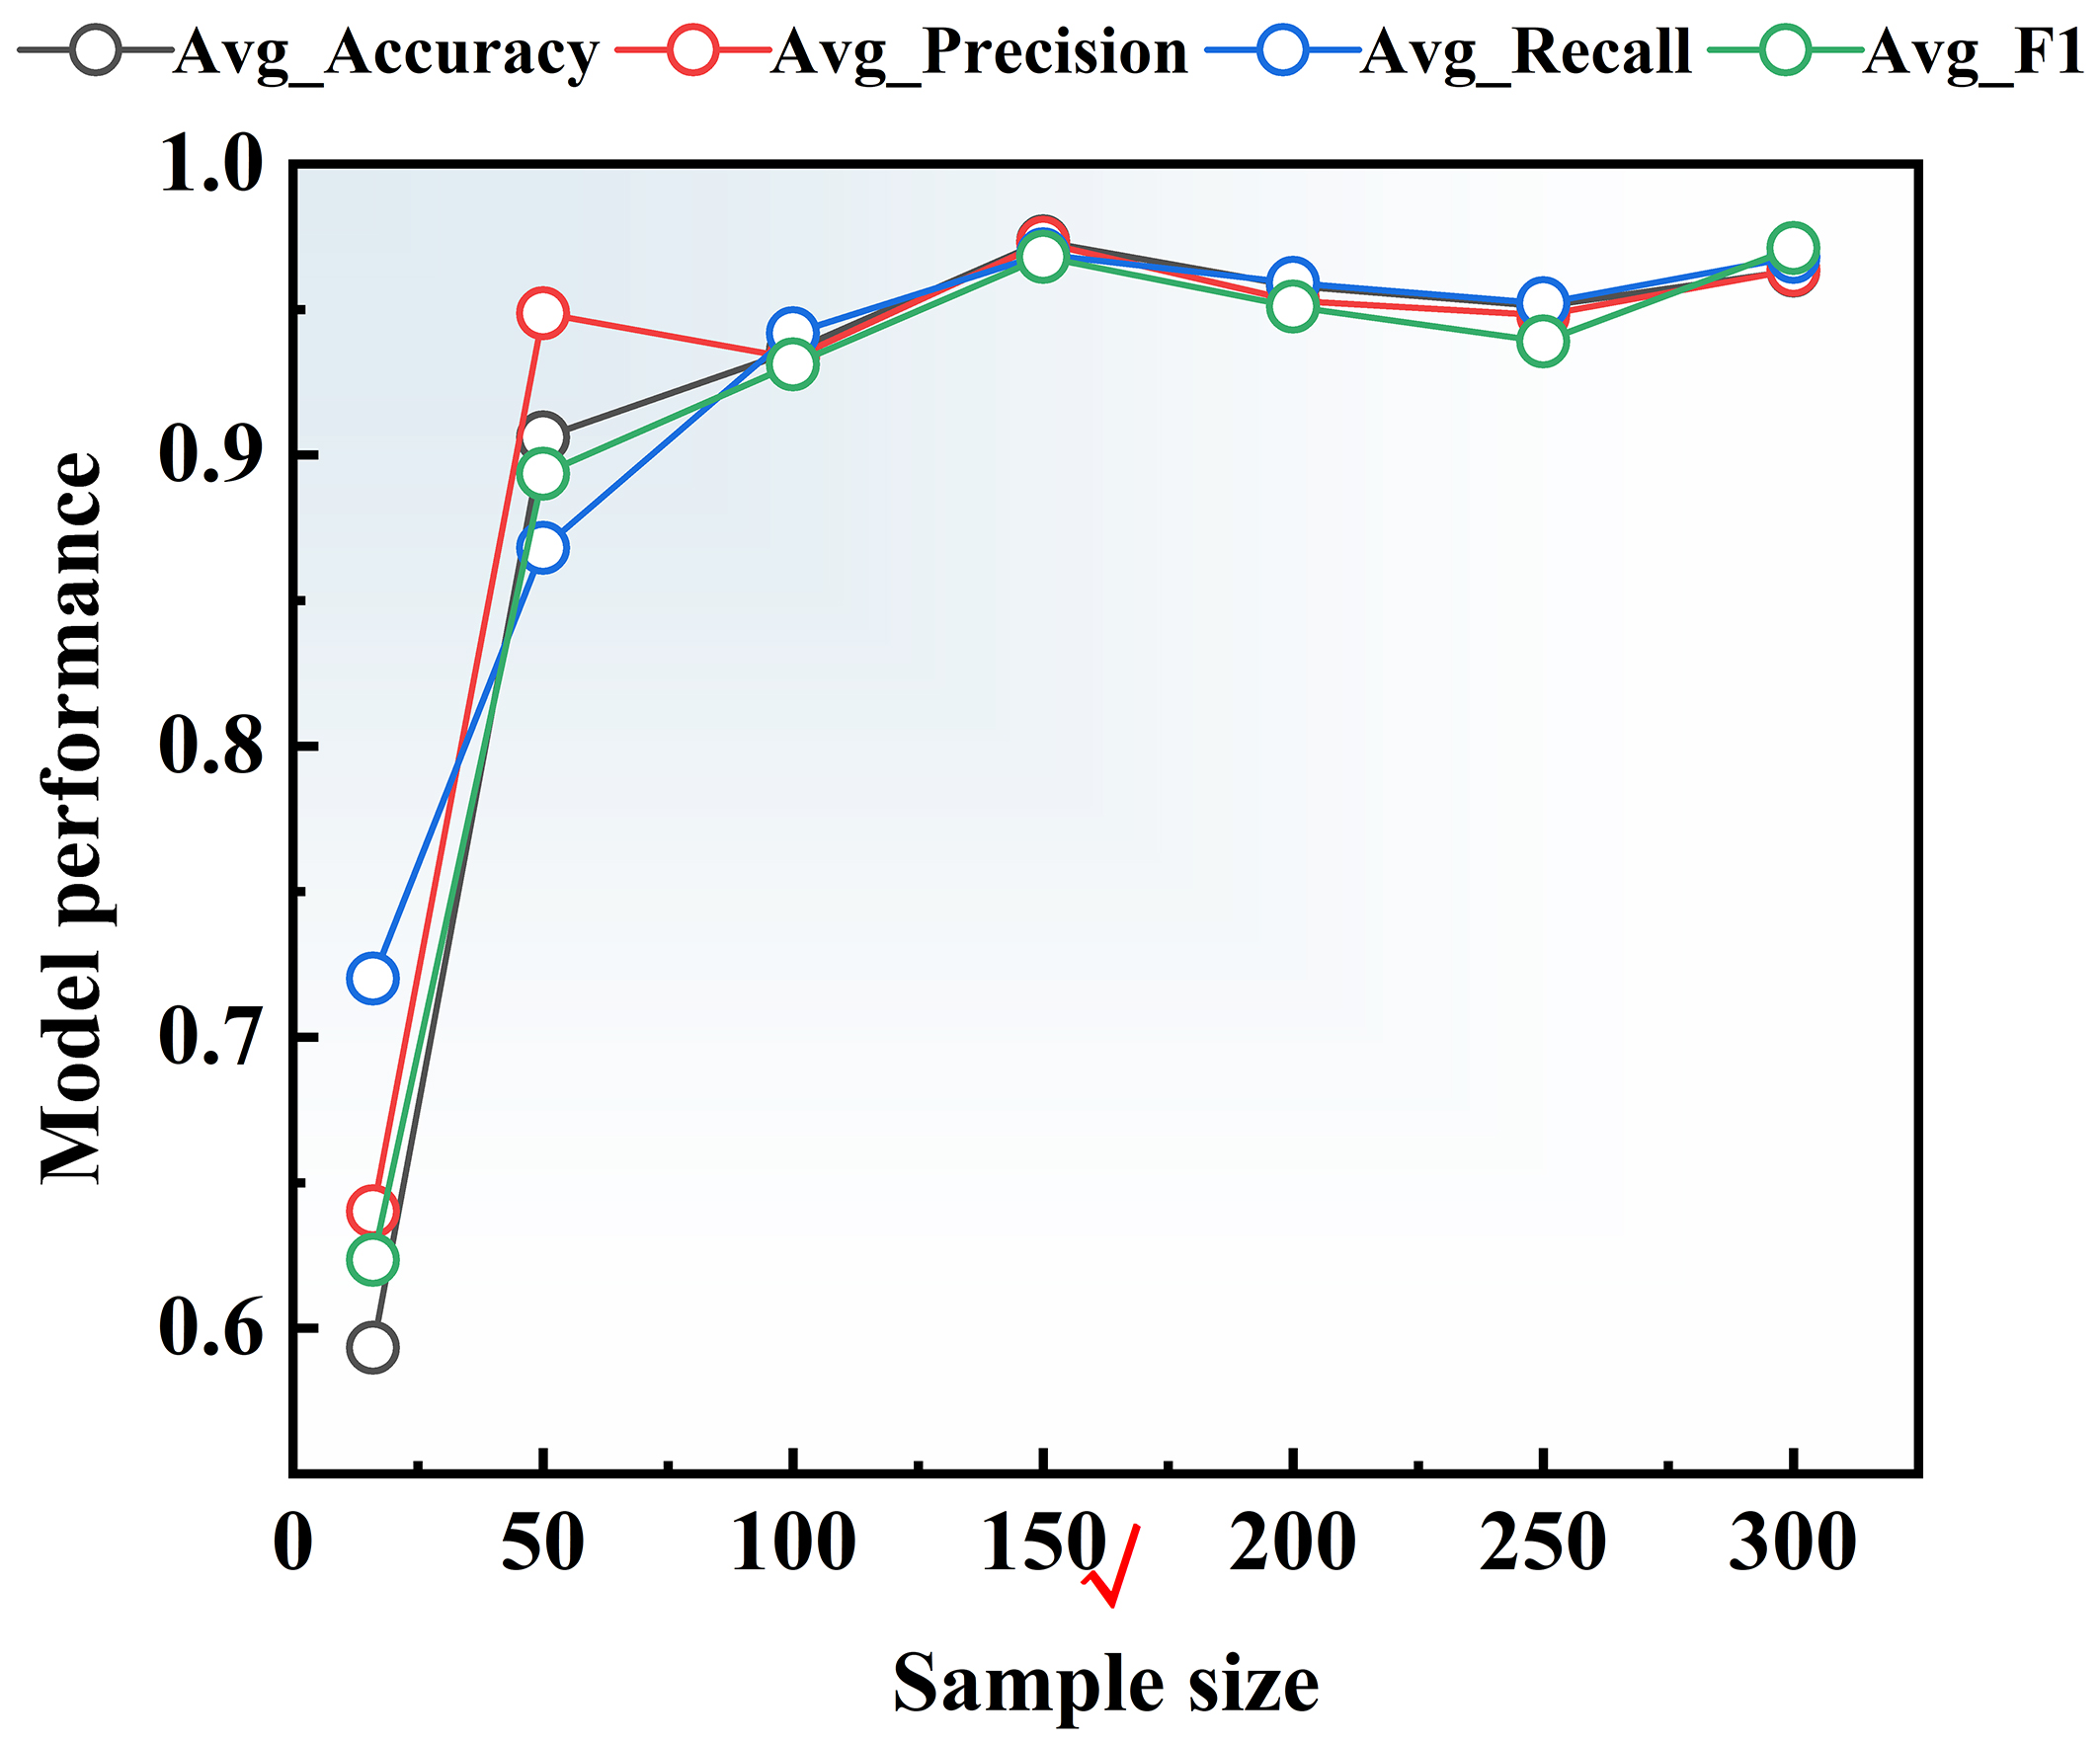
Figure 3. Model performance chart of the test set after modeling 100 times with different numbers of samples.
Figure 3. Model performance chart of the test set after modeling 100 times with different numbers of samples.


All published articles are preserved here permanently:
https://www.portico.org/publishers/oae/ All published articles are preserved here permanently:
https://www.portico.org/publishers/oae/