

Machine-learning-assisted understanding of discontinuous precipitation behavior in Cu-Ni-Si alloy
 0
Graphical Abstract
Abstract
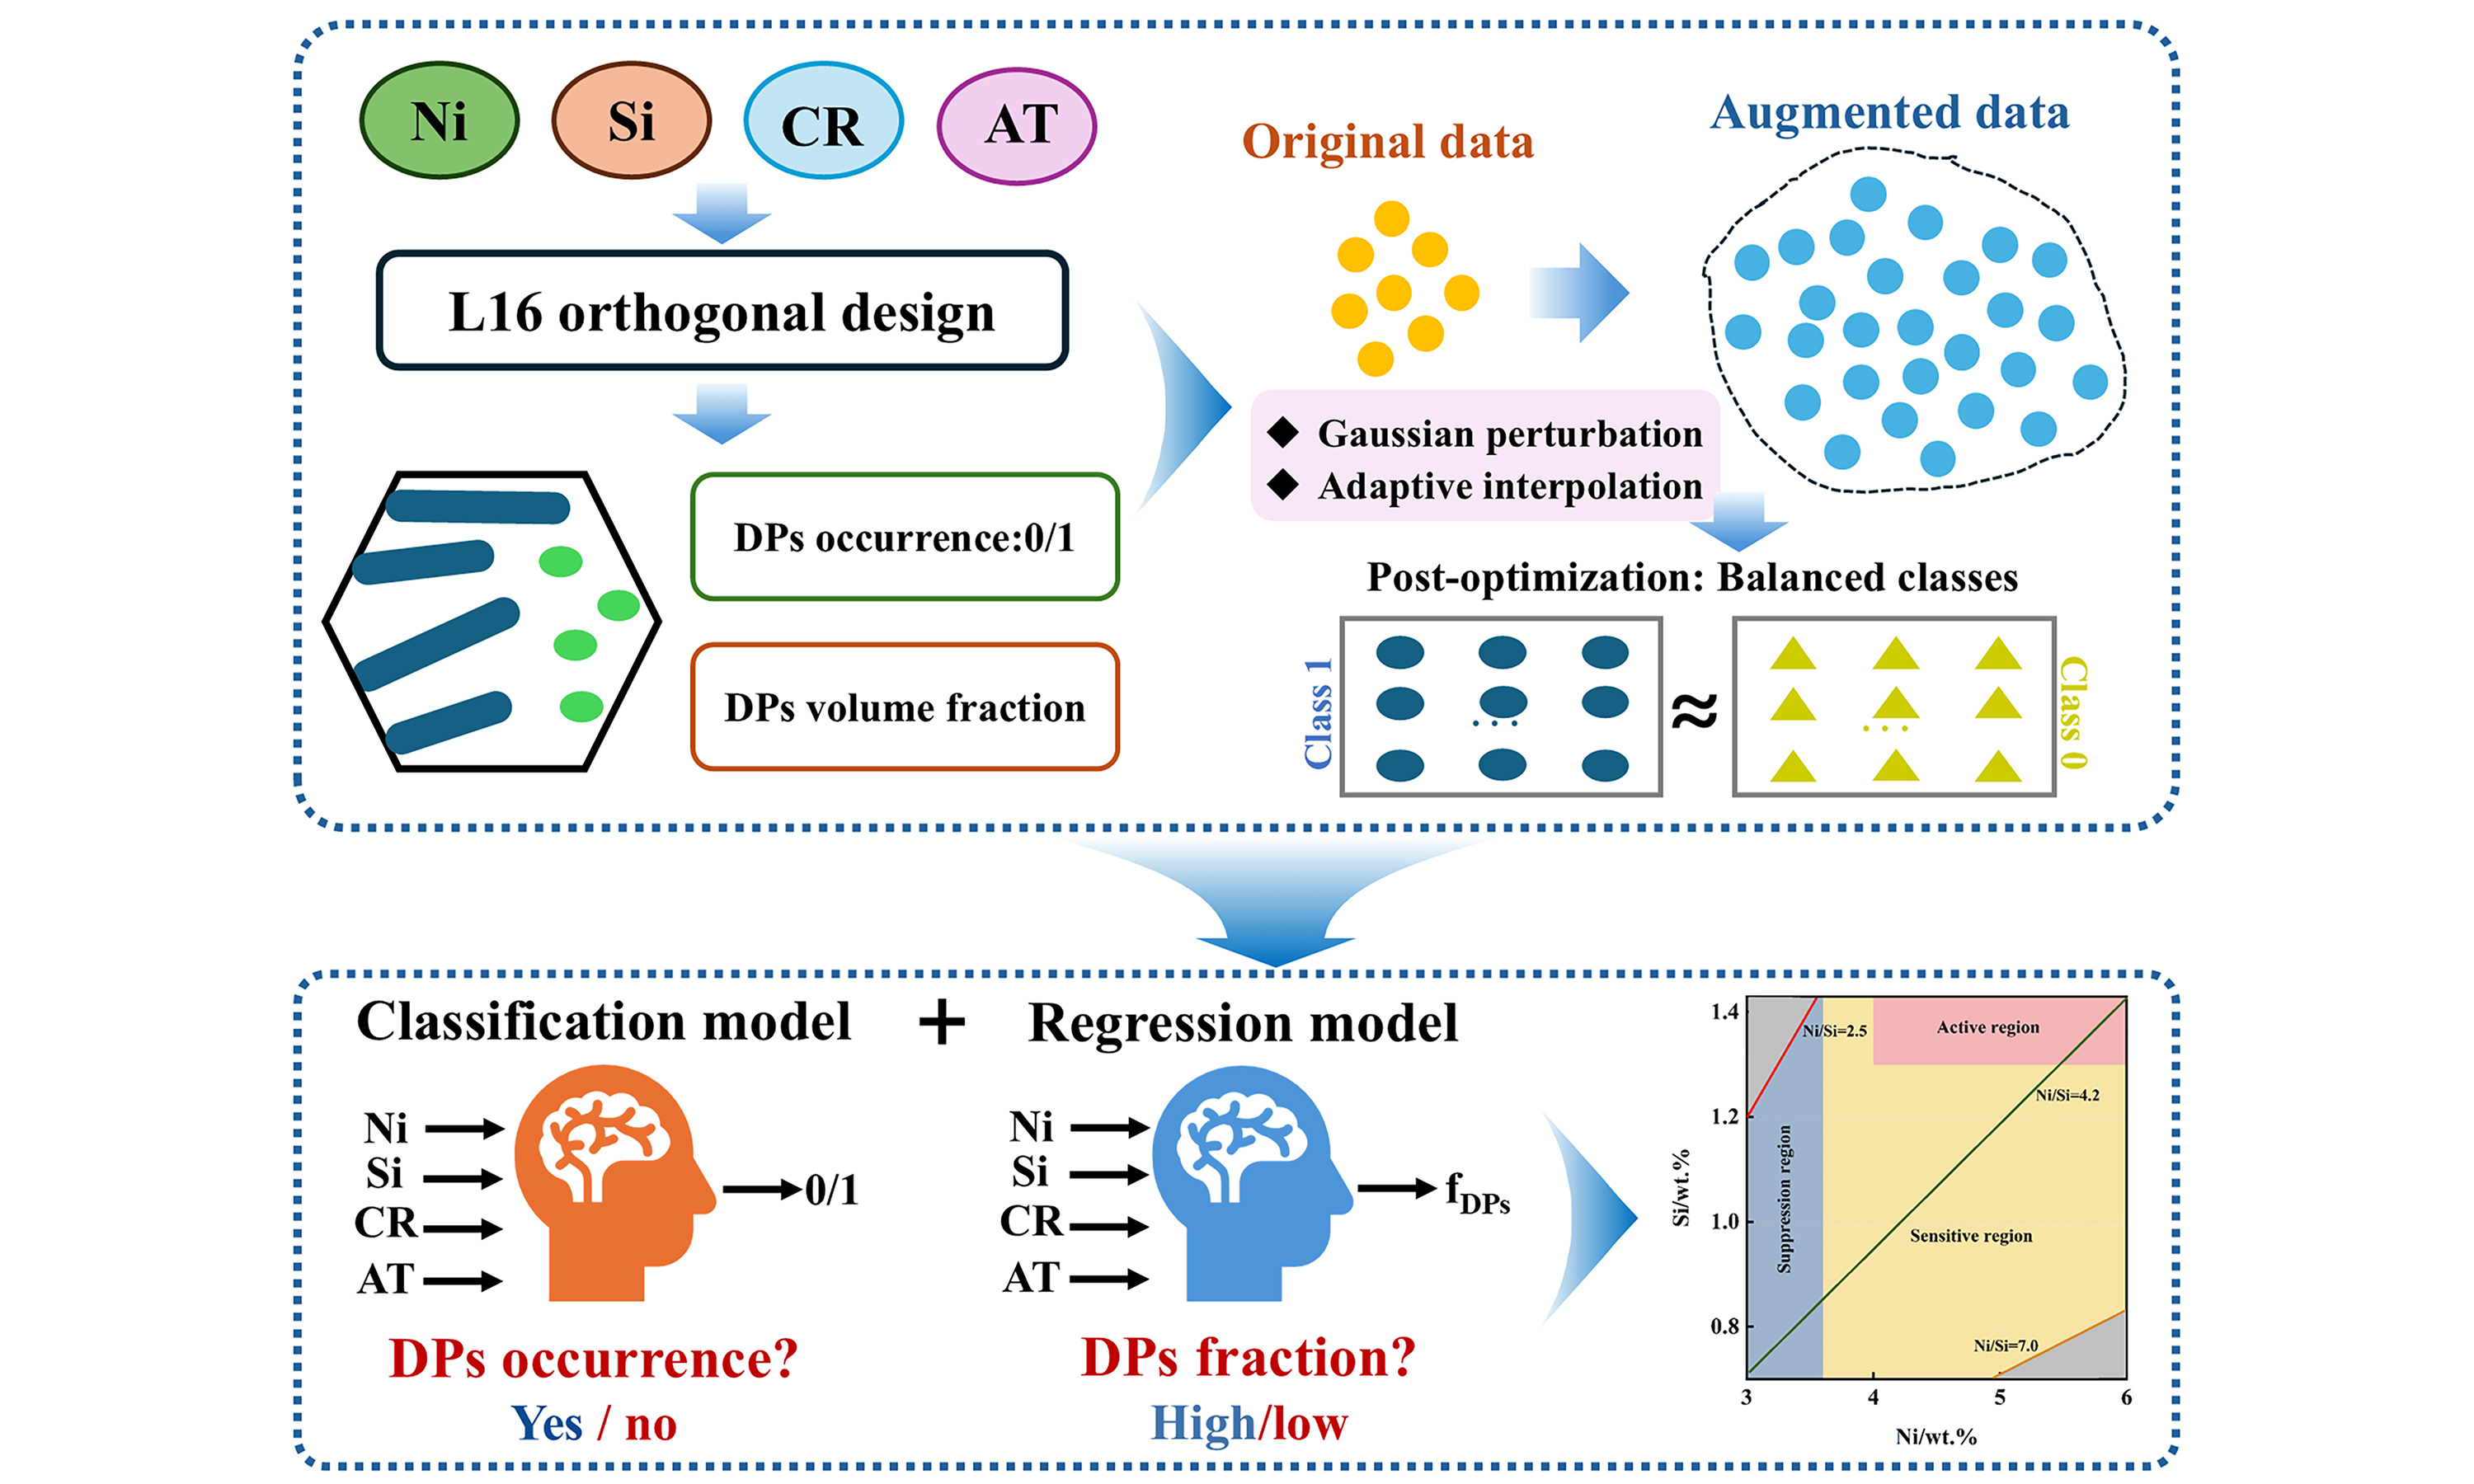
A machine learning framework integrating both classification and regression models was developed to characterize the evolution of discontinuous precipitates (DPs) in Cu-Ni-Si alloy throughout the composition and processing conditions. The framework incorporates orthogonal experiments, data augmentation, predictive modeling, and analysis of DP behavior. The soft-voting ensemble classifier achieved a predictive accuracy of 0.98 ± 0.01 in identifying the presence of DPs, whereas the regression model attained a coefficient of determination of 0.98 on the test set for quantifying the volume fraction of DPs. Utilizing the combined predictions, two-dimensional contour maps were generated and segmented into DP-suppressed, DP-sensitive, and DP-active regions, thereby elucidating the progression of DP behavior across varying compositional and processing conditions. SHapley Additive exPlanations analysis revealed that DPs occurrence was sequentially controlled by Ni content, aging temperature (AT), Si content, and cold-rolling reduction (CR), whereas the DP volume fraction was mainly controlled by AT, followed by Ni content, CR, and Si content. This work establishes an understanding of the intrinsic interrelationships among the composition, processing parameters, and DP behavior, thereby providing new mechanistic insights for microstructural regulation and performance optimization in Cu-Ni-Si alloy.
Keywords


 Download PDF
INTRODUCTION
Two distinct types of precipitates, namely, continuous precipitates (CPs) and discontinuous precipitates (DPs), have been identified in Cu-Ni-Si alloys[1,2]. CPs typically manifest as nanoscale dispersed particles within the matrix and play a significant role in the strengthening of the alloy[3-5]. In contrast, DPs preferentially nucleate at grain boundaries and subsequently grow into the grain interior through migration of the reaction front, typically leading to the development of a coarse fibrous morphology[2,6]. Compared with nanoscale CPs, DPs confer a relatively limited strengthening contribution, which stems primarily from their coarser size. When DPs are formed in large quantities, they may adversely affect the properties of the alloy[6]. Nevertheless, the influence of DPs is not entirely detrimental. The formation of DPs is accompanied by pronounced solute redistribution, which effectively reduces the concentration of solute atoms in the matrix and thereby improves the electrical conductivity of the alloy to a certain extent. Moreover, the DPs/matrix interfaces can impede dislocation motion and thus provide a certain strengthening contribution[7]. Therefore, DPs have a dual influence on alloy performance, constraining the synergy between strengthening and electrical conductivity. Accordingly, elucidating the formation mechanism of DPs and achieving effective control over their precipitation are highly important for optimizing the microstructures and properties of Cu-Ni-Si alloys.
Previous studies have demonstrated that DP behavior is governed by the coupled effects of alloy composition, heat-treatment conditions, deformation degree, and defect structure[2,6-9]. For instance, elevated Ni and Si contents increase the supersaturated solute concentration within the matrix, modifying the precipitation kinetics and favoring the formation of lamellar DPs[2]. The nucleation and growth of DPs are further governed by grain-boundary migration and solute diffusion, both of which are highly sensitive to aging temperature (AT) and aging time[6]. Moreover, deformation-induced defects, such as dislocations and shear bands, may provide energetically favorable sites for DPs nucleation[7]. It is therefore evident that DPs behavior is intrinsically governed by the coupled effects of alloy composition and processing parameters. Nevertheless, alloy composition and processing conditions generally constitute a multidimensional parameter space, where complex nonlinear interactions exist among different variables. Conventional experimental approaches, typically relying on trial-and-error strategies or univariate analysis, are not only time-consuming and costly but also insufficient for systematically elucidating the distribution characteristics of DPs behavior across the multidimensional composition-processing space.
In recent years, machine learning approaches have attracted increasing attention in materials science research. In machine learning, data-driven strategies can be employed to extract the intrinsic relationships among complex variables from experimental or computational datasets, thereby enabling material performance prediction, microstructure evolution analysis, and accelerated material design optimization[10-15]. For example, Yin et al. developed a heterogeneous graph neural network that integrates alloy composition and processing pathways to predict hardness and electrical conductivity, enabling experimentally validated composition-process co-design of high-performance Cu alloys[15]. This work demonstrates the value of integrated composition-processing modeling for Cu alloy design, providing a methodological basis for extending predictive analyses to microstructural phenomena such as discontinuous precipitation. However, the application of machine learning in materials research is often constrained by the limited availability of experimental data, which poses significant challenges to model construction and predictive performance. Unlike domains such as image recognition and natural language processing[16,17], where large-scale datasets can be readily collected, materials datasets are typically small due to the high cost, complex procedures, and time-consuming nature of experimental data acquisition. To address this challenge, various data augmentation strategies have been developed in recent years to expand dataset size and improve model training performance by generating virtual samples around the original data distribution[18,19]. Physics-informed data augmentation approaches, such as noise injection and interpolation methods, have been widely adopted in materials research. Specifically, noise injection generates new samples by introducing controlled perturbations into the original data according to predefined transformation rules[20,21], whereas interpolation methods construct additional data points by exploiting the intrinsic relationships among existing samples[22,23]. Nevertheless, a single augmentation strategy often struggles to achieve a balance among generation efficiency, sample diversity, and physical feasibility. Accordingly, an integrated data augmentation framework incorporating physical constraints and adaptive sample generation was established, wherein Gaussian perturbation and interpolation-based generation are synergistically employed to expand the sample space while preserving the laws of metallurgical physics. Furthermore, a post-processing optimization strategy was implemented to enhance the reliability of the augmented dataset. This method enhances sample diversity while preserving the intrinsic distribution characteristics of the original dataset, thereby providing a more reliable data foundation for machine learning modeling in small-data regimes.
Accordingly, an integrated machine-learning framework was established to map DPs behavior within the composition-processing space of Cu-Ni-Si alloy. The framework integrates classification and regression models, where the former reveals the compositional and processing domains associated with DPs occurrence, while the latter quantitatively predicts the corresponding DPs volume fraction. By coupling categorical recognition with quantitative estimation, this framework enables a comprehensive visualization of DPs behavior and reveals the intrinsic coupling among alloy composition, processing parameters, and discontinuous precipitation characteristics, providing a new pathway for microstructure design and performance optimization of Cu-Ni-Si alloy.
MATERIALS AND METEHODS
Dataset collection and experiments
The alloy compositions and corresponding deformation-aging processing routes were designed according to the L16 orthogonal array. The alloy composition design referred to the thermodynamic calculation results of Thermo-Calc (such as Supplementary Figure 1, which shows the ternary isothermal section phase diagrams obtained using Thermo-Calc thermodynamic calculation software at 425, 450, and 500 °C). The selected Ni and Si contents ranged from 3-6 wt.% and 0.71-1.43 wt.%, respectively, with four levels for each element (Ni: 3 wt.%, 4 wt.%, 5 wt.%, and 6 wt.%; Si: 0.71 wt.%, 0.95 wt.%, 1.19 wt.%, and 1.43 wt.%). Sixteen alloys were subsequently fabricated by vacuum induction melting according to the designed compositions.
The as-cast ingots were homogenized at 950 °C for 24 h, followed by hot rolling at 850 °C with a reduction of 75%. The alloys were then solution-treated at 980 °C for 1 h, after which they were quenched in water to obtain a supersaturated solid solution. The subsequent deformation-aging treatments were performed according to the L16 orthogonal design. Four levels of cold-rolling reduction (CR) (60%, 70%, 80%, and 90%) and four ATs (425, 450, 475, and 500 °C) were selected, with the corresponding aging times of 0.5, 1, 3, 5, 8, and 12 h. All 16 alloys were experimentally aged at each of the six selected time points (0.5, 1, 3, 5, 8, and
The electrical conductivity and hardness of the alloys were measured, with at least five measurements performed for each specimen and the average value taken as the final result. The peak-aged condition was individually determined for each alloy based on its hardness evolution during aging treatment. Considering that DPs generally develop near or beyond the peak-aged state[1,6], this condition was selected to investigate DPs behavior across the composition–processing space. This approach also provides a comparable metallurgical reference state by accounting for differences in precipitation kinetics among alloys. The hardness and electrical conductivity at the peak-aging condition were recorded in the orthogonal experimental dataset, as summarized in Supplementary Table 1. Scanning electron microscopy (SEM, Regulus 8100) was employed to characterize the precipitation behavior of the alloys in the peak-aged state, as illustrated in Supplementary Figure 2. The occurrence of DPs was determined based on the observed microstructural features, and the corresponding volume fractions were quantitatively evaluated, as summarized in Supplementary Table 1.
Machine learning framework
To elucidate the distribution characteristics of DP behavior within the composition-processing space, a machine learning-assisted integrated design framework was established, as illustrated in Figure 1. This framework is established upon two fundamental descriptors of DPs behavior, namely the occurrence of DPs and their precipitation extent, which are addressed through classification and regression models, respectively, enabling qualitative identification and quantitative prediction of DPs behavior. The detailed procedure is described as follows:
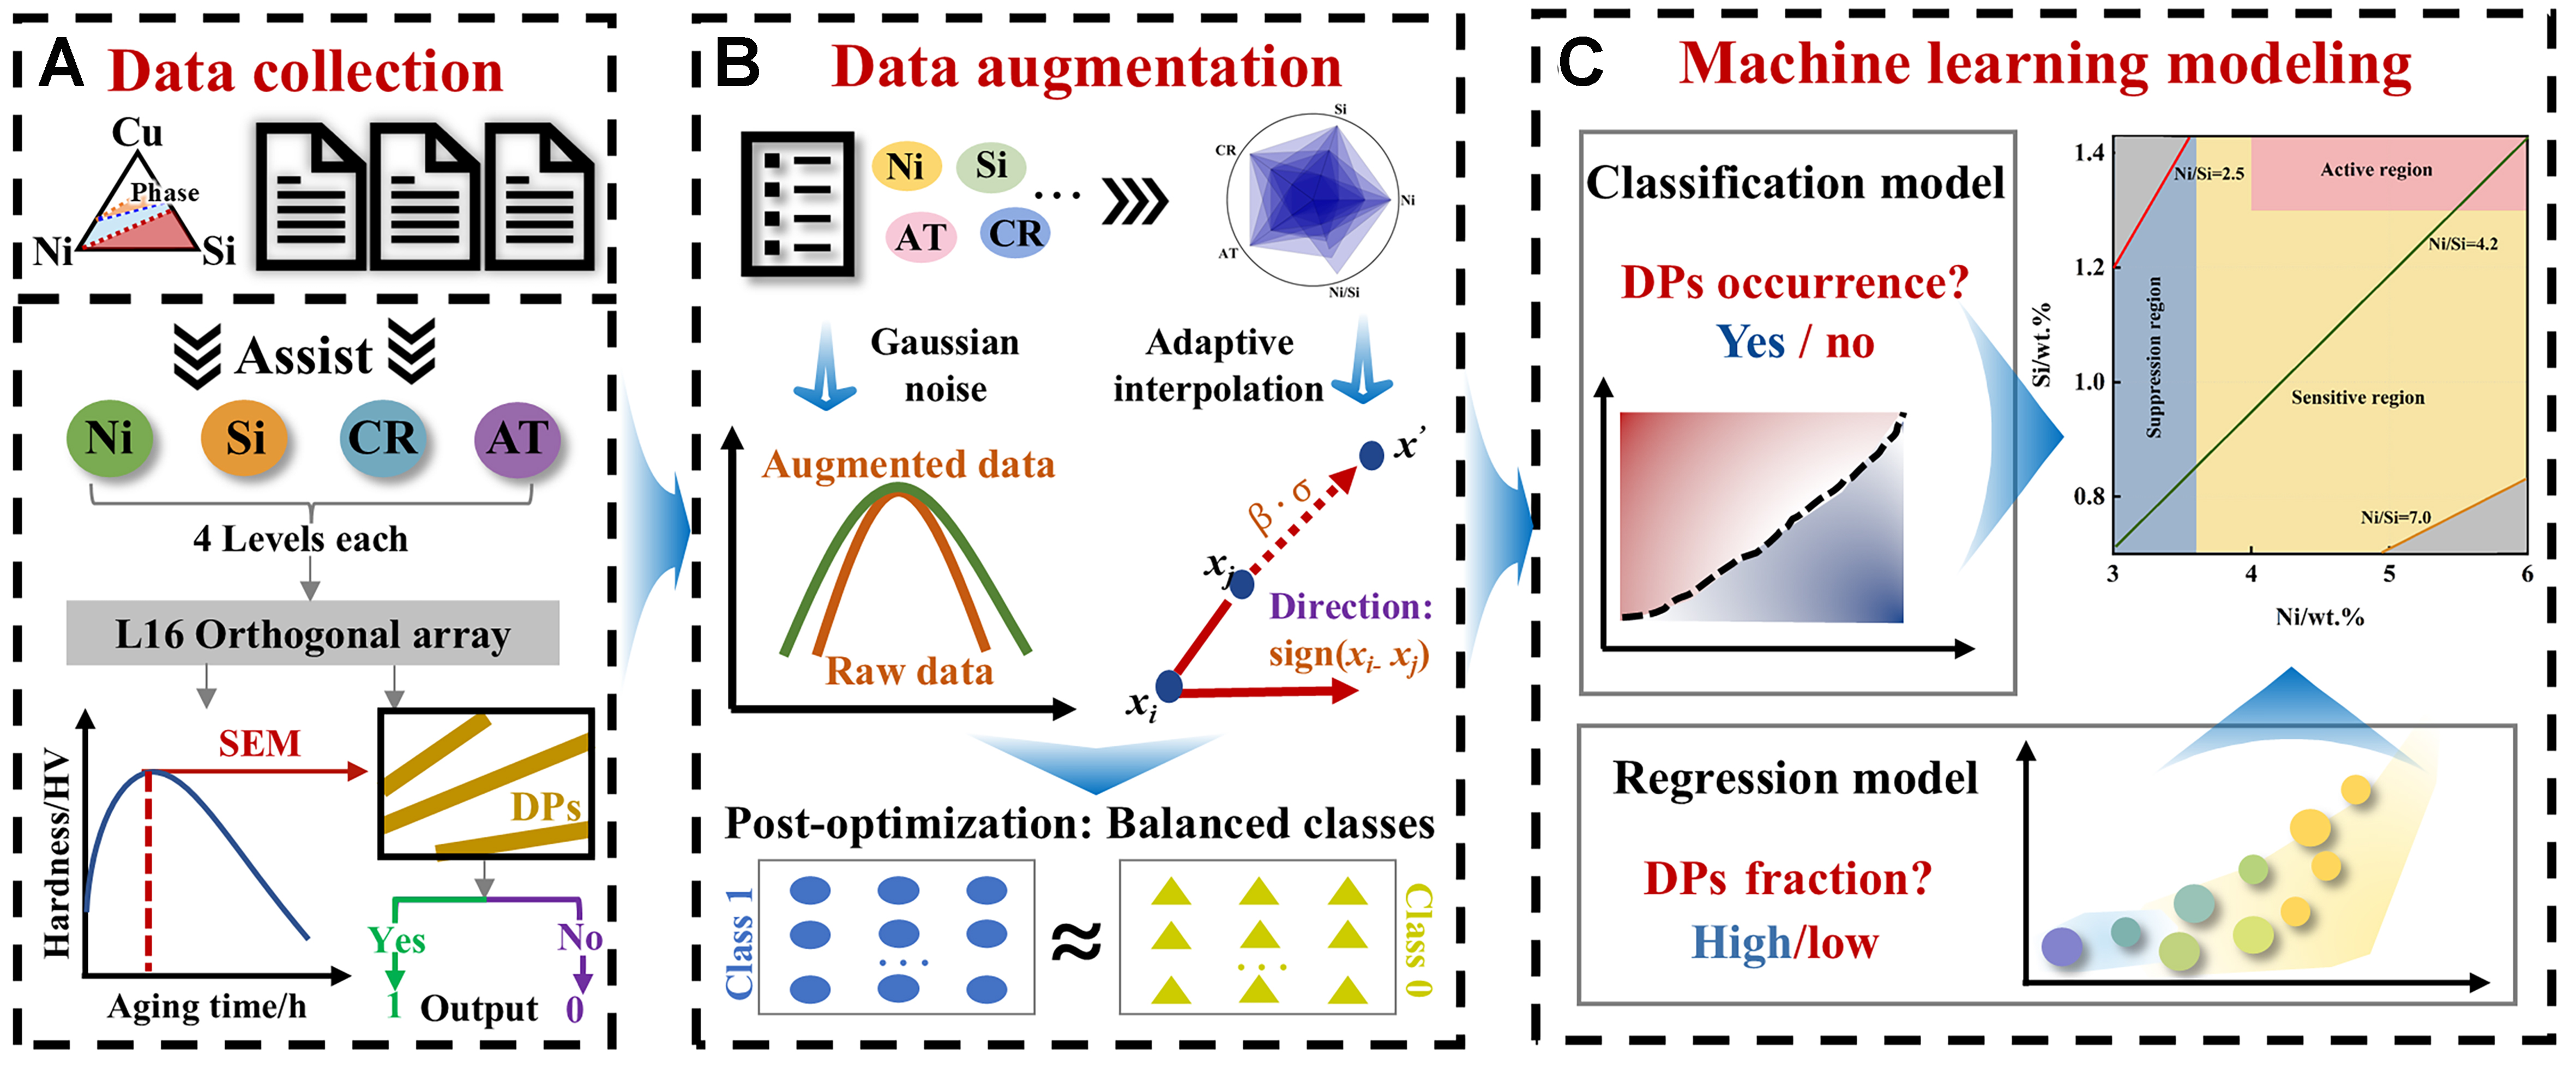
Figure 1. Schematic illustration of the machine learning-assisted framework for predicting DPs behavior in Cu-Ni-Si alloys: (A) Experimental data collection based on orthogonal design; (B) Data augmentation; (C) Machine learning-based classification and regression modeling for predicting DPs occurrence and volume fraction. DPs: Discontinuous precipitates; CR: cold-rolling reduction; AT: aging temperature; SEM: scanning electron microscopy.
a. An original sample dataset was established through orthogonal experimental design. Ni, Si, CR, and AT were selected as input features, while the occurrence of DPs and the corresponding volume fraction under peak-aging conditions were defined as target variables, thereby yielding a high-quality fundamental dataset for subsequent modeling.
b. For the classification task of DPs occurrence, a data augmentation strategy was introduced based on the original dataset to alleviate the small sample size issue. Specifically, virtual samples were constructed within the distribution region of the original samples by combining Gaussian perturbation and adaptive interpolation approaches. Subsequently, post-processing optimization, including abnormal sample screening and data balancing, was applied to evaluate and optimize the generated samples, thereby expanding and optimizing the dataset for DP occurrence classification. The detailed implementation procedure of data augmentation is described in Section “Data augmentation approaches”.
c. A classification model for DPs occurrence was established based on the augmented dataset. Subsequently, a new sample dataset was constructed based on the orthogonal experimental dataset and the validation results of the classification model, which was further used to establish a regression model for quantitatively predicting the DPs volume fraction. The classification model was employed to determine the formation tendency of DPs under predefined composition-processing combinations, whereas the regression model was used to quantitatively evaluate the degree of evolution of DPs. By coupling the prediction results of the two models, a visualized mapping and regional classification of DPs behavior within the composition-processing space are achieved, thereby revealing its distribution characteristics and evolution trends.
Data augmentation approaches
On the basis of the orthogonal experimental results, an initial dataset comprising 16 samples was established. To overcome the challenges associated with limited sample size and physical feasibility constraints in the dataset, a data augmentation framework integrating physical constraints, adaptive sample generation, multi-level robust screening, and post-processing optimization was established. The overall data augmentation strategy is schematically illustrated in Figure 2. The framework aims to generate an augmented dataset that is consistent with the original data distribution, balanced in categories and beneficial for model generalization, while strictly adhering to metallurgical principles. Specifically:
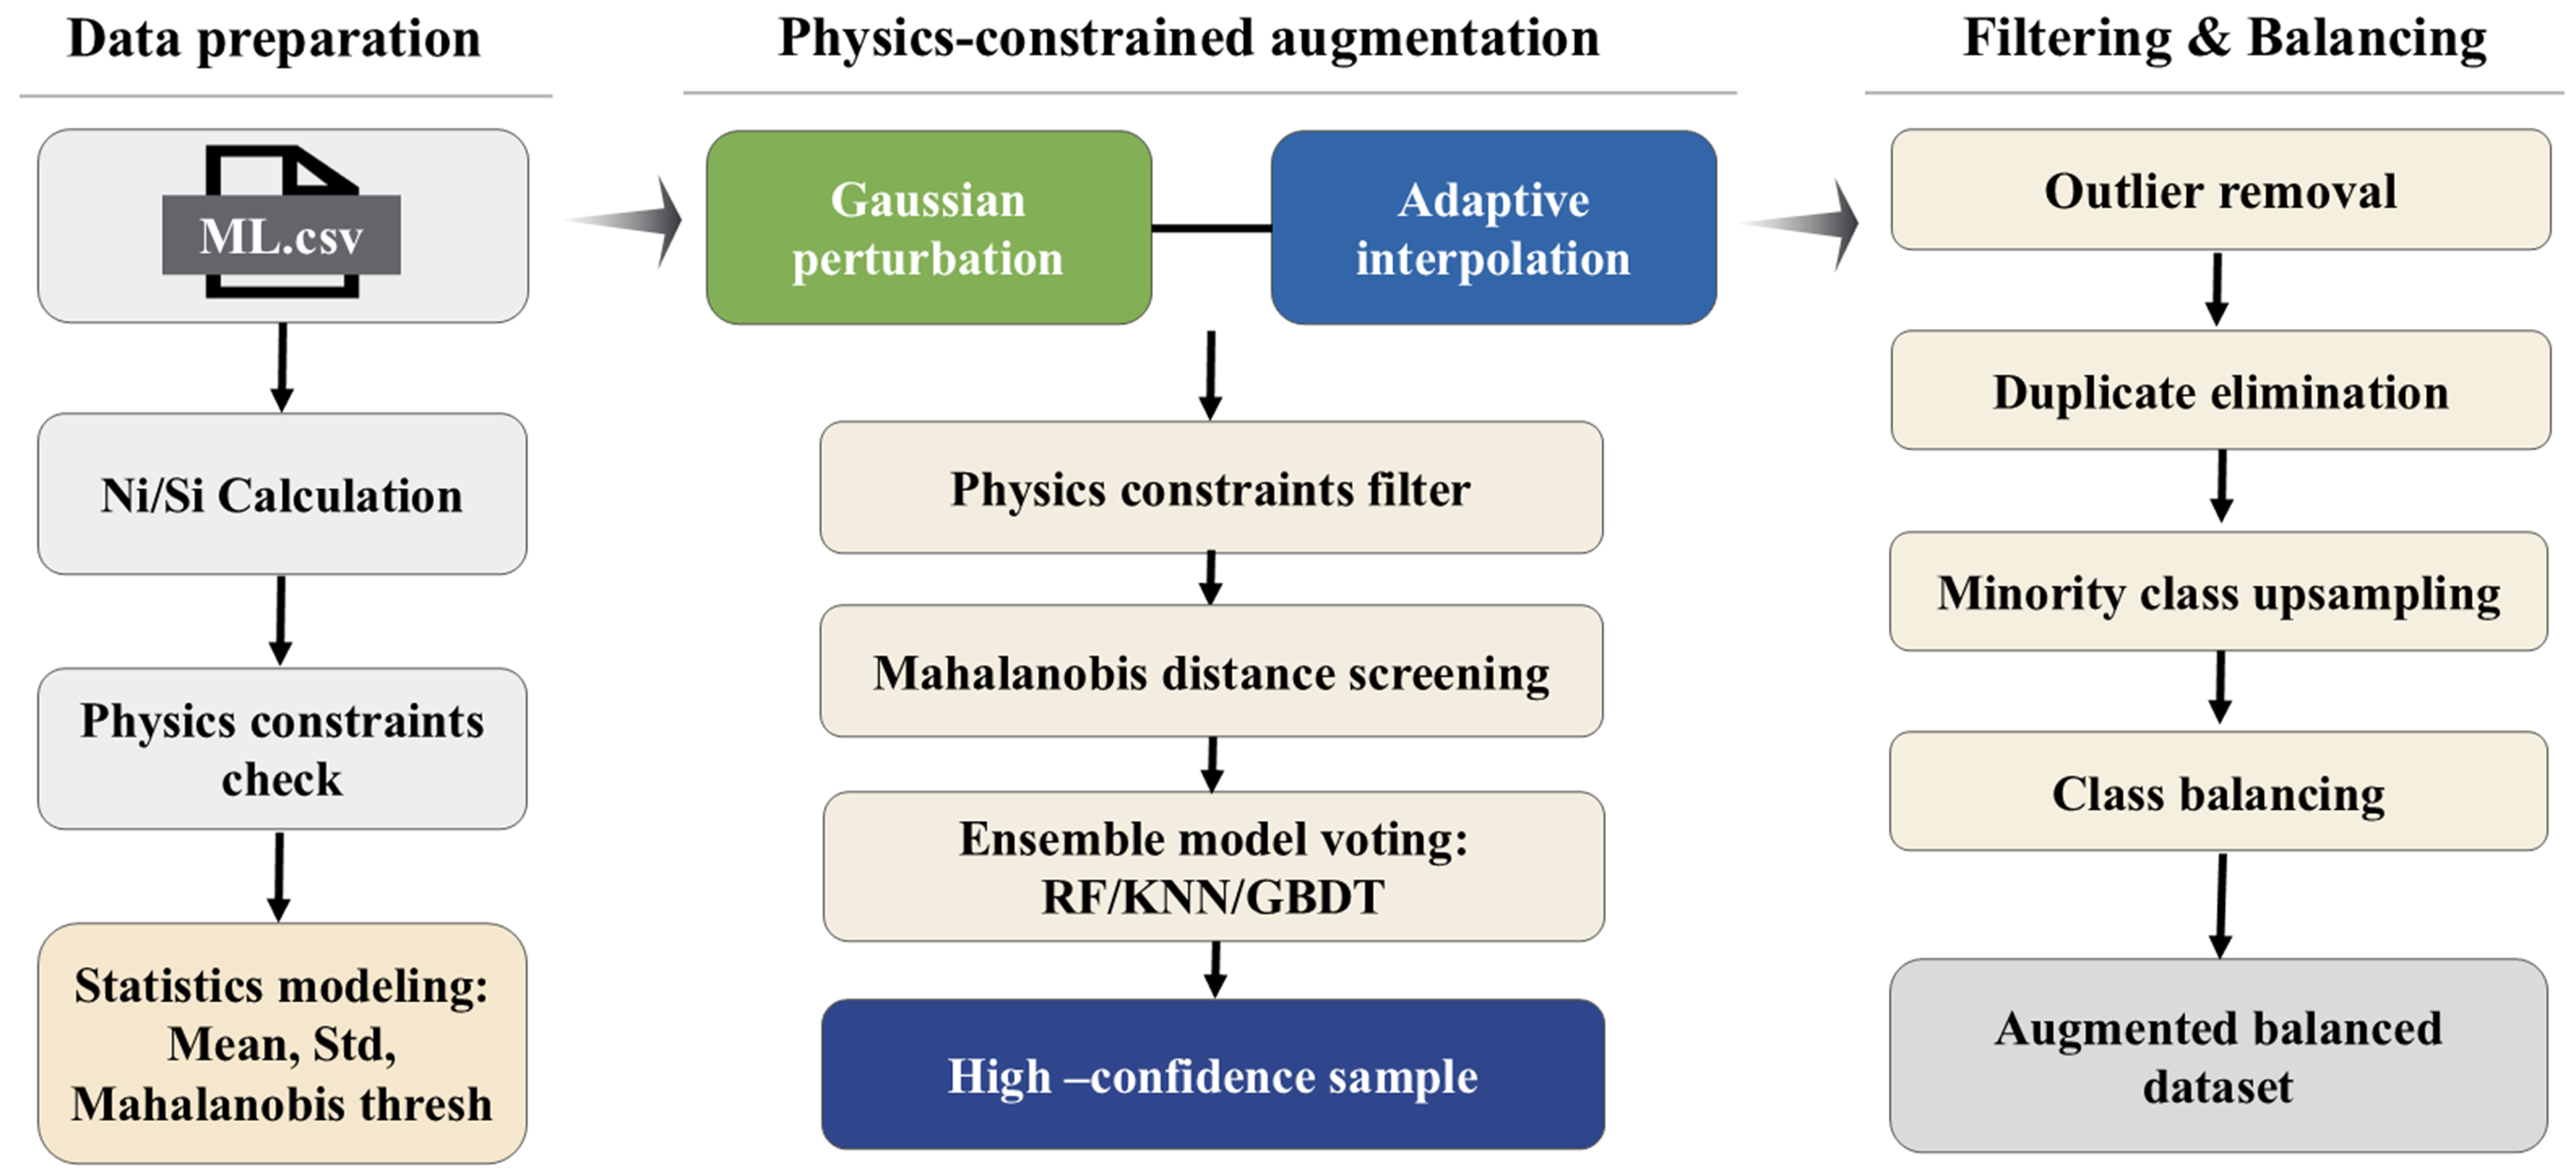
Figure 2. Schematic illustration of the data augmentation strategy. RF: Random forest; KNN: K-nearest neighbors classifier; GBDT: gradient boosting decision tree.
1) Physically constrained sample space for data augmentation. Based on the established Cu-Ni-Si alloy dataset, a four-dimensional feature space (X = Ni, Si, CR, AT) was constructed. Meanwhile, the following physical constraints were introduced based on previous studies and prior research results. All generated candidate samples were required to strictly satisfy these physical constraints: (1) The composition ranges of Ni and Si, as well as the combinations of deformation-aging processing parameters, were constrained within the upper and lower limits defined by the orthogonal experimental design in Supplementary Table 1; (2) To utilize the synergistic effects among alloy constituents, a derived parameter, denoted as Ni/Si, was established, which represents the weight ratio of Ni to Si. The permissible range for the Ni/Si ratio is constrained according to the derived feature limitations outlined in Supplementary Table 1, which is based on the results of the thermodynamic calculation. Specifically, to achieve an optimal balance between mechanical strength and electrical conductivity, the weight ratio of Ni to Si should be maintained within the interval of 2.5 to 7.
2) Multi-level robust screening mechanism. To ensure that the newly generated samples not only satisfy the physical constraints but also preserve the distribution characteristics of the dataset, a three-stage progressive screening strategy was introduced. Firstly, the Moore-Penrose pseudo-inverse of the covariance matrix was calculated from the dataset to accommodate potential singularity or ill-conditioning, and the Mahalanobis distance of each newly generated sample was subsequently evaluated. The 97.5th percentile of the Mahalanobis distance distribution of the samples was adopted as the threshold to eliminate outliers located in the tail regions of the original distribution, thereby ensuring that the generated samples remained within the dominant feature distribution of the dataset[27,28]. Then, a logical consistency voting mechanism based on ensemble learning was established. Three classification models, including random forest (RF), K-nearest neighbors classifier (KNN), and gradient boosting decision tree (GBDT), were trained on the dataset to construct the ensemble classifier. Finally, for each candidate generated sample, at least two models were required to produce prediction labels consistent with the original labels based on the four feature variables (Ni, Si, CR, and AT). The ensemble strategy utilized the consensus among multiple models to eliminate samples exhibiting inconsistencies between the feature space and target relationship.
3) Adaptive generation strategy. To achieve a balance between generation efficiency and sample diversity, two complementary sample generation strategies, namely Gaussian perturbation and adaptive interpolation, were established. The perturbation magnitude in both approaches was adaptively adjusted based on the standard deviation of the original dataset. To generate physically plausible samples within the local neighborhood of the original data distribution, Gaussian perturbations were introduced with their magnitudes adaptively scaled according to the standard deviation of the i-th feature in the original training dataset:
where, α is the noise ratio, set to 0.1 in this work; σi denotes the standard deviation of the i-th feature. The perturbation was applied exclusively to the fundamental physical features (Ni, Si, CR, and AT), while the derived feature Ni/Si was recalculated based on the perturbed compositional variables to maintain physical consistency. This process simulates the parameter fluctuations encountered in practical experimental conditions while avoiding the generation of anomalous samples deviating from the original data distribution.
On this basis, an adaptive interpolation strategy based on feature standard deviations was further introduced to enhance sample diversity. This approach utilized the directional information between real samples and adopted the standard deviation of each feature as the adaptive interpolation step size, enabling the generation of highly reliable new samples within the local feature space. Specifically, two samples xi and xj were randomly selected, and an interpolated sample was constructed along their difference vector:
where, xi and xj represent sample i and j, respectively; σ denotes the vector of feature standard deviations; β is a random number;
4) Post-processing optimization. The initially generated samples were further optimized through secondary processing. (1) Mahalanobis distance filtering uses a looser threshold (99.5th percentile of the original distance distribution) to remove outliers while retaining the reasonable samples; (2) Conduct a final deduplication process on the samples that have successfully passed all evaluations to guarantee the absence of duplicate entries within the dataset. If the number of samples in a specific class remained below the predefined target, supplementary samples were generated using perturbations with reduced intensity. Finally, minority-class upsampling was performed to achieve an equal number of samples for the 0 and 1 classes, thereby establishing a balanced dataset and reducing the bias associated with class imbalance in subsequent classification model development.
RESULTS AND DISCUSSION
Performance analysis of data augmentation
Machine learning algorithms reported to be suitable for small-sample datasets were employed to construct DPs classification prediction models using both the original and augmented datasets. Specifically, artificial neural network (ANN)[29], decision tree (DT)[30,31], RF[32], GBDT[33], KNN[34], and support vector classification (SVC)[35] were selected for model development. For all classification models, Ni, Si, CR, and AT were employed as input variables, while the presence or absence of DPs was defined as the prediction target.
Prior to data augmentation, the original experimental dataset was randomly divided into training and independent test sets at a ratio of 4:1. Data augmentation was performed exclusively on the train set, while the test set was excluded from all augmentation procedures and used solely for model evaluation. Grid-search-based hyperparameter optimization combined with five-fold cross-validation was conducted using only the training data. This procedure ensures that the held-out original experimental samples are completely excluded from the data augmentation and model training processes, thereby preventing information leakage between the training and test sets. To account for the uncertainty associated with data partitioning, the entire procedure was independently repeated 100 times. The predictive performance in each run was evaluated on the corresponding held-out experimental test set using Accuracy, Precision, Recall, and F1-score.
By recording the model performance on a 100-round test set, the robustness and stability of the model can be effectively measured. Accuracy represents the ratio of correctly classified samples to the total number of samples; Precision denotes the ratio of true positive predictions among all samples predicted as positive; Recall quantifies the proportion of actual positive samples correctly identified by the model; and F1-score is the harmonic mean of Precision and Recall, providing a balanced assessment of model performance by considering both metrics[19].
where true positive (TP) refers to samples correctly predicted as positive (predicted 1, actual 1); false positive (FP) refers to samples incorrectly predicted as positive (predicted 1, actual 0); true negative (TN) refers to samples correctly predicted as negative (predicted 0, actual 0); and false negative (FN) refers to samples incorrectly predicted as negative (predicted 0, actual 1).
Figure 3 presents the variation in test set performance with increasing sample size, evaluated over 100 independent modeling runs, to determine the optimal extent of data augmentation. The sample sizes refer to the total number of samples, comprising both the original experimental samples and the augmented samples. As the total sample size increases, Accuracy, Precision, Recall, and F1-score exhibit substantial improvements, indicating that data augmentation enhances the predictive performance and generalization capability of the model. Notably, model performance stabilizes when the sample size exceeds 150, indicating diminishing gains in predictive accuracy from further data augmentation. This plateau can be attributed to the generation of augmented samples through physically constrained local perturbations of the original data, whereby the additional information introduced remains intrinsically bounded by the underlying distribution of the original dataset. At relatively small sample sizes, the introduction of additional samples substantially expands the coverage of the feature space, thereby enabling a more comprehensive identification of the intrinsic relationships between Ni and Si compositions, the processing parameters CR and AT, and the occurrence of discontinuous precipitation in Cu-Ni-Si alloy. However, once the number of samples surpasses 150, the model has effectively captured the primary variation trends and distinctive patterns. The discrepancies between newly generated samples and the existing ones progressively diminish, reflecting a tendency toward replication of the current distributions rather than the introduction of novel information. It is therefore critical to judiciously control the scale of data augmentation. An insufficient number of augmented samples provides limited expansion of data diversity and is thus inadequate to improve model generalizability, whereas excessive augmentation may introduce substantial information redundancy. The latter not only increases computational cost but may also promote overfitting to highly similar samples, thereby diminishing the efficacy of data augmentation. An appropriate augmentation scale is therefore required to balance the introduction of additional information against unnecessary data redundancy, ensuring a meaningful improvement in model performance. Accordingly, the number of samples was set to 150 in this work.
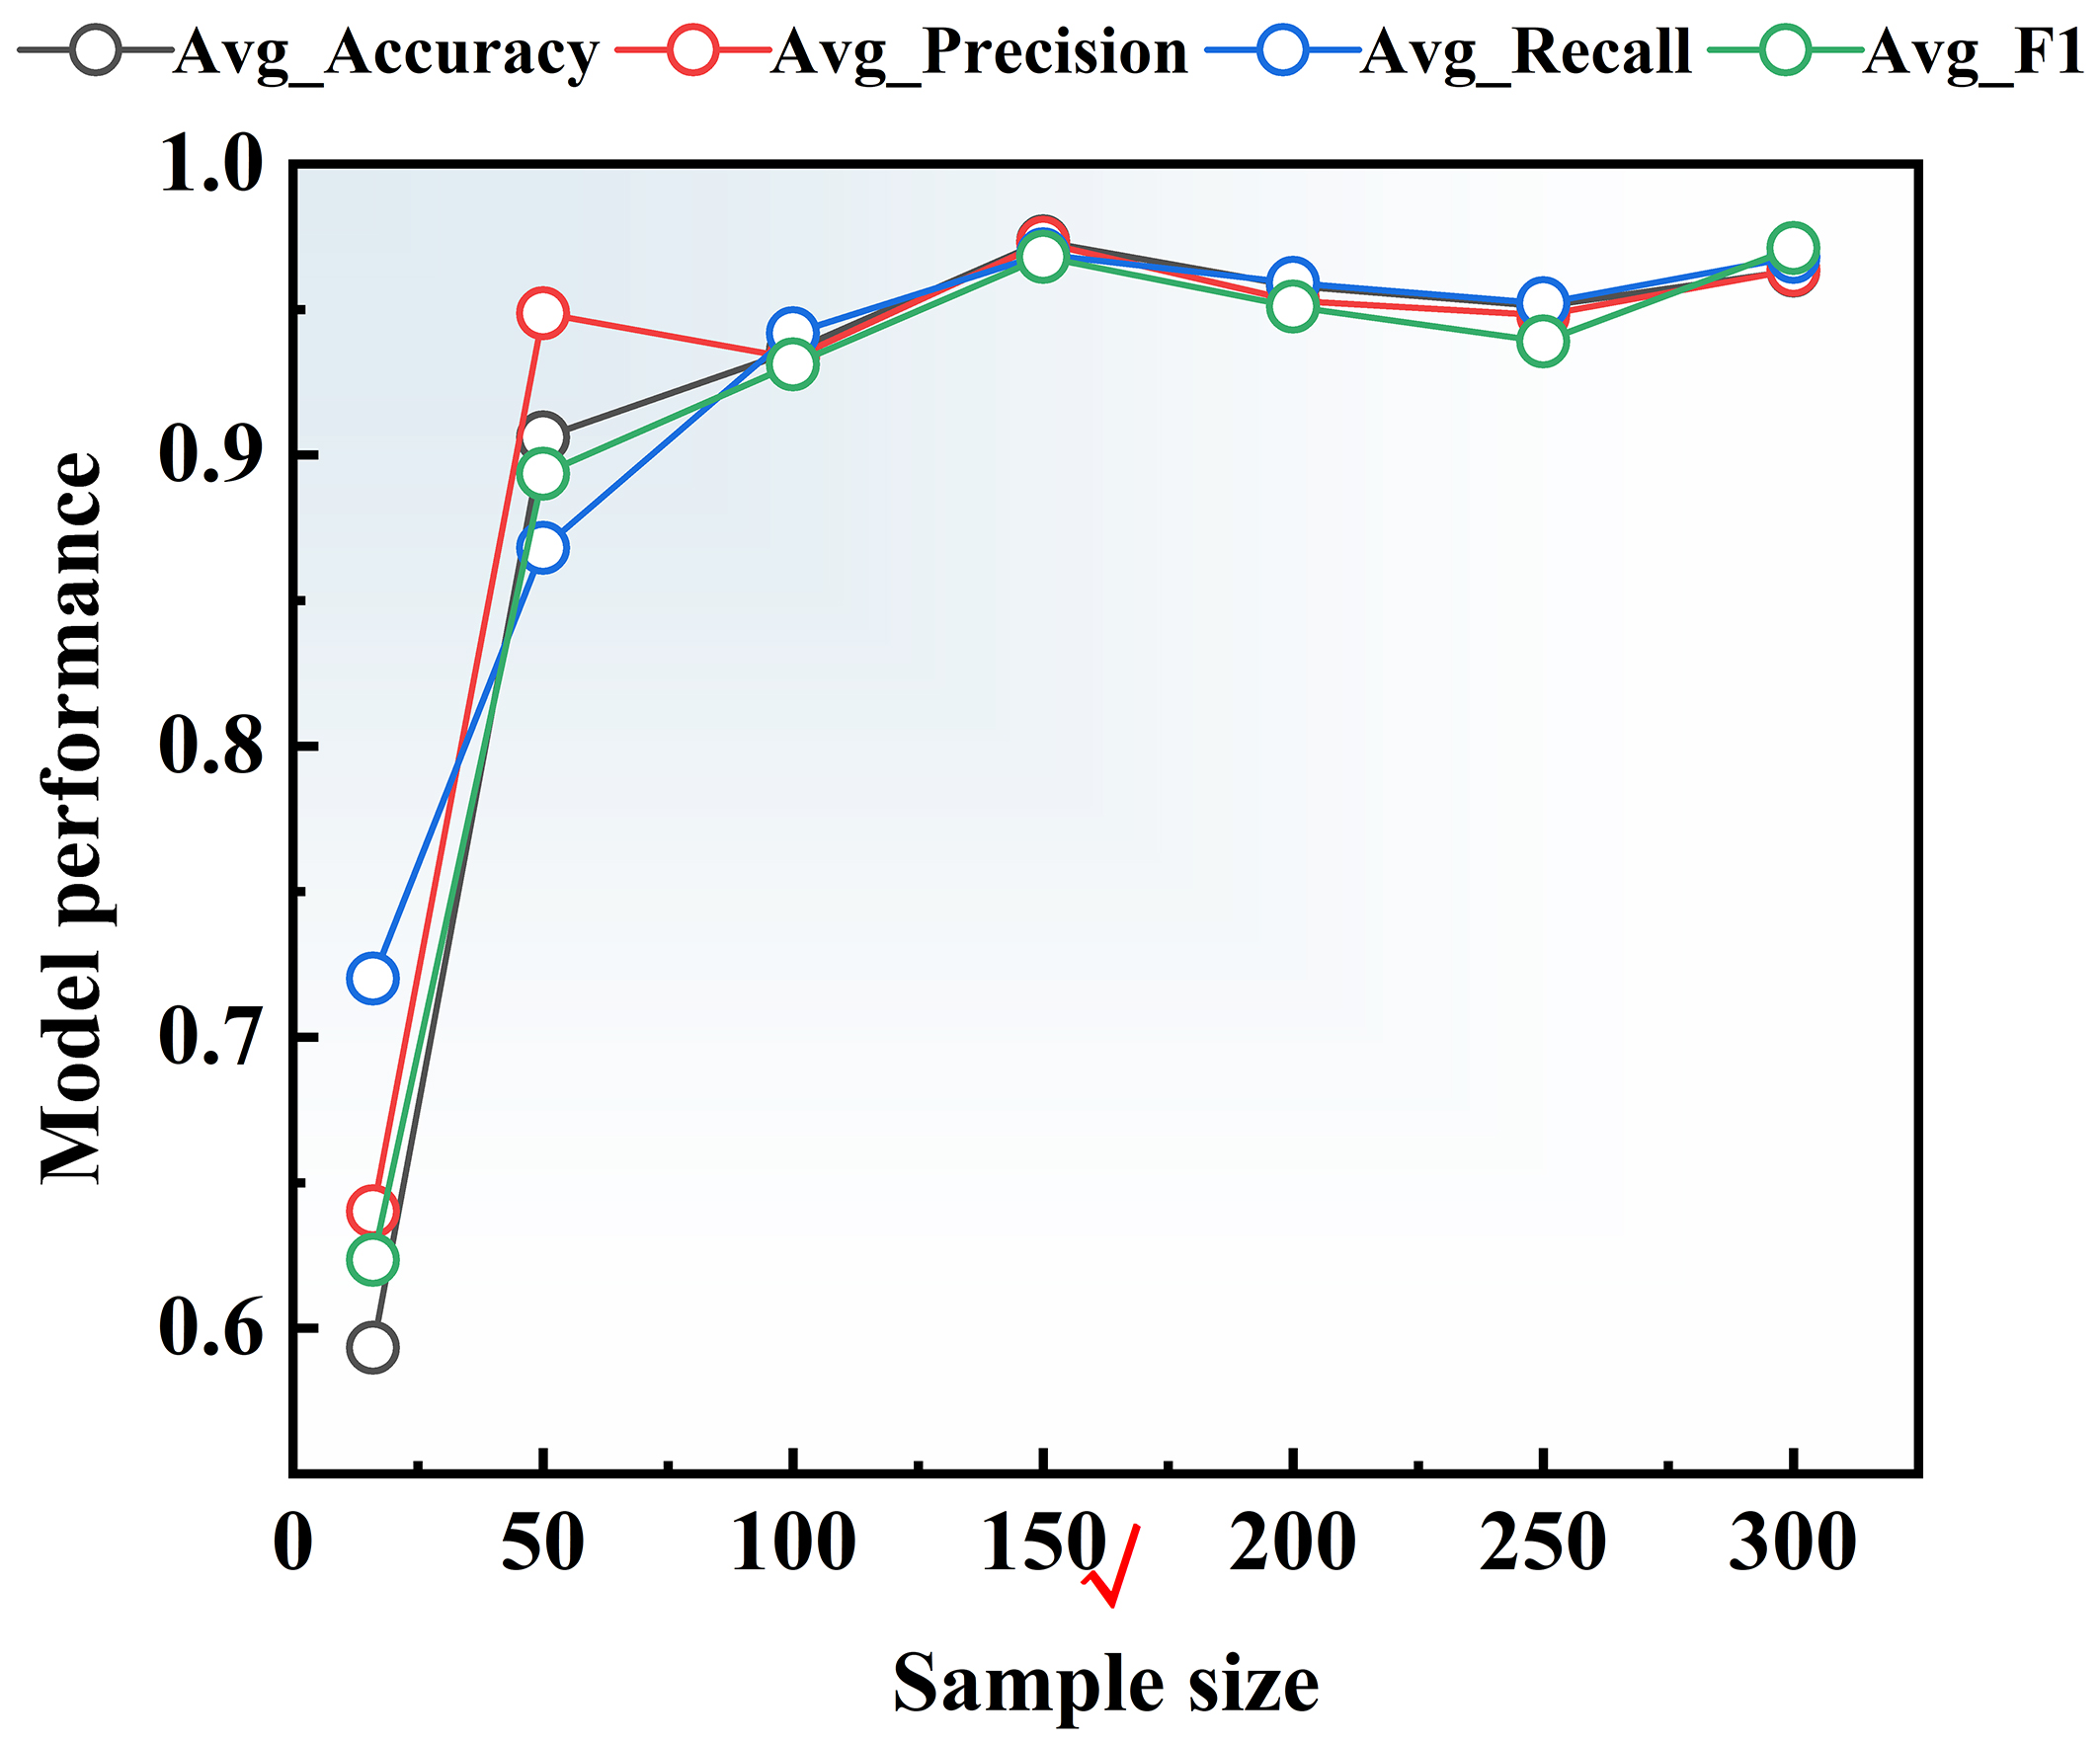
Figure 3. Model performance chart of the test set after modeling 100 times with different numbers of samples.
To address variations in scale across the features, the dataset underwent normalization. Subsequently, polar plots representing all feature variables were created both prior to and following data augmentation to facilitate visualization. Figure 4 shows the polar plots before (16 samples) and after (150 samples) data augmentation. The Ni/Si weight ratio was calculated from the Ni and Si contents and used as a compositional constraint during data augmentation. It is included in the polar plots to characterize the compositional distribution but was not treated as an additional predictor. Both the machine learning models used only Ni, Si, CR, and AT as input features. Figure 4A presents the distribution of the original data prior to augmentation. Although the dataset constructed using the L16 orthogonal array contains a limited number of samples, it defines the principal variation ranges of Ni and Si contents and the processing parameters CR and AT. The orthogonal experimental design systematically covers combinations of multiple factors and levels with a substantially reduced number of experiments, thereby providing comprehensive experimental information at relatively low cost and with high experimental efficiency. Moreover, the orthogonal array exhibits inherent balance and a well-defined structure, with each factor and its corresponding levels uniformly represented throughout the experimental design, thereby effectively mitigating data imbalance. Nevertheless, orthogonal design remains intrinsically a sparse sampling strategy, characterized by a discrete distribution of sample points. Such sparsity precludes continuous and sufficiently dense coverage of the high-dimensional feature space, resulting in relatively large inter-sample distances and limited data diversity, which may hinder the ability of machine-learning models to capture complex nonlinear relationships. In contrast, Figure 4B illustrates the sample distribution after data augmentation. Compared with the original dataset, the augmented dataset contains additional samples distributed within the existing feature ranges, introducing local variations in alloy composition and processing parameters. Meanwhile, the overall distributional characteristics of the original samples are largely retained. These observations indicate that the augmentation procedure enriches the representation of local variations within the original composition-processing domain, providing additional samples for subsequent model training.
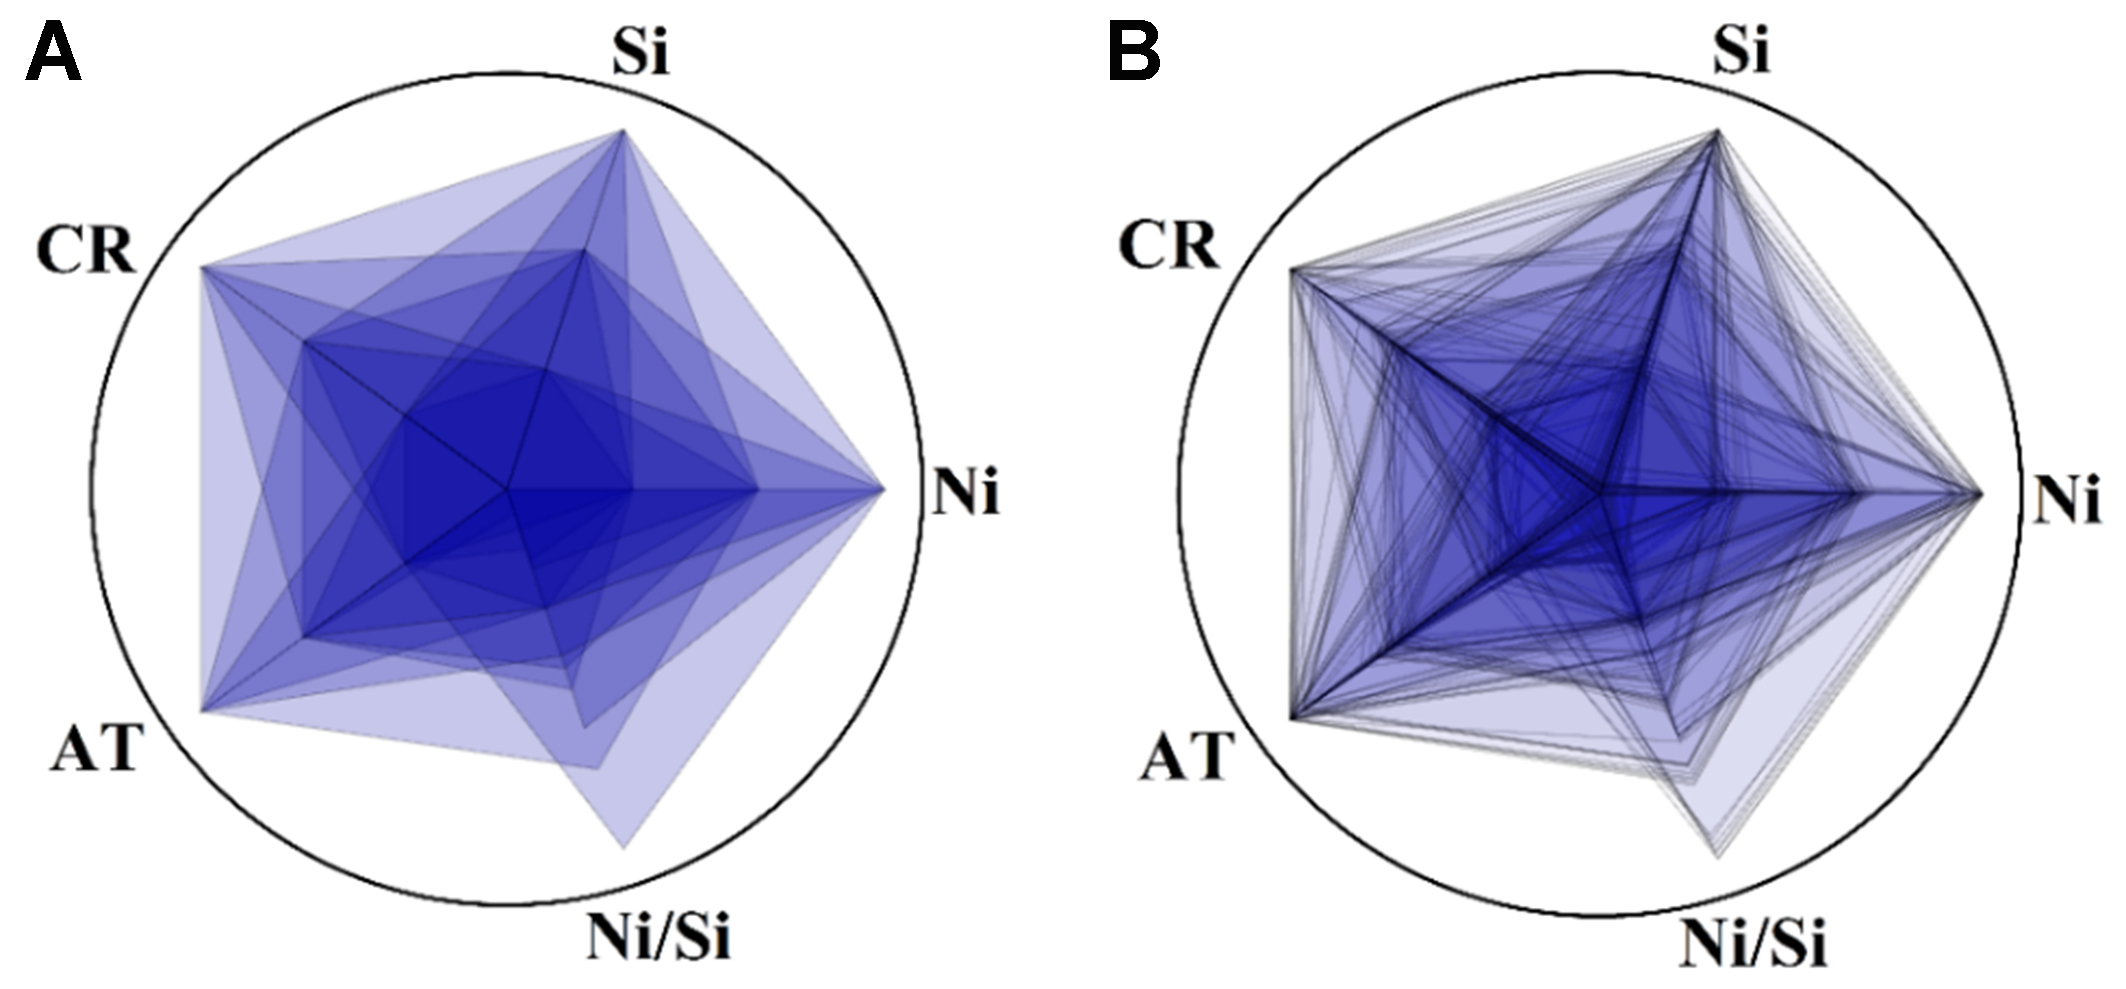
Figure 4. Polar plots of feature distributions (A) before (16 samples) and (B) after (150 samples) data augmentation. CR: Cold-rolling reduction; AT: aging temperature.
Development of a predictive model for discontinuous precipitation behavior in Cu-Ni-Si alloy
Performance assessment of the machine learning model
Following data augmentation to 150 samples, machine-learning classification models were constructed using ANN, DT, RF, GBDT, KNN, and SVC algorithms. The dataset was randomly partitioned into train and test sets at a ratio of 4:1 over 100 independent runs. For each partition, model hyperparameters were optimized through grid search combined with five-fold cross-validation on the train set. Accuracy, Precision, Recall, and F1-score were subsequently evaluated on the corresponding test set. The distributions of these metrics over the 100 runs were used to assess the predictive accuracy and stability of each model. Figure 5 presents violin plots of the four test-set performance metrics from 100 independent runs using different algorithms. The red triangle and diamond markers represent the mean and minimum values, respectively, while the red crosshatched marker indicates the interval encompassing approximately 90% of the data points.
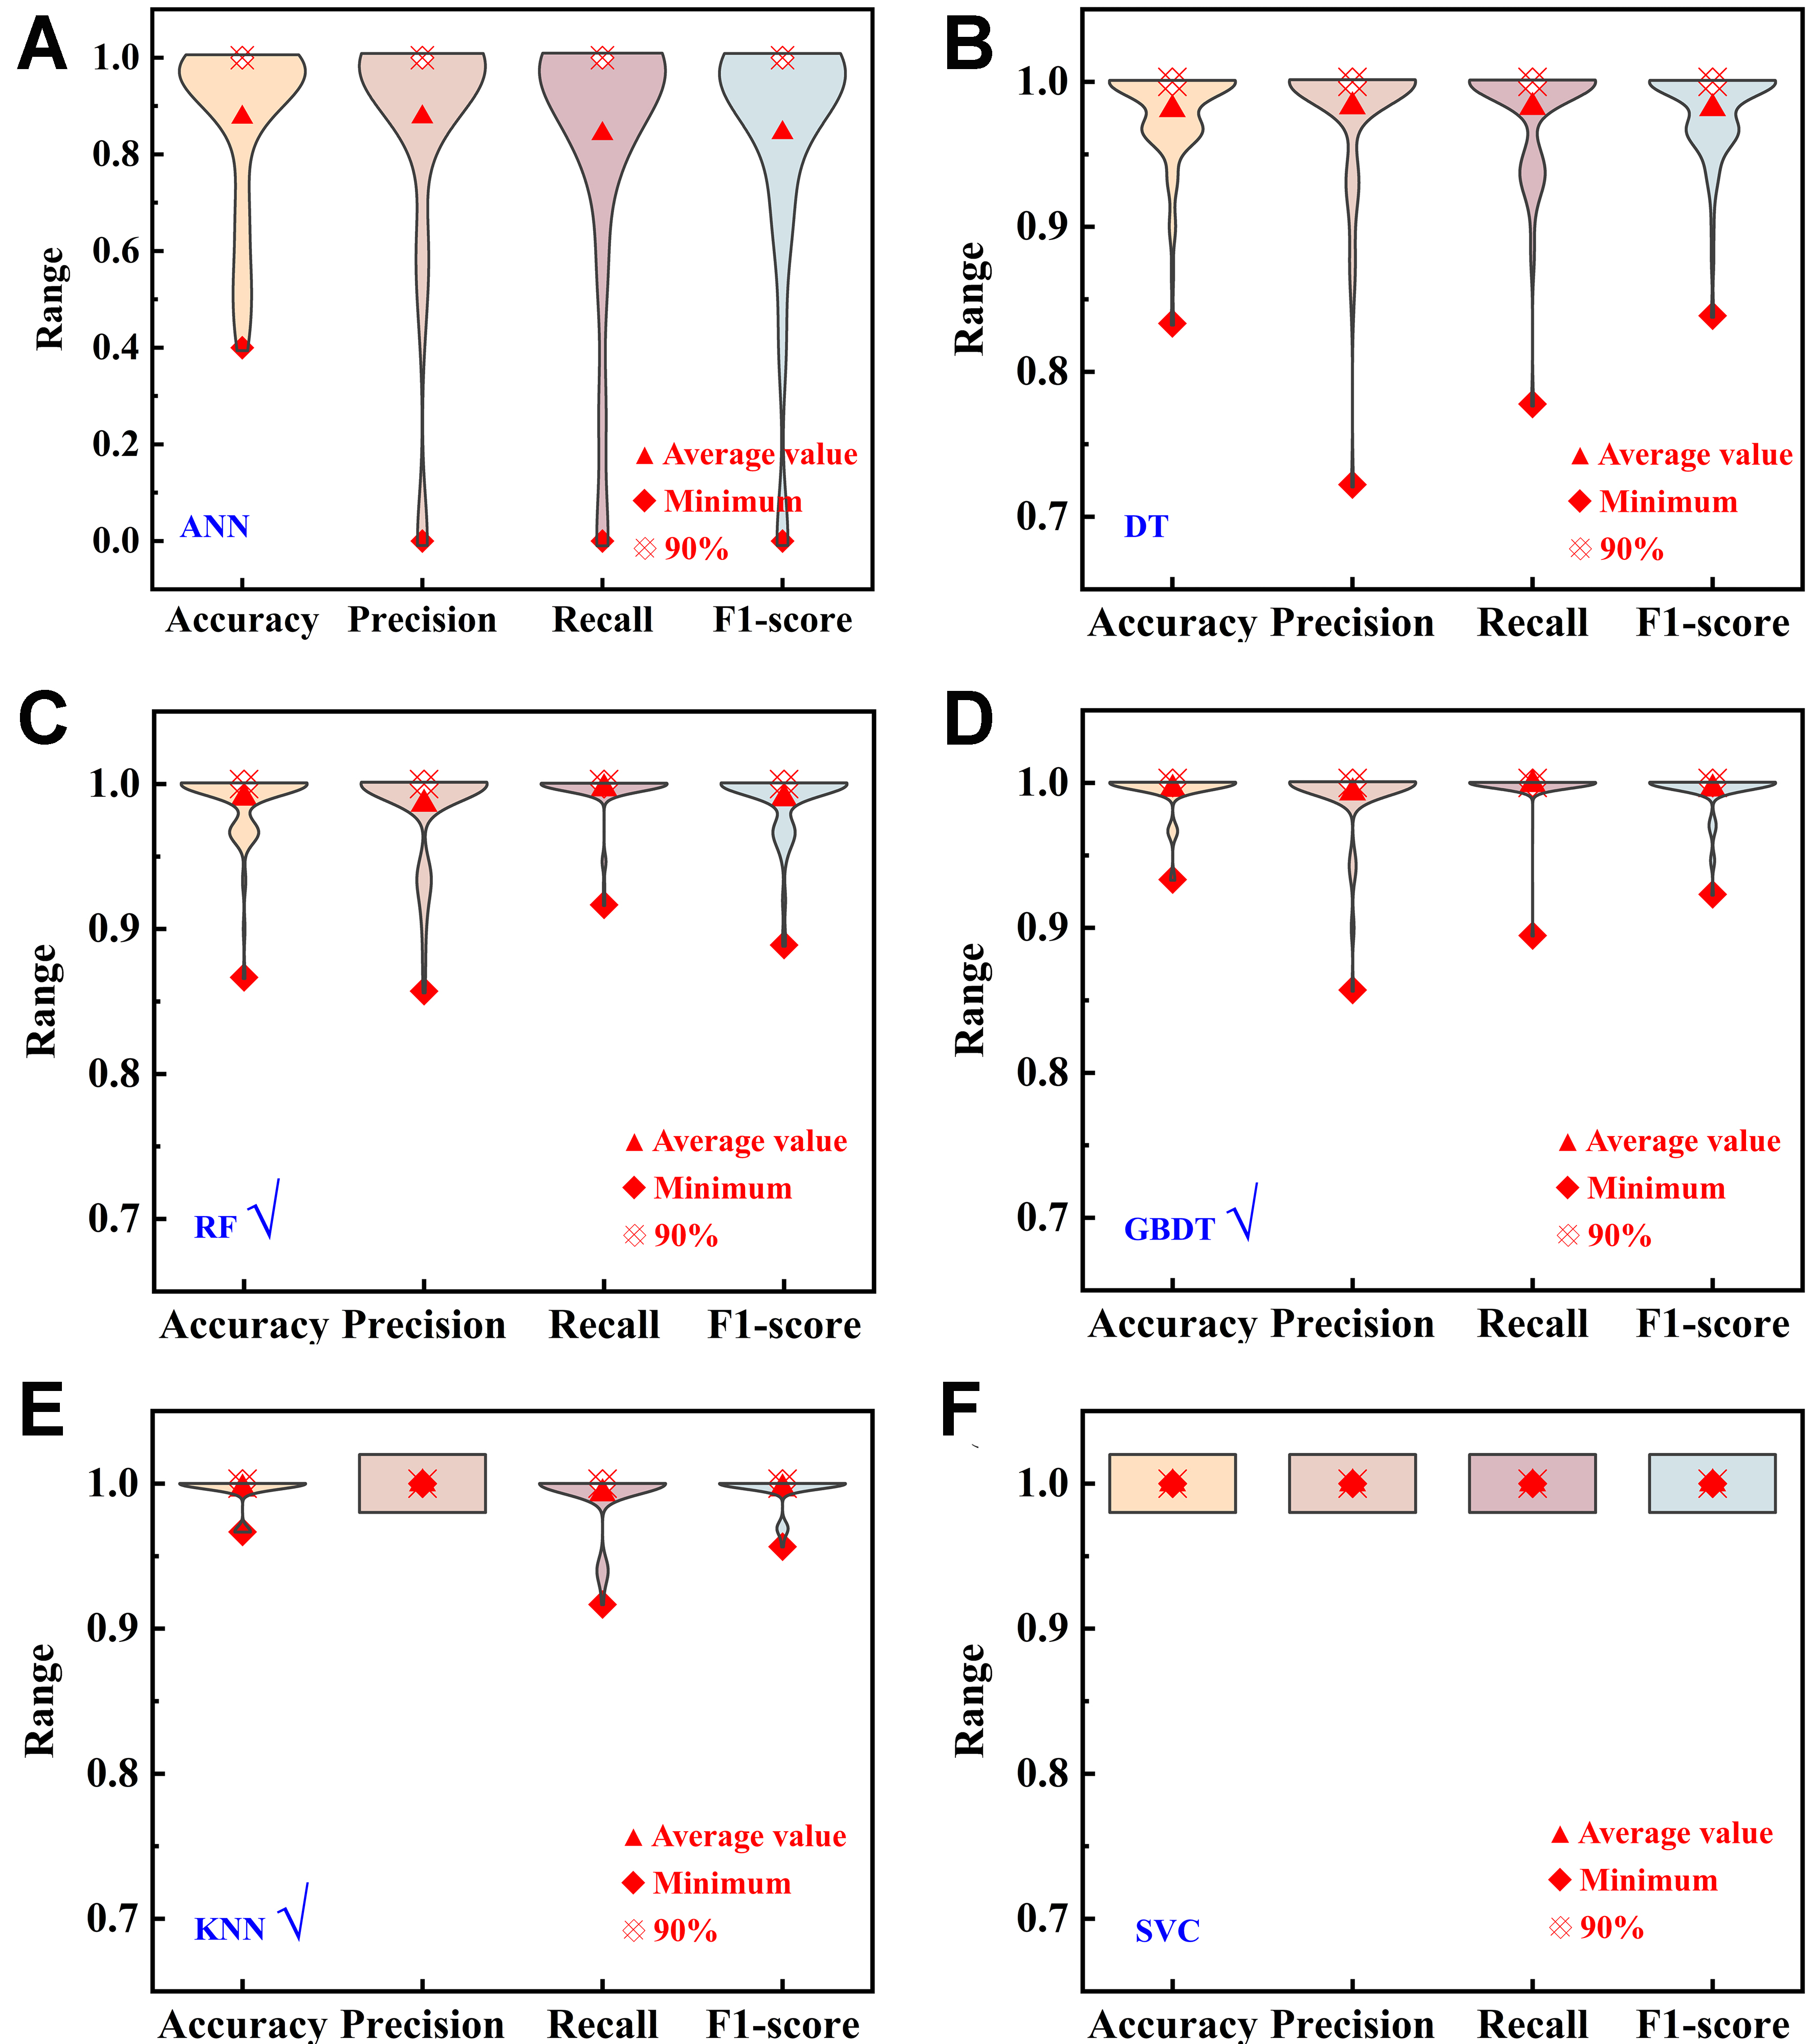
Figure 5. The comparison of the test set performance of six classification models: (A) ANN; (B) DT; (C) RF; (D) GBDT; (E) KNN; and (F) SVC. ANN: Artificial neural network; DT: decision tree; RF: random forest; GBDT: gradient boosting decision tree; KNN: K-nearest neighbors classifier; SVC: support vector classification.
Comparison of test-set performance in Figure 5 shows that the RF, GBDT, and KNN algorithms exhibit consistently high predictive accuracy and stability. By contrast, the SVC algorithm achieves a predictive accuracy of 1.0 ± 0 over 100 independent modeling runs, indicating apparently perfect and highly stable classification performance. However, in the context of data augmentation, such anomalously stable zero-error predictions may arise from overfitting to the feature distribution of the augmented samples. Specifically, the model may preferentially capture local similarities among augmented samples, while its generalization capability to unseen data remains uncertain. Therefore, SVC was not adopted for subsequent prediction. Further modeling results demonstrate that the proposed data augmentation strategy effectively increases sample diversity and facilitates improved model generalizability, thereby establishing a robust data basis for visualizing discontinuous precipitation behavior across the composition-processing parameter space of Cu-Ni-Si alloy.
Development and evaluation of a predictive model for discontinuous precipitation
The Cu-Ni-Si alloy dataset generated using the data augmentation strategy described above comprises 150 samples, each characterized by alloy composition (Ni and Si contents), processing (CR and AT), with the occurrence of discontinuous precipitation defined as the target variable. All input features were standardized to eliminate the influence of differences in feature scales on model training. RF, GBDT, and KNN, which exhibited high predictive accuracy and stability, were selected as the base learners. To improve the robustness and reliability of prediction, the dataset was randomly partitioned into train (80%) and test (20%) sets over 100 independent runs. In each run, the hyperparameters of RF, GBDT, and KNN were independently optimized, followed by model training and evaluation on the test set using Accuracy, Precision, Recall, and F1-score. In addition, each base learner generated a class probability for each sample, representing the probability of discontinuous precipitation occurrence.
To further improve predictive reliability and integrate the complementary strengths of different models, a soft-voting ensemble (SVE) strategy was employed to combine the RF, GBDT, and KNN base learners, thereby enhancing the discriminative capability near the classification boundary and improving model generalizability. Specifically, the predicted probabilities obtained from RF, GBDT, and KNN for each sample were averaged to yield the voting probability for each run. The voting probabilities over 100 independent runs were subsequently averaged to obtain the overall ensemble probability, PSVE, as defined below:
where, PRFi, PGBDTi and PKNNi denote the predicted probabilities of discontinuous precipitation obtained from the RF, GBDT, and KNN models, respectively, in the i-th modeling run. The above approach exploits the complementary predictive characteristics of the individual models, while repeated modeling over 100 independent runs reduces the influence of stochastic variability on the prediction results, thereby yielding more robust and reliable predictions. The SVE performance metrics were calculated separately on the corresponding held-out test set in each run. Figure 6 compares the test set performance of the individual and ensemble models. Following SVE integration, the mean values of Accuracy, Precision, Recall, and F1-score are further improved, accompanied by reduced variability, with a predictive accuracy of 0.98 ± 0.01. It demonstrates that the SVE strategy further improves both the predictive accuracy and stability of the classification model.
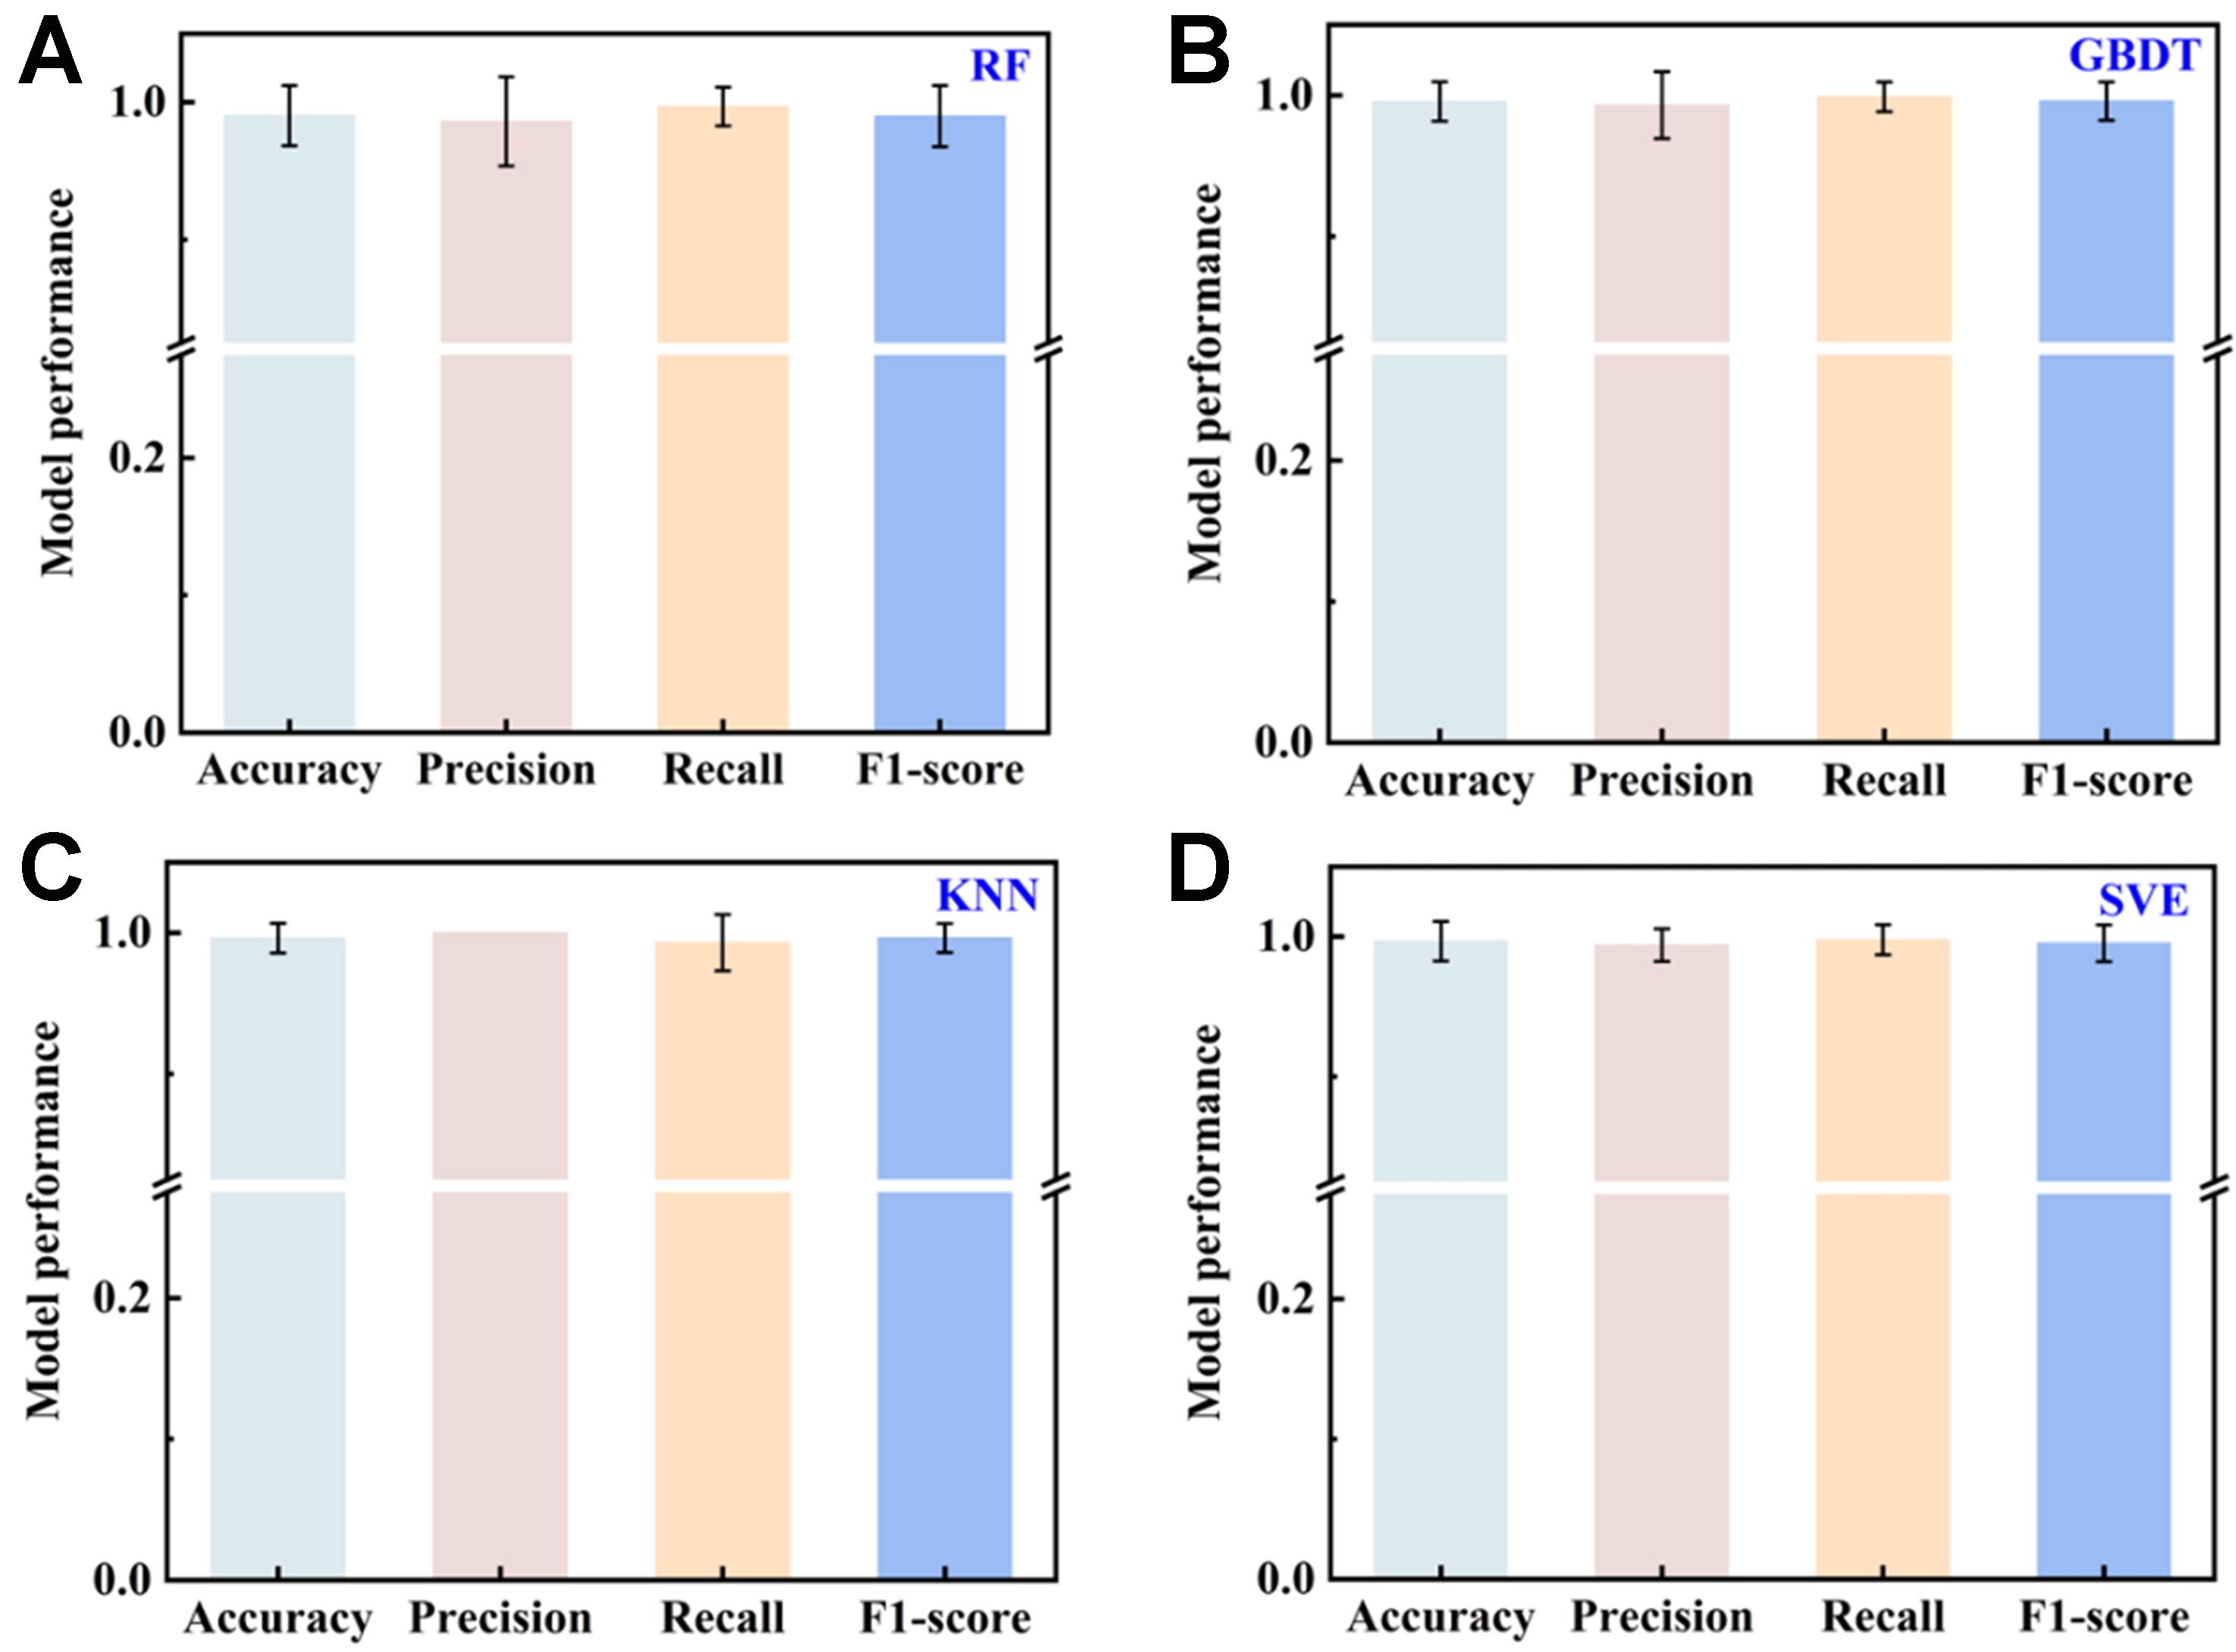
Figure 6. Comparison of the test-set performance of four classification models over 100 independent modeling runs: (A) RF; (B) GBDT; (C) KNN; and (D) SVE. Model performance was evaluated using four metrics: Accuracy, Precision, Recall, and F1-score (the bars represent the mean values obtained from 100 independent runs, while the error bars indicate the corresponding standard deviations). RF: Random forest; GBDT: gradient boosting decision tree; KNN: K-nearest neighbors classifier; SVE: soft-voting ensemble.
To thoroughly investigate the effects of compositional and processing parameters on the discontinuous precipitation behavior of Cu-Ni-Si alloy, prediction grids were established within a high-dimensional feature space encompassing Ni content (3.0-6.0 wt.%), Si content (0.7-1.43 wt.%), CR ratio (60%-90%) and AT (425-500 °C). The above grid data were standardized prior to being input into a pre-trained machine learning model, which subsequently generated the corresponding probability distributions of discontinuous precipitation behavior. The contour corresponding to a predicted probability of 0.5 was subsequently extracted as the critical decision boundary separating the occurrence and absence of discontinuous precipitation, thereby establishing a visual map of discontinuous precipitation behavior across the composition-processing parameter space, as shown in Figure 7. Figure 7 presents the predicted occurrence of discontinuous precipitation across the composition-processing parameter space obtained using the SVE modeling strategy. Two-dimensional Ni-Si contour maps were constructed at selected CR and AT sections, with the color scale representing the predicted probability of discontinuous precipitation. The contour maps represent model predictions across the Ni-Si composition range at fixed CR-AT combinations, rather than direct experimental measurements throughout this space. The original orthogonal experimental data points are marked with black circles. The transition from blue to red corresponds to an increasing probability of discontinuous precipitation for alloys with different compositions under identical processing conditions. Furthermore, Thermo-Calc calculations of the Cu-Ni-Si ternary isothermal sections indicate that, when the Ni/Si weight ratio lies within approximately 2.5-7, the alloy system satisfies the thermodynamic conditions for Ni2Si precipitation (details of the thermodynamic calculations are given in Supplementary Figure 1). Accordingly, lines corresponding to Ni/Si weight ratios of 2.5 and 7 were superimposed on the Ni-Si contour maps and are indicated in red and orange, respectively. As Cu-Ni-Si alloys are precipitation-strengthened copper alloys in which Ni2Si serves as the principal strengthening phase, the Ni/Si atomic ratio is commonly designed to be approximately 2.0 (corresponding to a weight ratio of approximately 4.2) to promote sufficient Ni2Si precipitation. Consequently, the Ni/Si ratio of 4.2 was also included in Figure 7 and is represented by the green line. In this work, the curve with a prediction probability of 0.5 is defined as the boundary for classifying discontinuous precipitation behavior, referred to as the decision boundary, as shown by the black curve in Figure 7. In binary probabilistic classification, a threshold of 0.5 represents the decision point at which the model assigns equal probabilities to the occurrence and absence of discontinuous precipitation. Accordingly, the 0.5 probability curve is defined as the classification boundary, which intuitively delineates the effects of alloy composition and processing parameters on the transition in discontinuous precipitation behavior, thereby providing a scientific basis for experimental design and microstructural control.
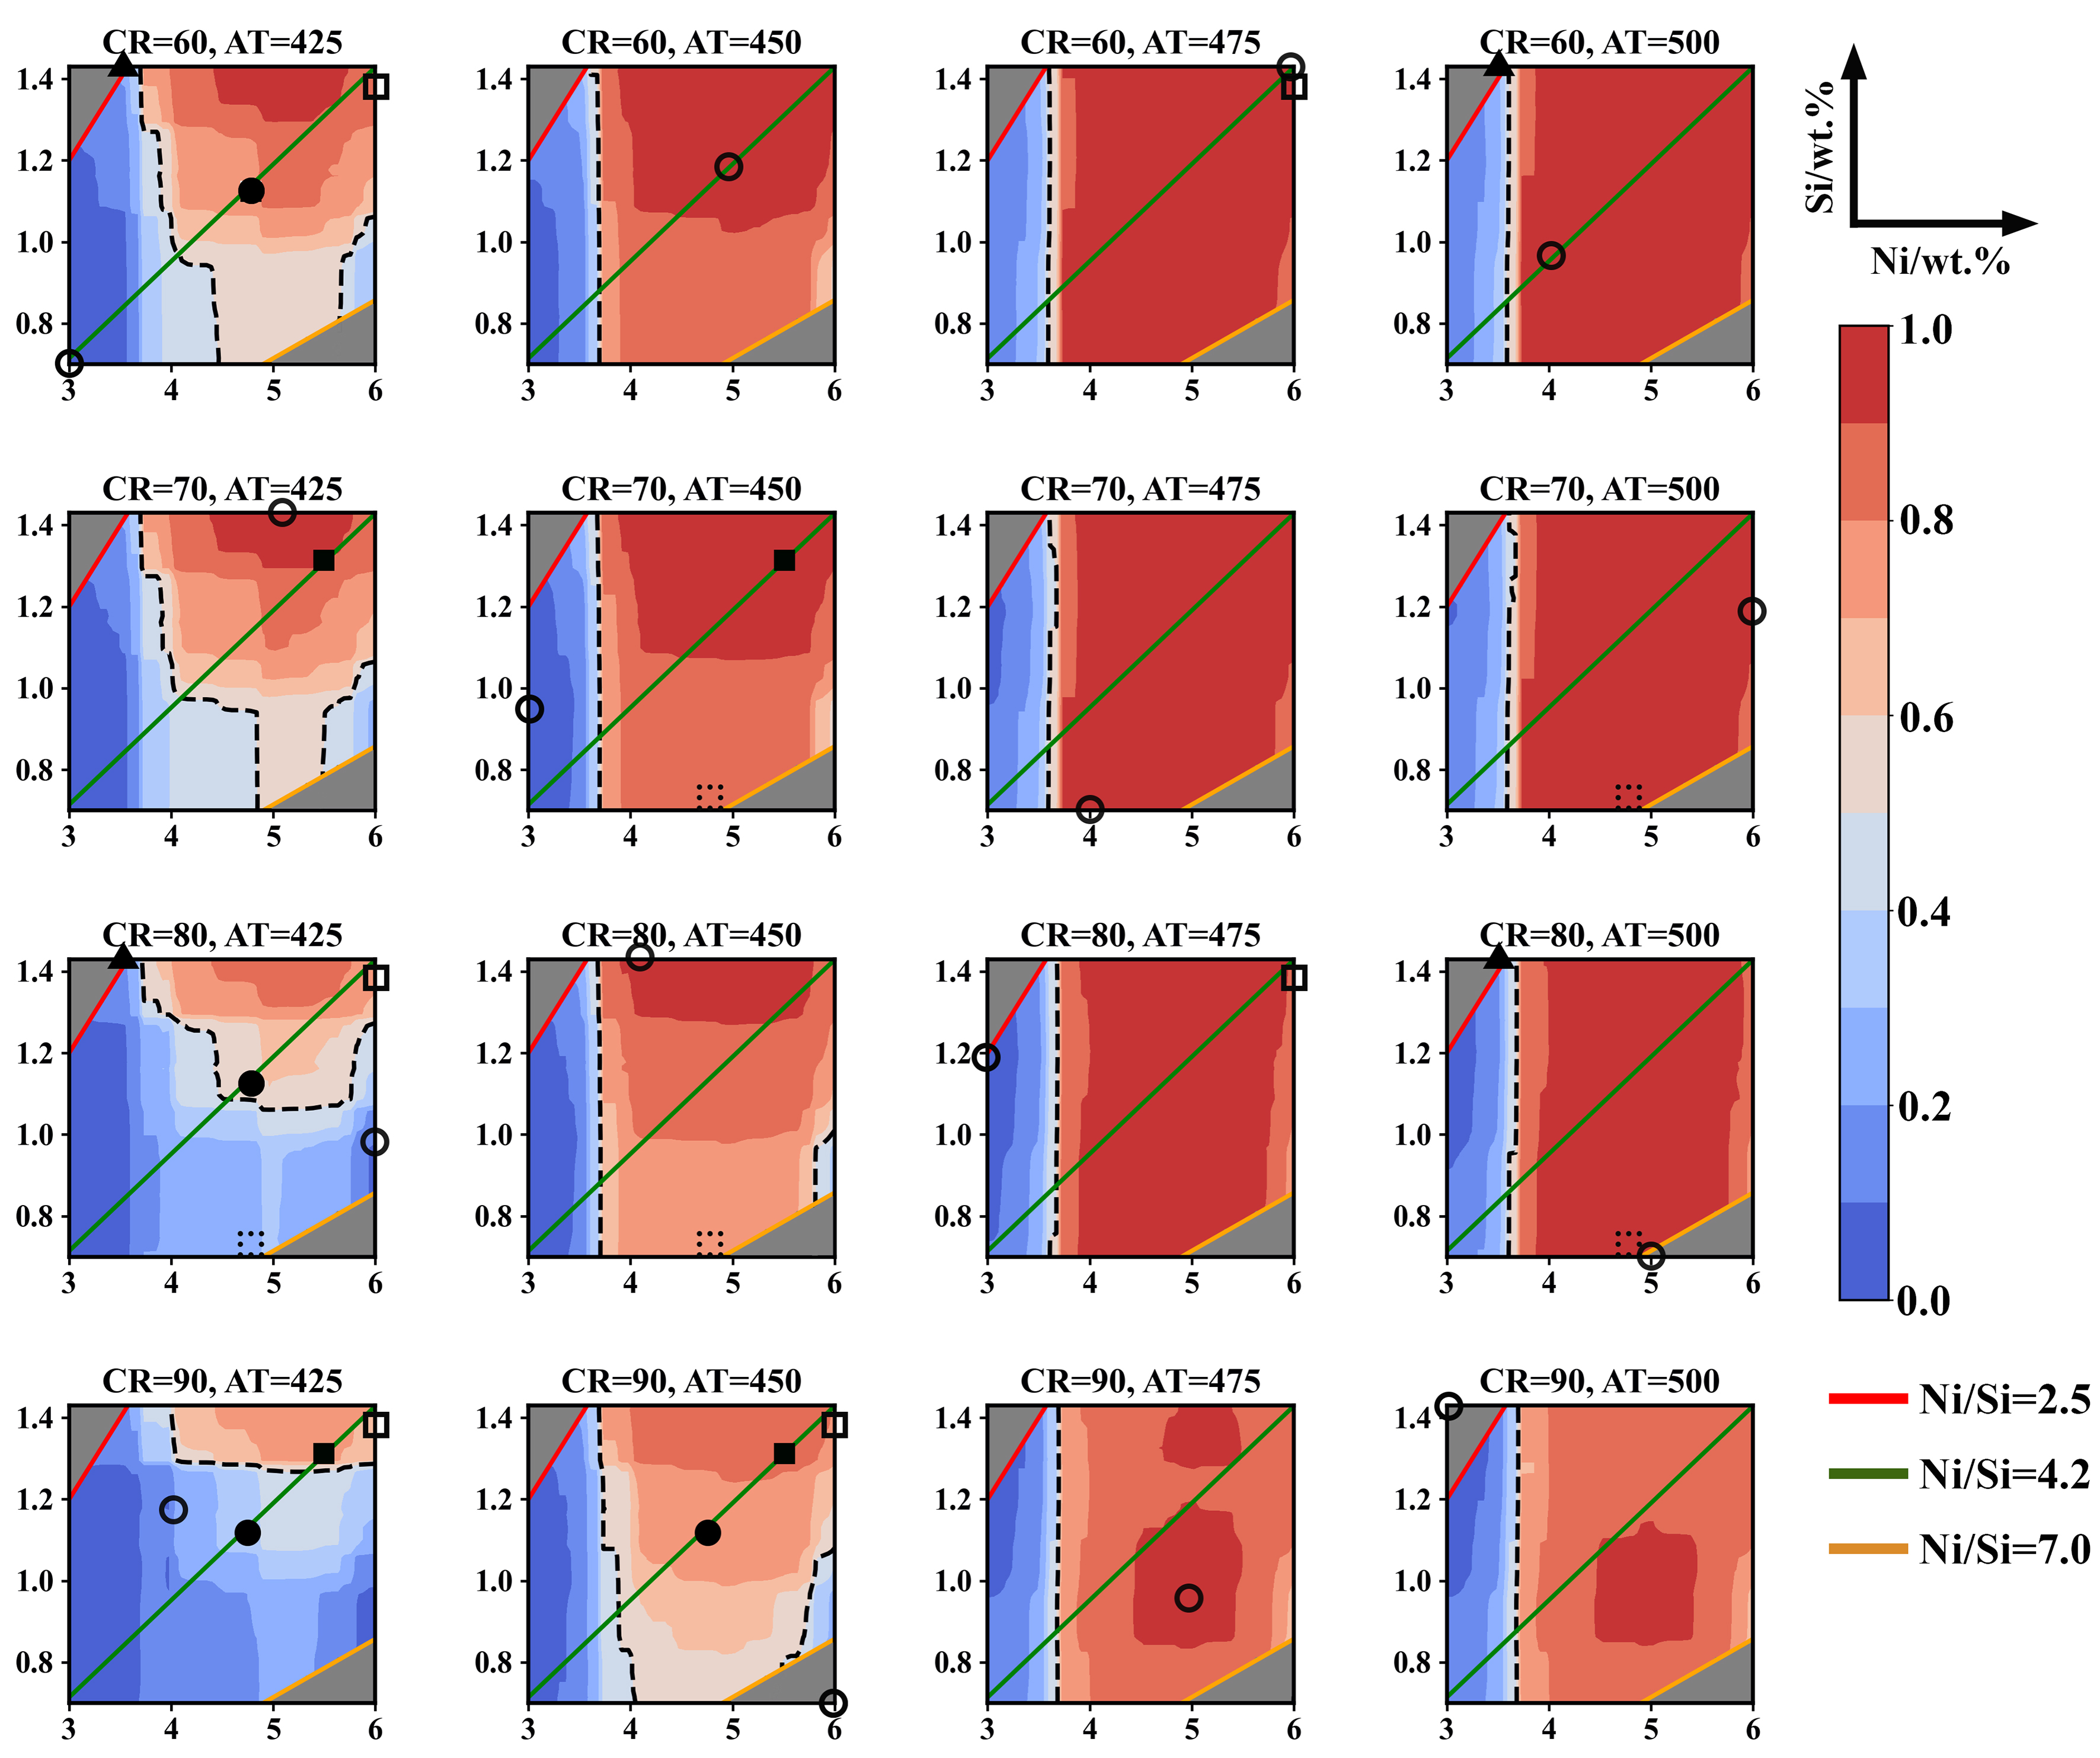
Figure 7. Two-dimensional contour maps of the DPs occurrence probability in the composition-processing variable space. The black circles represent the orthogonal experimental data points, while the other symbols represent the experimental validation results, with their corresponding alloy compositions listed in Table 1. DPs: Discontinuous precipitates; CR: cold-rolling reduction; AT: aging temperature.
To validate the accuracy and practical applicability of the model-derived decision boundary, several representative composition-processing conditions located on and near the decision boundary were selected for experimental verification. Table 1 summarizes the experimental validation results for the occurrence or absence of discontinuous precipitation under different composition-processing conditions (the corresponding SEM observations are presented in Supplementary Figure 3). The experimental validation combinations were determined based on the decision boundary, Ni/Si weight ratio, and total Ni+Si content, as summarized in Table 1, with the corresponding conditions distinguished by color in Figure 7. The consistency between the predicted and validated results substantiates the reliability and generalizability of the established mapping of discontinuous precipitation behavior within the composition-processing space.
Validation results for selected composition-processing combinations at and near the decision boundary
| Composition/wt.% | Ni/Si | CR/% + AT/°C | Predicted results | Observation results |
Cu-6Ni-1.37Si | 4.4 | 90 + 450 | 1 | 1 |
| 90 + 425 | 1 | 1 | ||
| 60 + 425 | 1 | 1 | ||
| 60 + 475 | 1 | 1 | ||
| 80 + 425 | 1 | 1 | ||
| 80 + 475 | 1 | 1 | ||
Cu-3.55Ni-1.42Si | 2.5 | 60 + 425 | 0 | 0 |
| 60 + 500 | 0 | 0 | ||
| 80 + 425 | 0 | 0 | ||
| 80 + 500 | 0 | 0 | ||
Cu-4.84Ni-0.74Si | 6.5 | 80 + 500 | 1 | 1 |
| 80 + 425 | 0 | 0 | ||
| 80 + 450 | 1 | 1 | ||
| 70 + 450 | 1 | 1 | ||
| 70 + 500 | 1 | 1 | ||
Cu-4.83Ni-1.14Si | 4.24 | 60 + 425 | 1 | 1 |
| 80 + 425 | 1 | 1 | ||
| 90 + 425 | 0 | 0 | ||
| 90 + 450 | 1 | 1 | ||
Cu-5.51Ni-1.31Si | 4.2 | 70 + 425 | 1 | 1 |
| 70 + 450 | 1 | 1 | ||
| 90 + 450 | 1 | 1 | ||
| 90 + 425 | 1 | 1 |
To quantify DPs behavior within the composition-processing space, the support vector regression (SVR) model was established using alloy composition and processing parameters as input variables and the volume fraction of DPs as the target variable. The regression dataset comprised 39 experimental samples, combining the original orthogonal experimental data with volume fraction measurements obtained from experiments conducted to validate the classification model. For SVR model training, the dataset was randomly partitioned into train and test sets at a ratio of 4:1. Following hyperparameter optimization using five-fold cross-validation, the SVR model achieved a coefficient of determination (R2) of 0.99, a mean absolute error (MAE) of 0.10, and a root mean square error (RMSE) of 0.14 on the training set. The corresponding test-set values were 0.98, 0.13, and 0.15, respectively, demonstrating high predictive accuracy and good generalization capability.
Two-dimensional Ni-Si contour maps were subsequently constructed at different CR and AT sections, with the color scale representing the DPs volume fraction. Under identical processing conditions, the color transition from blue to red corresponds to an increase in the DPs volume fraction in the Cu matrix from 0% to 4.1%, as shown in Figure 8. As shown in Figures 7 and 8, the discontinuous precipitation behavior in the Cu-Ni-Si alloy is governed by the coupled effects of composition and processing conditions. Overall, the two contour maps are highly consistent, with regions of high DP occurrence probability generally corresponding to high DP volume fractions. This agreement indicates that the two-dimensional mappings effectively capture the dependence of discontinuous precipitation behavior on the Ni-Si compositional space.
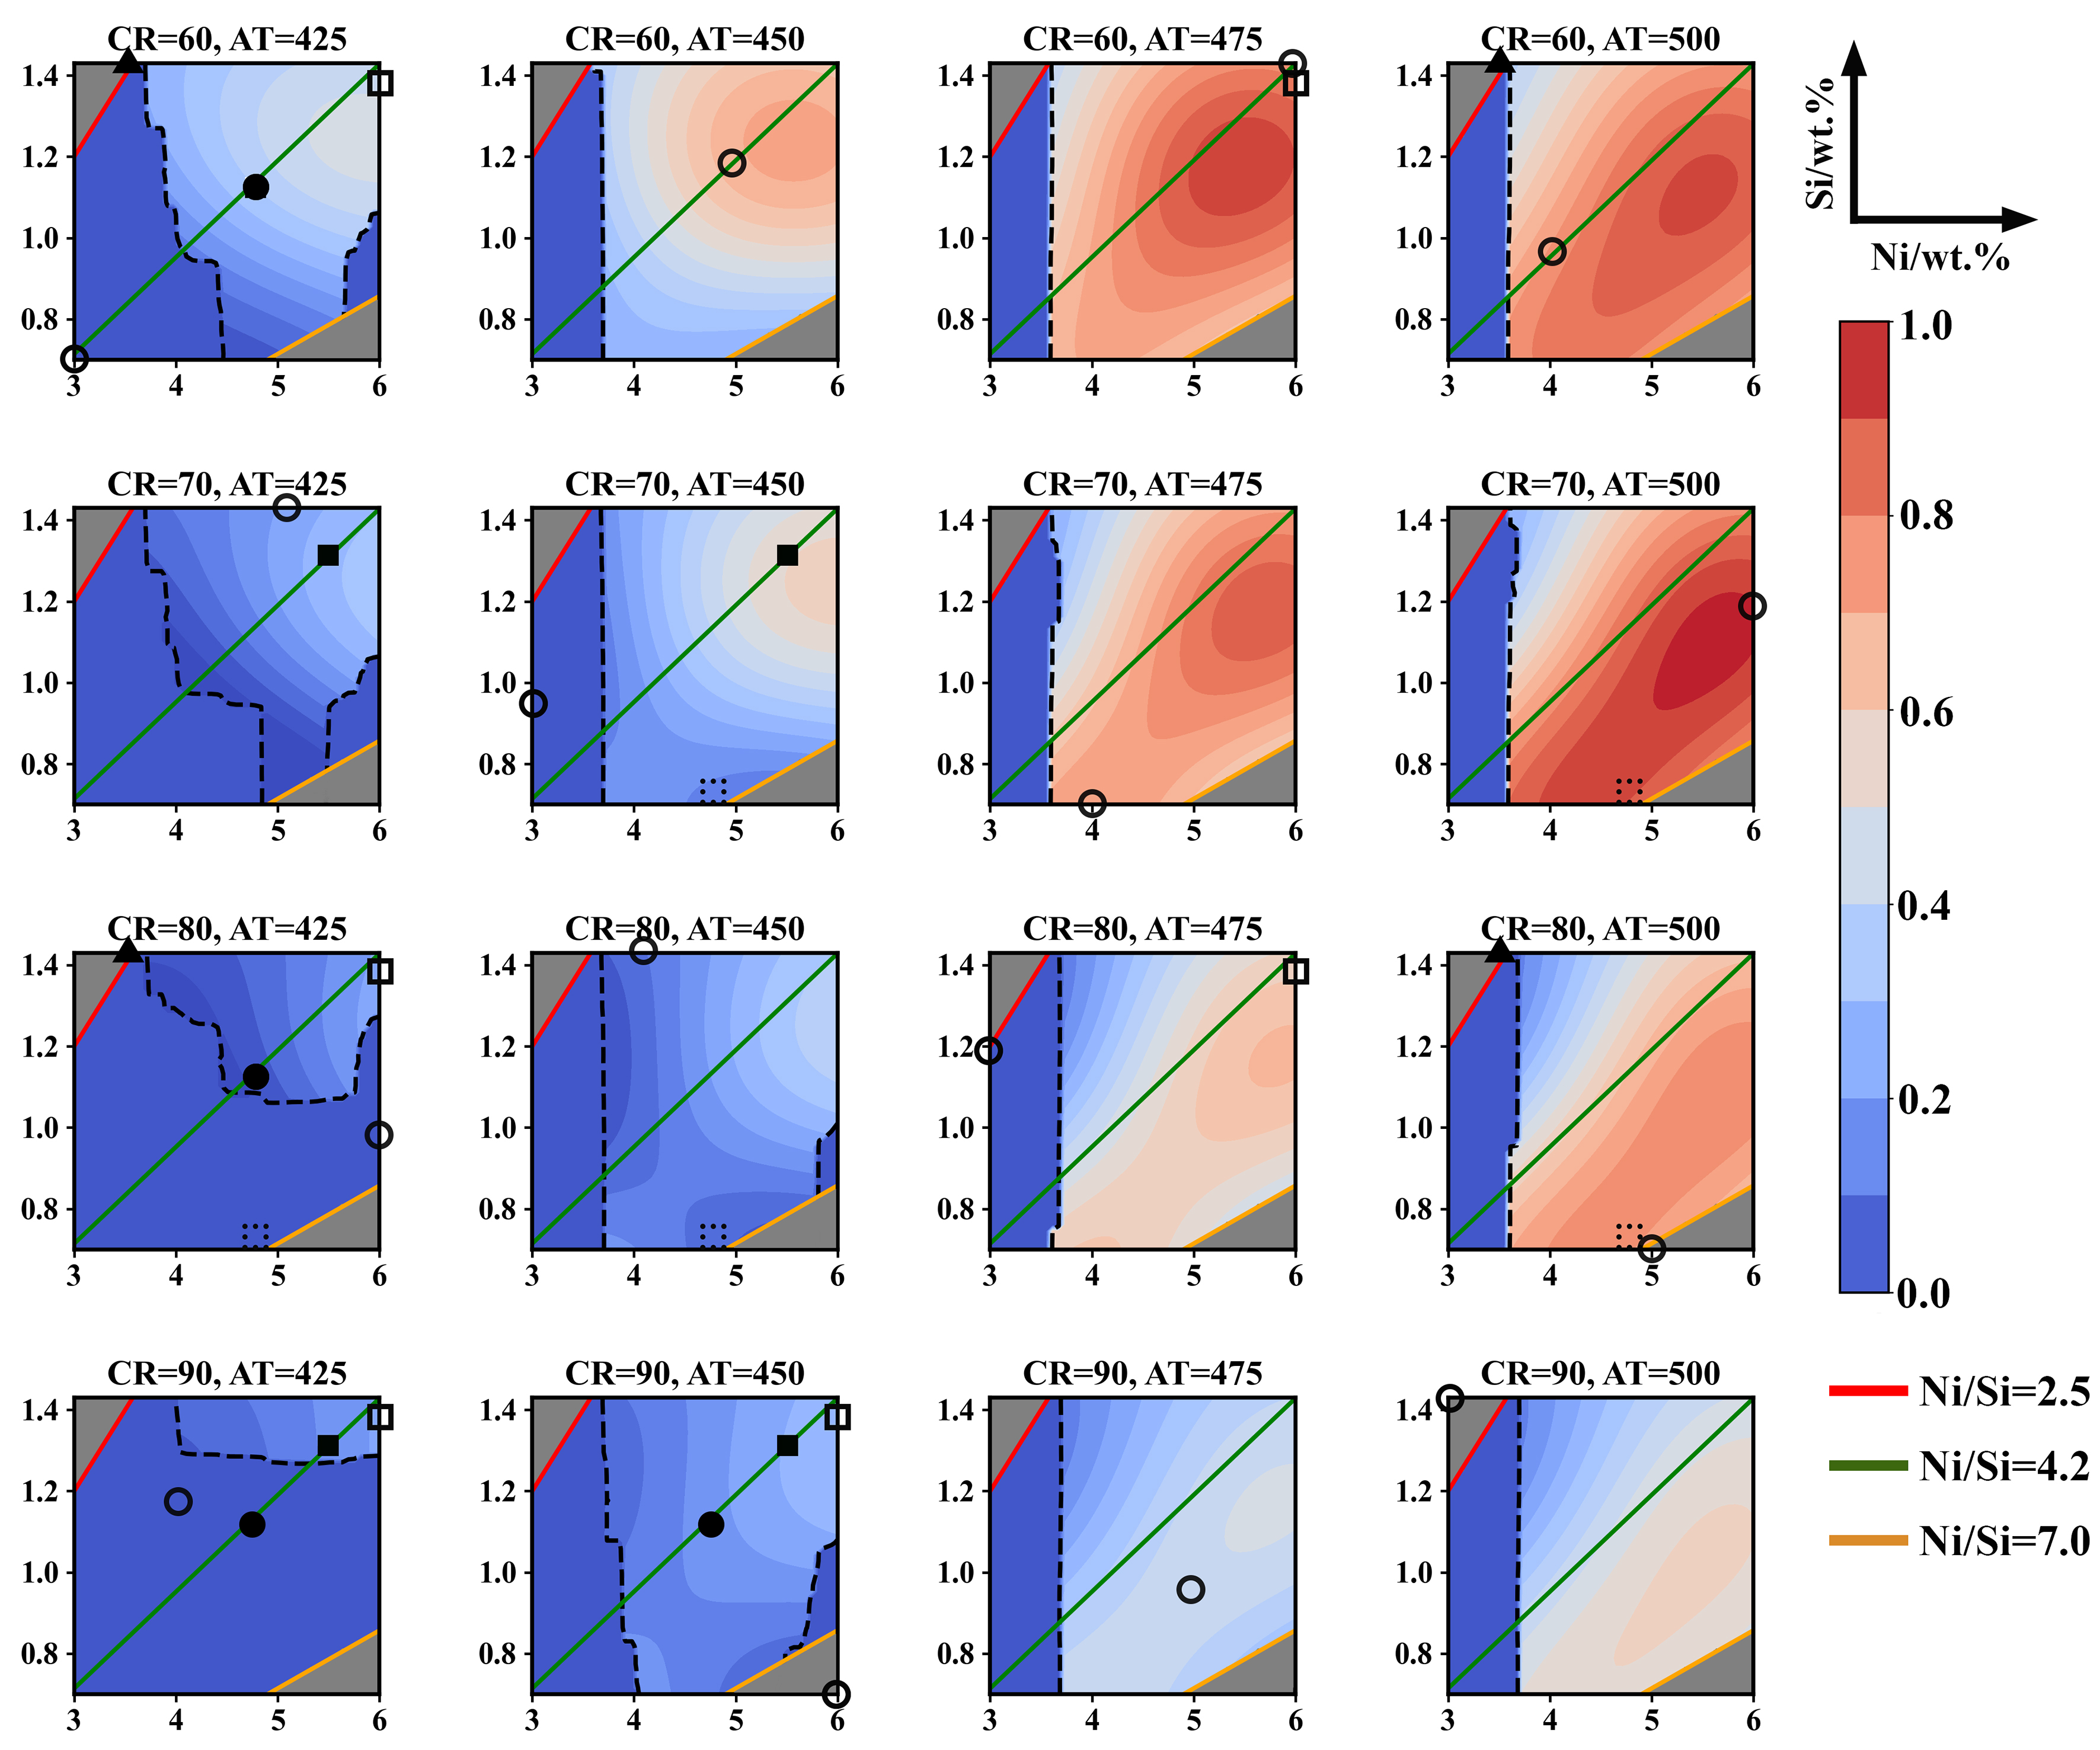
Figure 8. Two-dimensional contour maps of the DPs volume fraction in the composition-processing variable space. The black circles represent the orthogonal experimental data points, while the other symbols represent the experimental validation results, with their corresponding alloy compositions listed in Table 1. DPs: Discontinuous precipitates; CR: cold-rolling reduction; AT: aging temperature.
The overall distribution characteristics reveal a pronounced synergistic effect of Ni and Si contents on DPs behavior. DPs behavior is neither governed by Ni or Si alone nor follows a simple linear variation, but instead exhibits distinct regional distributions within the Ni-Si compositional space. At relatively low Ni contents (< 3.6 wt.%), most regions are represented by blue or light-blue contours, with both the probability of DPs occurrence and the DPs volume fraction approaching zero. With further increases in Ni and Si contents, the probability of DP occurrence increases rapidly, accompanied by a pronounced variation in the DPs volume fraction over the range of 0%-4.1%, as manifested by distinct color gradients in the contour maps. The above results indicate that simultaneous increases in Ni and Si contents substantially increase the concentration of supersaturated solutes and the driving force for DP formation, thereby promoting discontinuous precipitation.
Further comparison across different ATs reveals that, as the AT increases from 425 to 500 °C, both the high-probability and high-volume-fraction regions expand markedly over the composition space. This trend indicates that elevated temperatures enhance atomic diffusivity and interface migration kinetics, thereby rendering compositional combinations initially located in the critical region more susceptible to discontinuous precipitation. In contrast, the effect of CR on the distribution of the compositional space is relatively limited. As CR increases from 60% to 90%, the decision boundary of the high-DP region undergoes a certain degree of shift, while the overall distribution trend remains essentially unchanged (the low-Ni and low-Si region consistently exhibits DPs-suppressed characteristics, whereas the intermediate-to-high Ni and Si region retains a pronounced tendency for DPs formation). These results indicate that the Ni-Si composition is the dominant factor governing the occurrence of DPs, whereas CR and AT primarily modulate the extent of DPs formation and the width of the corresponding compositional window. Taking the Cu-4.84Ni-0.74Si alloy in the validation experiments as an example, DPs formation is markedly suppressed under a relatively high degree of CR (e.g., 80% CR) combined with a low AT (425 °C), with CPs predominating in the matrix. By contrast, when the AT is increased to 450 °C or above, enhanced grain-boundary diffusion and atomic mobility promote the occurrence of discontinuous precipitation. In addition, processing conditions that combine a lower degree of CR with a higher AT tend to result in the formation of more DPs.
Distribution of discontinuous precipitation in the Ni-Si compositional space
Drawing upon the joint distribution characteristics of the probability of DPs behavior occurrence and the DPs volume fraction within the Ni-Si two-dimensional contour map (illustrated in Figures 7 and 8), and considering both the high and low probabilities of DP occurrence alongside the observed trends in predicted volume fraction variations, the compositional space within the specified region is categorized into three distinct zones: the DP suppression zone, the DP sensitivity zone, and the DP activity zone (as shown in Figure 9). Specifically, the DP suppressed region is characterized by a low probability of DP occurrence (P ≤ 0.4) and a predicted DP volume fraction approaching zero (fDPs ≈ 0%). The DP-sensitive region represents a transitional regime rather than one in which DPs formation is completely suppressed. Within this region, DPs behavior is highly sensitive to variations in the preset composition and processing parameters, with both the occurrence probability and predicted volume fraction varying markedly with compositional and processing conditions (0 ≤ P ≤ 1, fDPs ≈ 0%-4.1%). In contrast, the DPs active region corresponds to the composition-processing space in which DPs formation is strongly favored, as evidenced by both a high occurrence probability and a relatively high predicted volume fraction (0.6 ≤ P ≤ 1, fDPs ≈ 1.0%-3.5%).
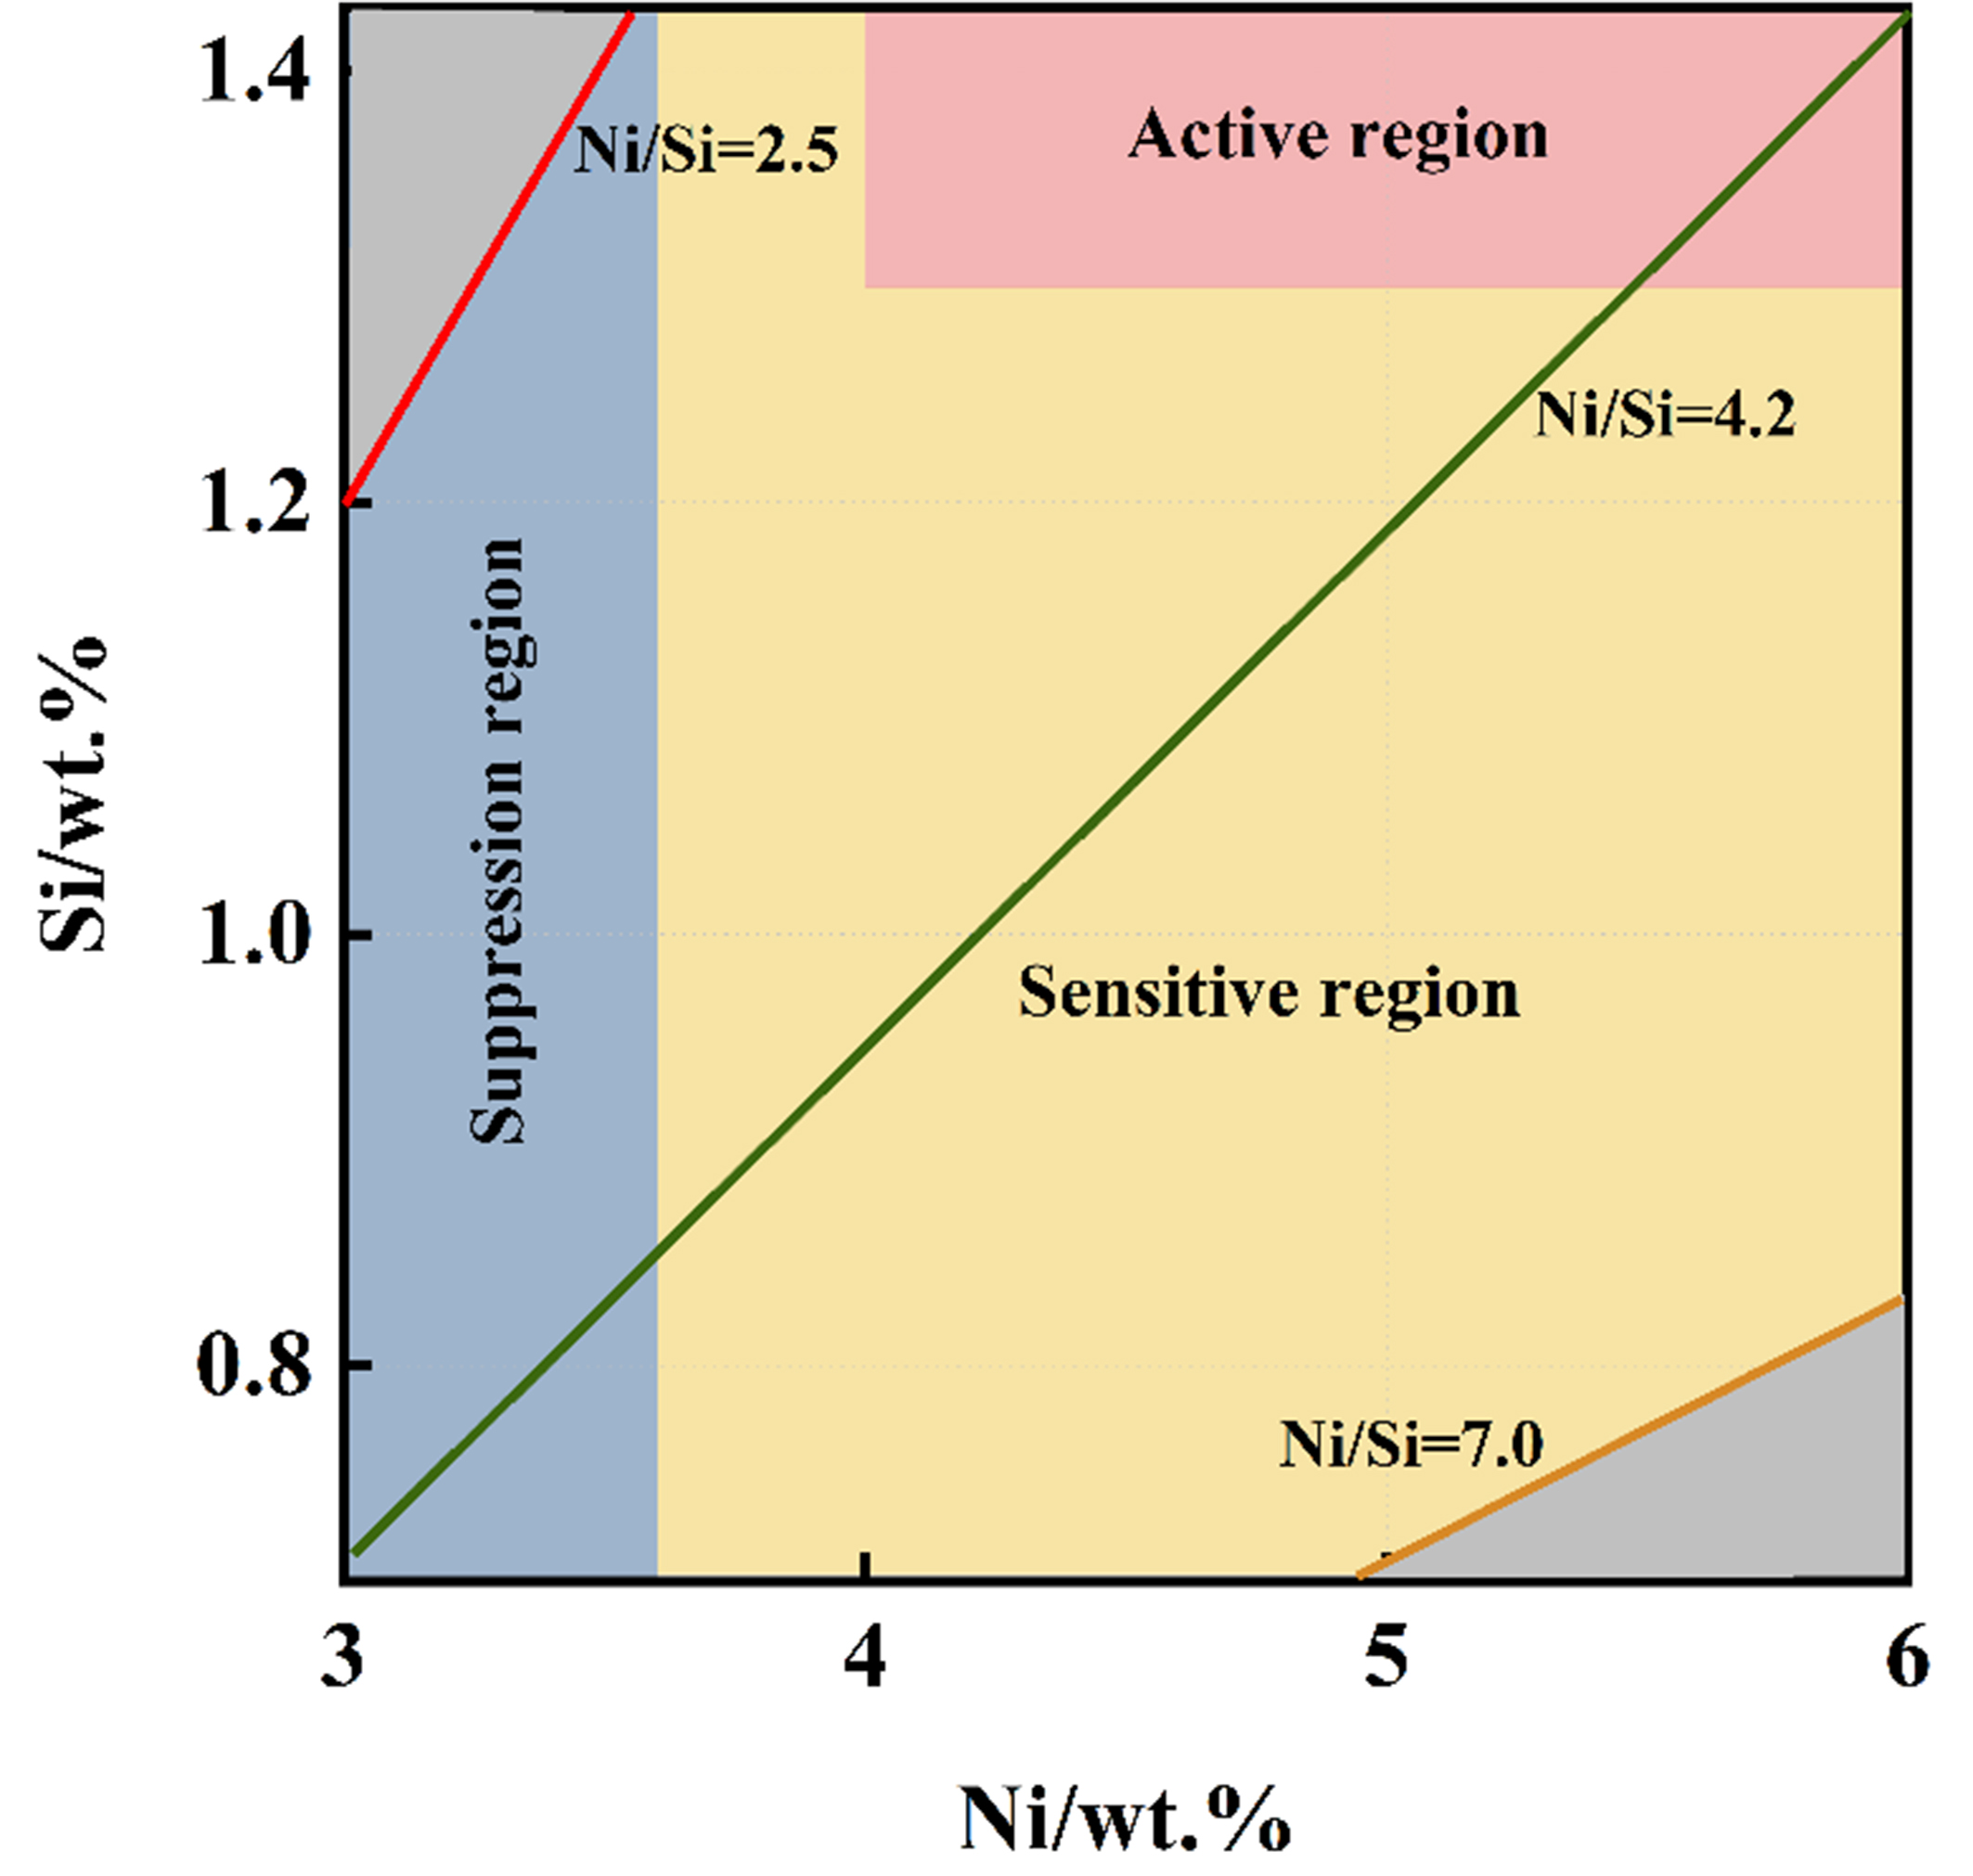
Figure 9. Ni-Si compositional region for DPs formation. DPs: Discontinuous precipitates.
The DPs-suppressed region is predominantly confined to the compositional range of Ni = 3.0-3.6 wt.% and Si = 0.7-1.4 wt.%. The persistence of the blue region within this compositional domain, even at elevated ATs, indicates a pronounced resistance to DPs formation. This is primarily attributed to the relatively low Ni and Si contents, which result in insufficient solute in the matrix for the DPs reaction and are therefore insufficient to sustain the continuous growth of grain boundary reaction-type precipitation, leading to pronounced suppression of DPs. Within the DPs sensitive region, the spatial distribution of DPs varies markedly with AT and CR. According to the two-dimensional mapping results, this region approximately corresponds to the compositional ranges of Ni = 3.6-4.0 wt.% and Si = 0.7-1.4 wt.%, as well as Ni = 4.0-6.0 wt.% and Si = 0.7-1.3 wt.%. Within these compositional ranges, the concentration of supersaturated solutes in the matrix is sufficient to support the occurrence of the DPs reaction, whereas pronounced competition exists between DPs formation and CPs precipitation. Consequently, variations in processing conditions can alter the microstructural evolution pathway, rendering the region an important compositional window for elucidating the formation mechanism and regulation of DPs. Besides, within the DPs active region, the probability of DPs occurrence increases to approximately 0.6-1.0, with a predicted volume fraction of approximately 1.0%-3.5%. The region is primarily distributed within the compositional range of Ni = 4.0-6.0 wt.% and Si = 1.3-1.4 wt.%. With further increases in Ni and Si contents, the supersaturated solute concentration increases substantially. Together with the high density of defects introduced by cold deformation, such as dislocations and shear bands, this substantially reduces the nucleation barrier for DPs, thereby promoting their formation within the region. Nevertheless, despite the relatively high probability of DPs formation, the corresponding volume fraction does not exhibit a pronounced increase. This behavior arises because DPs precipitate predominantly as the Ni2Si precipitates, whose nucleation and growth depend on the coupled local supply of Ni and Si. Although the overall solute content is relatively high within this compositional range, a certain degree of Ni deficiency is present. The resulting limitation in Ni supply is insufficient to sustain the continued growth of Ni2Si, thereby restricting further increase in the DPs volume fraction. However, as the Ni/Si weight ratio within the DPs active region gradually approaches 4.2, the compositional balance between Ni and Si becomes more favorable for the sustained growth of Ni2Si precipitates, resulting in a progressive increase in the DPs volume fraction.
It should be noted that, according to the above analysis, the probability of DPs occurrence and their volume fraction do not exhibit a simple positive correlation, which primarily originates from the coupled effects of composition and processing parameters on precipitation behavior. The occurrence probability of DPs is governed predominantly by the nucleation conditions of the system, including solute supersaturation, grain boundary structure, and the density of deformation-induced defects, which collectively determine whether the discontinuous precipitation reaction can be initiated. By contrast, the DPs volume fraction is controlled to a greater extent by the subsequent growth process and depends on the sustained supply of solute atoms, diffusion kinetics, and the competition between CPs and DPs. Significantly, in regions with sufficient Ni and Si contents and more favorable diffusion conditions, DPs can undergo sustained growth once nucleated, resulting in a relatively high volume fraction. Therefore, the absence of a simple positive correlation between DPs occurrence probability and volume fraction essentially reflects the decoupling between the nucleation and growth processes, which represents an important manifestation of composition-processing coupling in regulating precipitation behavior.
In addition to the Ni and Si contents, the Ni/Si weight ratio also plays an important role in governing DPs behavior. As indicated by the three lines representing different Ni/Si weight ratios in Figures 7-9, when Ni/Si ≈ 2.5 (red), corresponding to a Si-rich compositional regime, most compositions fall within regions characterized by a low probability of DPs occurrence and a low DPs volume fraction under most processing conditions, indicating that a relatively low Ni/Si weight ratio is unfavorable for the initiation and development of DPs. When Ni/Si ≈ 4.2 (green), the corresponding line traverses the DPs suppressed, DPs sensitive, and DPs active regions, suggesting that compositions near this ratio form a transitional window for DPs behavior, where precipitation is highly sensitive to variations in processing parameters. In contrast, when Ni/Si ≈ 7.0 (orange), the corresponding compositions lie predominantly within the DPs-sensitive region, indicating a relatively high propensity for DP formation under Ni-rich and Si-deficient conditions, although their subsequent development remains strongly dependent on processing conditions. These results demonstrate that the Ni/Si weight ratio governs the relative availability of Ni and Si solutes, thereby modulating the competitive precipitation of CPs and DPs and ultimately influencing the formation tendency and development of DPs. The above results indicate that compositional thresholds alone are insufficient to fully characterize the predicted variation in DPs behavior, as processing conditions can alter both DPs occurrence and volume fraction at a fixed composition. Integrating classification and regression therefore extends the analysis beyond binary descriptions of the measured samples to the joint mapping of DPs occurrence and extent across the investigated composition–processing space. The resulting maps provide a basis for identifying composition–processing combinations suitable for controlling DPs formation and development. On this basis, the distribution characteristics of discontinuous precipitation in Cu-Ni-Si alloy within the composition-processing space are clearly elucidated, enabling a visual mapping of the formation tendency and development of DPs. These findings provide an important basis for compositional design and the synergistic optimization of the overall properties of Cu-Ni-Si alloy with a propensity for DPs formation.
The relationship between features and discontinuous behavior by SHapley Additive exPlanations analysis
To further elucidate the mechanisms governing DP behavior in Cu-Ni-Si alloy, the effects of compositional variables (Ni and Si) and processing parameters (CR and AT) were systematically analyzed by combining machine-learning prediction results with SHapley Additive exPlanations (SHAP) analysis[11,36]. SHAP enables quantitative assessment of feature importance by evaluating the mean absolute contribution of each input variable to the model output. Separate SHAP analyses were performed for the DPs occurrence probability (classification model) and DPs volume fraction (regression model), thereby providing a statistical assessment of the distinct roles of individual factors in DPs formation. Feature importance was quantitatively assessed by calculating the mean absolute SHAP value (MeanAbsSHAP), where higher values denote a greater average contribution to the model’s output and, therefore, a more pronounced impact on the behavior of DPs. For the regression model, the 39 experimental samples were randomly divided into training and test sets at a ratio of 4:1, and the entire modeling procedure was independently repeated 100 times. In each run, the MeanAbsSHAP value of each input feature was calculated, and the results were subsequently averaged across the 100 runs to evaluate the stability and reliability of feature importance.
As shown in Figure 10, the SHAP analyses yielded identical feature importance rankings for the classification model before and after data augmentation, as well as for the regression model before and after incorporating additional experimental data. These results indicate that data augmentation and the inclusion of supplementary experimental data did not alter the relative feature importance in their respective models, supporting the consistency of the SHAP-based interpretations. Specifically, within the prediction grid constructed in the aforementioned high-dimensional feature space, the relative importance of the input variables in the classification model for DPs occurrence followed the order Ni > AT > Si > CR, identifying Ni content as the predominant factor influencing the predicted occurrence of DPs. In the Cu-Ni-Si alloy, DPs consist of Ni2Si and form through the redistribution of supersaturated Ni and Si solutes coupled with interfacial migration, ultimately giving rise to lamellar Ni2Si precipitates. Accordingly, the Ni and Si contents directly determine the degree of supersaturation with respect to Ni2Si and thereby govern the thermodynamic driving force for discontinuous precipitation. Within the compositional range investigated, the variation in Ni content exerts a more pronounced influence on the precipitation driving force of Ni2Si, accounting for its highest importance in the SHAP analysis. The importance of Si content in the classification model is comparatively lower than that of Ni. However, this finding should not be construed as suggesting that Si plays a subordinate role in the precipitation of Ni2Si. The effect of Si on precipitation behavior is intrinsically coupled with the Ni content, Ni/Si weight ratio, and solute supersaturation. Variations in Ni content simultaneously modify the effective solute inventory available for Ni2Si formation, the stoichiometric balance between Ni and Si, and the degree of matrix supersaturation. The contribution of Si is partially embedded within these multivariable interactions, reducing its apparent independent contribution identified by the classification model. Thus, the relatively lower SHAP importance of Si indicates that, within the compositional range and combinations considered here, its influence is manifested primarily through synergistic matching with Ni and regulation of the Ni/Si ratio, rather than through an independent effect arising solely from variations in Si content. AT also exhibits a relatively high importance in predicting DPs occurrence, highlighting the critical role of temperature in triggering the discontinuous precipitation reaction. Since DPs formation involves solute diffusion and migration of the reaction front, temperature strongly affects both atomic diffusivity and interfacial mobility, thereby altering the propensity for discontinuous precipitation. By comparison, CR makes the smallest contribution to the classification model, indicating a relatively limited influence on whether DPs formation is initiated. Cold rolling primarily modifies the matrix microstructure by introducing dislocations, substructures, and stored energy; these factors predominantly affect the subsequent precipitation kinetics rather than directly altering the thermodynamic driving force for Ni2Si precipitation.
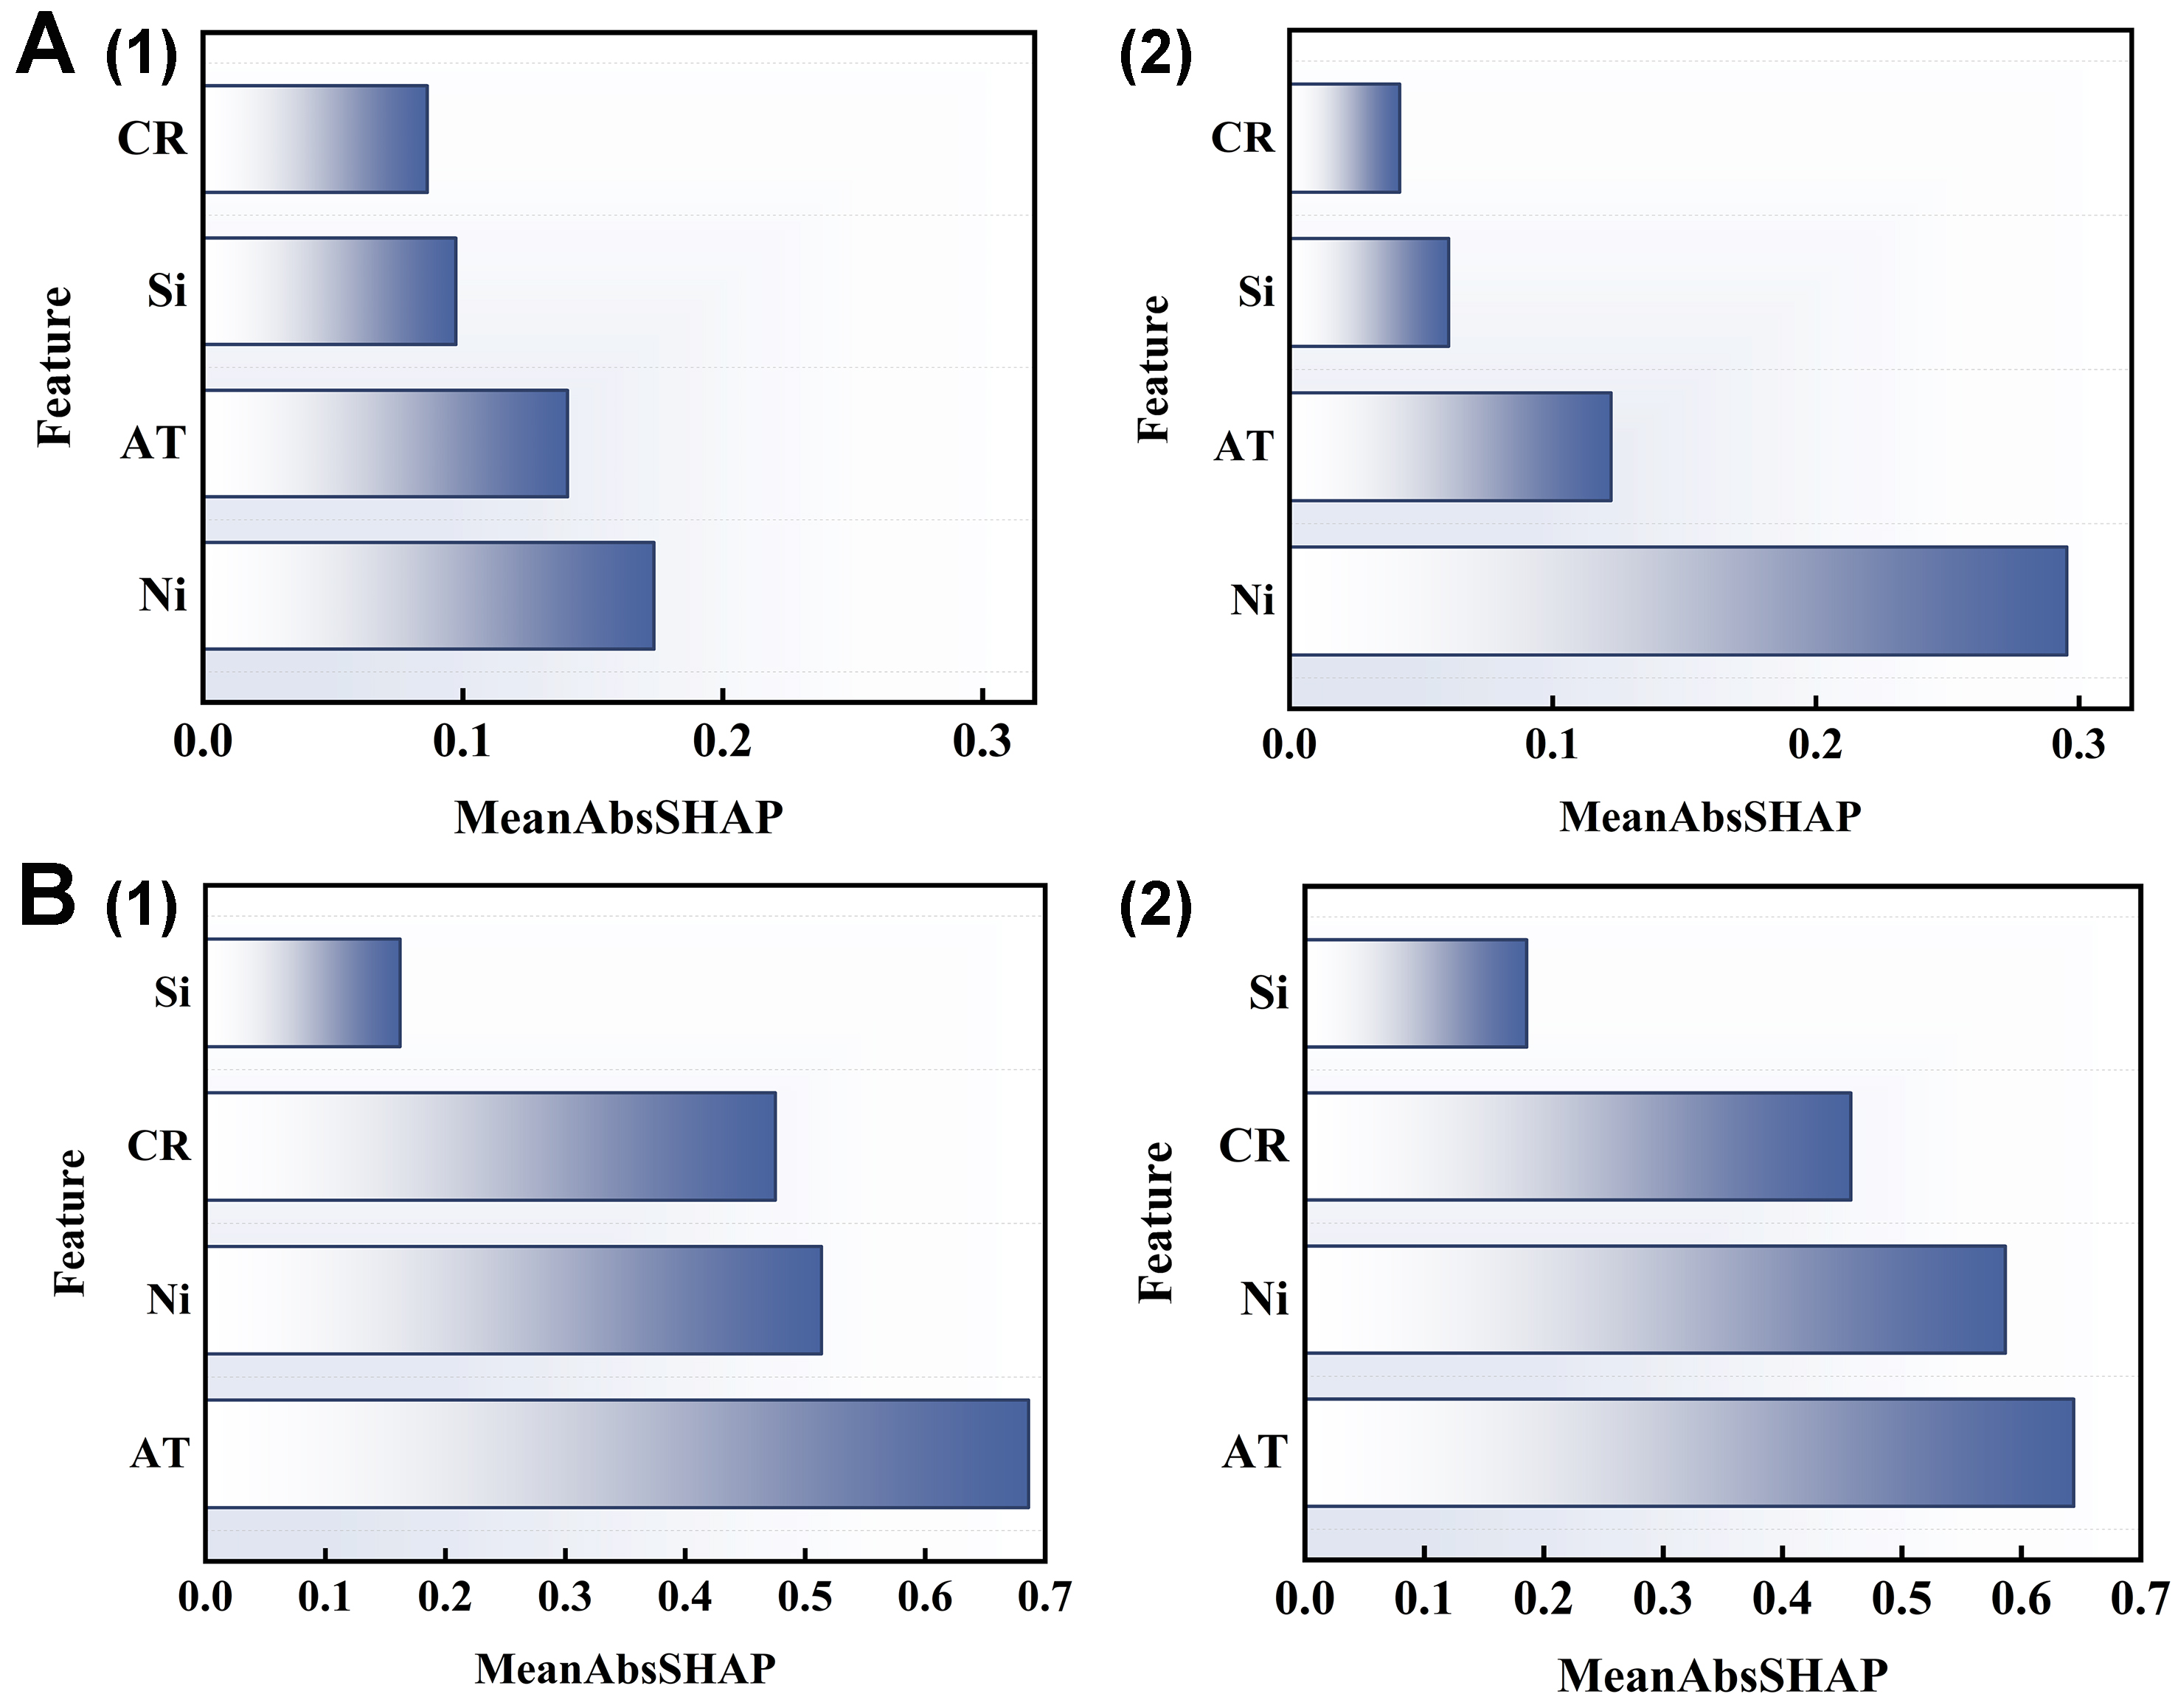
Figure 10. SHAP analysis results obtained from 100 independent modeling runs: [A(1)] DPs occurrence probability based on the original dataset; [A(2)] DPs occurrence probability based on the augmented dataset; [B(1)] DPs volume fraction based on the original dataset; and [B(2)] DPs volume fraction based on the combined dataset comprising the original experimental data and the validation results of the classification model. DPs: Discontinuous precipitates; CR: cold-rolling reduction; AT: aging temperature.
The SHAP results are in good agreement with the Ni-Si two-dimensional compositional map established above. Within the Ni-Si compositional space, DPs behavior exhibits distinct regional characteristics, corresponding to the DPs suppressed, DPs sensitive, and DPs active regimes. At relatively low Ni contents, the driving force for the formation of DPs is insufficient, and the system consequently resides in the DPs suppressed regime. With increasing Ni content, the system progressively enters the DPs sensitive regime, where the occurrence of discontinuous precipitation becomes highly dependent on processing conditions. A further increase in Ni content shifts the system into the DPs active regime, in which discontinuous precipitation is more readily activated. The highest SHAP importance assigned to Ni provides further quantitative evidence for the dominant role of Ni content in governing the regional distribution of DPs formation.
In addition, SHAP analysis of the regression model for the DPs volume fraction revealed the following feature importance ranking: AT > Ni > CR > Si. The result indicates that, once discontinuous precipitation is initiated, the subsequent growth and coarsening of DPs are governed predominantly by the AT. Discontinuous precipitation is a typical diffusion-controlled process, whose growth kinetics depend on both solute diffusivity and the mobility of the migrating reaction front. The diffusion coefficient D and temperature T satisfy the Arrhenius relationship[37]:
where, D0 is the pre-exponential factor, Q is the interfacial activation energy, R is the gas constant. According to Equation (8), increasing the AT markedly enhances solute diffusion and interfacial migration rate, thereby promoting DPs formation and increasing the DPs volume fraction. This strong temperature dependence accounts for the highest importance of AT in the regression model. Ni content ranks second in predicting the DPs volume fraction, indicating that, in addition to governing the initiation of discontinuous precipitation, it also determines the solute inventory available for Ni2Si formation. At higher Ni contents, the increased availability of solute provides a greater supply for the sustained growth of DPs. CR exhibits a higher importance than Si content in the regression model, suggesting that the high density of dislocations and stored energy introduced by cold rolling can facilitate solute diffusion and accelerate precipitation kinetics, thereby promoting DPs growth to a certain extent. By comparison, Si content exerts a relatively limited influence on the DPs volume fraction within the compositional range investigated, primarily because the growth stage of discontinuous precipitation is governed predominantly by diffusion kinetics, whereas variations in Si content have a comparatively limited effect on the diffusion process.
By integrating the Ni-Si two-dimensional contour maps with the SHAP analysis, it is evident that DPs behavior in Cu-Ni-Si alloy is synergistically governed by compositional factors and processing parameters. Overall, alloy composition primarily determines whether the conditions required for DP formation are satisfied, whereas processing parameters further regulate the extent of DP evolution and the resulting volume fraction.
CONCLUSIONS
An integrated task machine-learning framework was developed to map DP behavior across the composition-processing space, providing a new strategy for designing high-performance Cu-Ni-Si alloy. The main conclusions are summarized as follows:
(1) The SVE classification model for predicting DPs occurrence achieved an accuracy of 0.98 ± 0.01, demonstrating excellent classification performance. The regression model for predicting the DPs volume fraction achieved an R2 of 0.98 on the test set, indicating high predictive accuracy.
(2) The predicted model identified three DP behavior regions within the investigated composition-processing space, with approximate composition ranges as follows: DPs suppressed (Ni = 3.0-3.6 wt.%, Si = 0.7-1.4 wt.%), DPs sensitive (Ni = 3.6-4.0 wt.%, Si = 0.7-1.4 wt.%; Ni = 4.0-6.0 wt.%, Si = 0.7-1.3 wt.%), and DPs active (Ni = 4.0-6.0 wt.%, Si = 1.3-1.4 wt.%).
(3) DPs behavior is governed by the intricate interplay between alloy composition and processing conditions, with distinct contributions to DPs occurrence and volume fraction evolution. SHAP analysis revealed that the relative importance of factors for DPs formation follows the order Ni > AT > Si > CR, whereas for the evolution of the DPs volume fraction, the ranking is AT > Ni > CR > Si.
DECLARATIONS
Authors’ contributions
Carried out the majority of the modeling and experimental work: Liang, J.
Contributed to the discussion and data analysis: Lei, Y.; Xie, G.
Conducted data curation: Zhang, Y.
Designed the modeling approaches and supervised the research: Zhao, F.; Liu, X.
All authors interpreted the results and contributed to the writing of the paper.
Availability of data and materials
All experimental data collected in the study are contained in Supplementary Table 1 and are also available at: https://github.com/liangliang12036-web/ML-Cu-Ni-Si-alloy. The machine-learning methodology described in the present work was implemented in Python. The code and algorithms are available at: https://github.com/liangliang12036-web/ML-Cu-Ni-Si-alloy.
Al and Al-assisted tools statement
Not applicable.
Financial support and sponsorship
This work was supported by the National Natural Science Foundation of China (Grant No. 52471030), the Beijing Natural Science Foundation (No. L251087), the High-level Talent Research Start-up Project Funding of Henan Academy of Sciences (No. 242030183), and the Fundamental Research Funds for the Central Universities (Grant No. FRF-EF-26-01A). The APC was funded by Shaanxi Sirui Advanced Materials Co., Ltd.
Conflicts of interest
All authors declared that there are no conflicts of interest.
Ethical approval and consent to participate
Not applicable.
Consent for publication
Not applicable.
Copyright
©The Author(s) 2026.
Supplementary Materials
REFERENCES
1. Ahn, J. H.; Han, S. Z.; Choi, E.; et al. The effect of bimodal structure with nanofibers and normal precipitates on the mechanical and electrical properties of Cu Ni Si alloy. Mater. Charact. 2020, 170, 110642.
2. Ren, K.; Liao, X.; Pang, Y.; et al. Composition-driven fibrous-to-lamellar transition of discontinuous precipitates in Cu-Ni-Si alloys. Mater. Design. 2025, 260, 115102.
3. Shan, Y.; Zhang, Y.; Zhang, C.; et al. Study on the microstructure and mechanism of stress relaxation behavior of Cu–Ni–Si alloy by two-stage rolling deformation. Mater. Sci. Eng. A. 2024, 908, 146946.
4. Yang, Z.; Wu, Y.; Zhou, L.; Li, B.; Jiang, F.; Lu, J. Effects of micron-sized Cr3Si particles on microstructure and properties of CuNiSiCr alloy. J. Mater. Res. Technol. 2025, 34, 2273-84.
5. Shan, Y.; Zhang, Y.; Zhang, C.; et al. Study on the microstructure evolution and strengthening mechanism of Cu-Ni-Si alloy after two-stage rolling and aging. Mater. Design. 2025, 254, 113935.
6. Semboshi, S.; Sato, S.; Iwase, A.; Takasugi, T. Discontinuous precipitates in age-hardening CuNiSi alloys. Mater. Charact. 2016, 115, 39-45.
7. Liang, J.; Xie, G.; Liu, F.; Xue, W.; Wang, R.; Liu, X. Optimizing the overall performance of Cu-Ni-Si alloy via controlling nanometer-lamellar discontinuous precipitation structure. Int. J. Miner. Metall. Mater. 2025, 32, 915-24.
8. Liao, X.; Li, L.; Ren, K.; et al. Effect of misorientation of grain boundaries on the discontinuous precipitates of Cu–Ni–Si alloy. J. Mater. Res. Technol. 2023, 26, 2060-9.
9. Goto, M.; Yamamoto, T.; Han, S.; et al. Simultaneous increase in electrical conductivity and fatigue strength of Cu-Ni-Si alloy by utilizing discontinuous precipitates. Mater. Lett. 2021, 288, 129353.
10. Zhang, H.; Fu, H.; Sun, J.; Jiang, L.; Zhu, S.; Xie, J. Data-driven multi-process modeling and integrated design strategy for complex high-performance alloys. Acta. Mater. 2026, 302, 121648.
11. Sheikh, S.; Vela, B.; Honarmandi, P.; et al. An automated computational framework to construct printability maps for additively manufactured metal alloys. npj. Comput. Mater. 2024, 10, 252.
12. Sowards, J. W.; Crabtree, E.; O’Connor, A.; Michael, F. N.; Mireles, O. Solidification cracking of refractory alloys: a computational and machine learning study to investigate composition-dependence for improved weldability and additive manufacturability. Mater. Design. 2026, 263, 115679.
13. Pan, J.; Shi, R.; Zhang, Z.; et al. Composition-deformation mechanism-property machine learning model for strength-ductility improvement of β-type titanium alloys. Int. J. Plast. 2025, 194, 104461.
14. Xiao, X.; Wang, Z.; Yun, P.; et al. An interatomic-energy-based new materials design strategy combining DFT calculations and active machine learning. J. Mater. Sci. Technol. 2026, 267, 13-22.
15. Yin, J.; Lei, Q.; Yan, W.; et al. Unifying composition and process design: a heterogeneous graph neural network for discovering high‐performance Cu alloys. Adv. Sci. 2026, e24364.
16. Yun, P.; Fu, H.; Zhang, H.; et al. Mechanical and electrical properties dataset of Cu-Cr-X alloys generated with automated figure data extraction. Sci. Data. 2025, 12, 2023.
17. Jiang, X.; Fu, H.; Bai, Y.; et al. Interpretable machine learning applications: a promising prospect of AI for materials. Adv. Funct. Mater. 2025, 35, 2507734.
18. Liu, Y.; Wang, Z.; Wang, Y.; et al. Data-driven composition design and property optimization of solid solution and precipitation simultaneously strengthened non-oriented silicon steel. Mater. Design. 2024, 242, 113011.
19. Zhang, L.; Choi, Y. S. Denoising diffusion probabilistic model-based tabular data augmentation for improved phase classification of high-entropy alloys. Acta. Mater. 2026, 310, 122124.
20. Wang, Q.; Qin, X.; Xia, S.; et al. Interpretable machine learning excavates a low-alloyed magnesium alloy with strength-ductility synergy based on data augmentation and reconstruction. J. Magnes. Alloys. 2025, 13, 2866-83.
21. Ye, Y.; Li, Y.; Ouyang, R.; Zhang, Z.; Tang, Y.; Bai, S. Improving machine learning based phase and hardness prediction of high-entropy alloys by using Gaussian noise augmented data. Comput. Mater. Sci. 2023, 223, 112140.
22. Yin, J.; Lei, Q.; Li, X.; et al. A novel neural network-based alloy design strategy: gated recurrent unit machine learning modeling integrated with orthogonal experiment design and data augmentation. Acta. Mater. 2023, 243, 118420.
23. Balamurugan, R.; Chen, J.; Meng, C.; Liu, Y. Data-driven approaches for fatigue prediction of Ti–6Al–4V parts fabricated by laser powder bed fusion. Int. J. Fatigue. 2024, 182, 108167.
24. Sun, J.; Fu, H.; Zhang, H.; Zhao, M.; Yun, P.; Xie, J. Rapid design of processing parameters for Zero-Sample alloys via multi-acquisition-function Bayesian optimization. Mater. Sci. Eng. A. 2025, 944, 148904.
25. Shan, Y.; Zhang, C.; Zhang, Y.; et al. Influence of different rolling passes and deformation amounts on the microstructure evolution and strengthening mechanism of Cu–Ni–Si alloy. J. Mater. Res. Technol. 2024, 33, 3205-20.
26. Xu, Z.; Shi, H.; Liu, S.; et al. Effect of aging temperature on microstructure and properties of cold-rolled Cu-Ni-Si alloy. Mater. Today. Commun. 2024, 40, 109438.
27. Todeschini, R.; Ballabio, D.; Consonni, V.; Sahigara, F.; Filzmoser, P. Locally centred Mahalanobis distance: a new distance measure with salient features towards outlier detection. Anal. Chim. Acta. 2013, 787, 1-9.
28. Rousseeuw, P. J.; Hubert, M. Robust statistics for outlier detection. WIREs. Data. Min. Knowl. Discov. 2011, 1, 73-9.
29. Li, H.; Wang, Y.; Lei, B.; et al. Composite waveform and variable amplitude fatigue life prediction for TC21 titanium alloy welded joints by machine learning model. Thin-Walled. Struct. 2026, 225, 114768.
30. Zhou, H.; Huang, Y.; Xu, P.; et al. Machine-learning-assisted design of high-hardness high-entropy alloys based on component space screening. Mater. Design. 2026, 264, 115732.
31. Yu, G.; Long, Y.; Yue, D.; et al. Machine learning rapid prediction for quality indicators in advanced manufacturing processes of titanium alloys. Powder. Technol. 2026, 473, 122166.
32. Kwak, S.; Kim, J.; Ding, H.; et al. Machine learning prediction of the mechanical properties of γ-TiAl alloys produced using random forest regression model. J. Mater. Res. Technol. 2022, 18, 520-30.
33. Liang, X.; Liu, S.; Zhang, H.; et al. Machine learning and whale optimization algorithm for enhanced hydrogen storage alloy design. Mater. Today. Commun. 2025, 49, 113870.
34. Gupta, A. K.; Chakroborty, S.; Ghosh, S. K.; Ganguly, S. A machine learning model for multi-class classification of quenched and partitioned steel microstructure type by the k-nearest neighbor algorithm. Comput. Mater. Sci. 2023, 228, 112321.
35. Liu, Z.; Wu, H.; Liang, W.; et al. Experimental investigation and machine learning prediction of stress relaxation resistance in C17200 alloy under aging treatment. J. Alloys. Compd. 2026, 1057, 186702.
36. Yuvaraj, K.; Ullal, V. N.; Manujesh, B.; Manojkumar, B.; Mohan, S.; Dinesha, P. Experimental and machine learning investigation of dry sliding wear behavior in multiwall carbon nanotube reinforced stir-cast Al7475 alloy. J. Mater. Res. Technol. 2026, 41, 1368-80.
Cite This Article
 Open Access
How to Cite
Liang, J.; Zhao, F.; Xie, G.; Lei, Y.; Zhang, Y.; Liu, X. Machine-learning-assisted understanding of discontinuous precipitation behavior in Cu-Ni-Si alloy. J. Mater. Inf. 2026, 6, 56. https://dx.doi.org/10.20517/jmi.2026.72
Download Citation
If you have the appropriate software installed, you can download article citation data to the citation manager of your choice. Simply select your manager software from the list below and click on download.
Export Citation File
Type of Import
Tips on Downloading Citation
Citation Manager File Format
Type of Import
Direct Import: When the Direct Import option is selected (the default state), a dialogue box will give you the option to Save or Open the downloaded citation data. Choosing Open will either launch your citation manager or give you a choice of applications with which to use the metadata. The Save option saves the file locally for later use.
Indirect Import: When the Indirect Import option is selected, the metadata is displayed and may be copied and pasted as needed.
About This Article
Special Topic
Copyright

Data & Comments
Data
0











Comments
Comments must be written in English. Spam, offensive content, impersonation, and private information will not be permitted. If any comment is reported and identified as inappropriate content by OAE staff, the comment will be removed without notice. If you have any queries or need any help, please contact us at [email protected].