
fig3
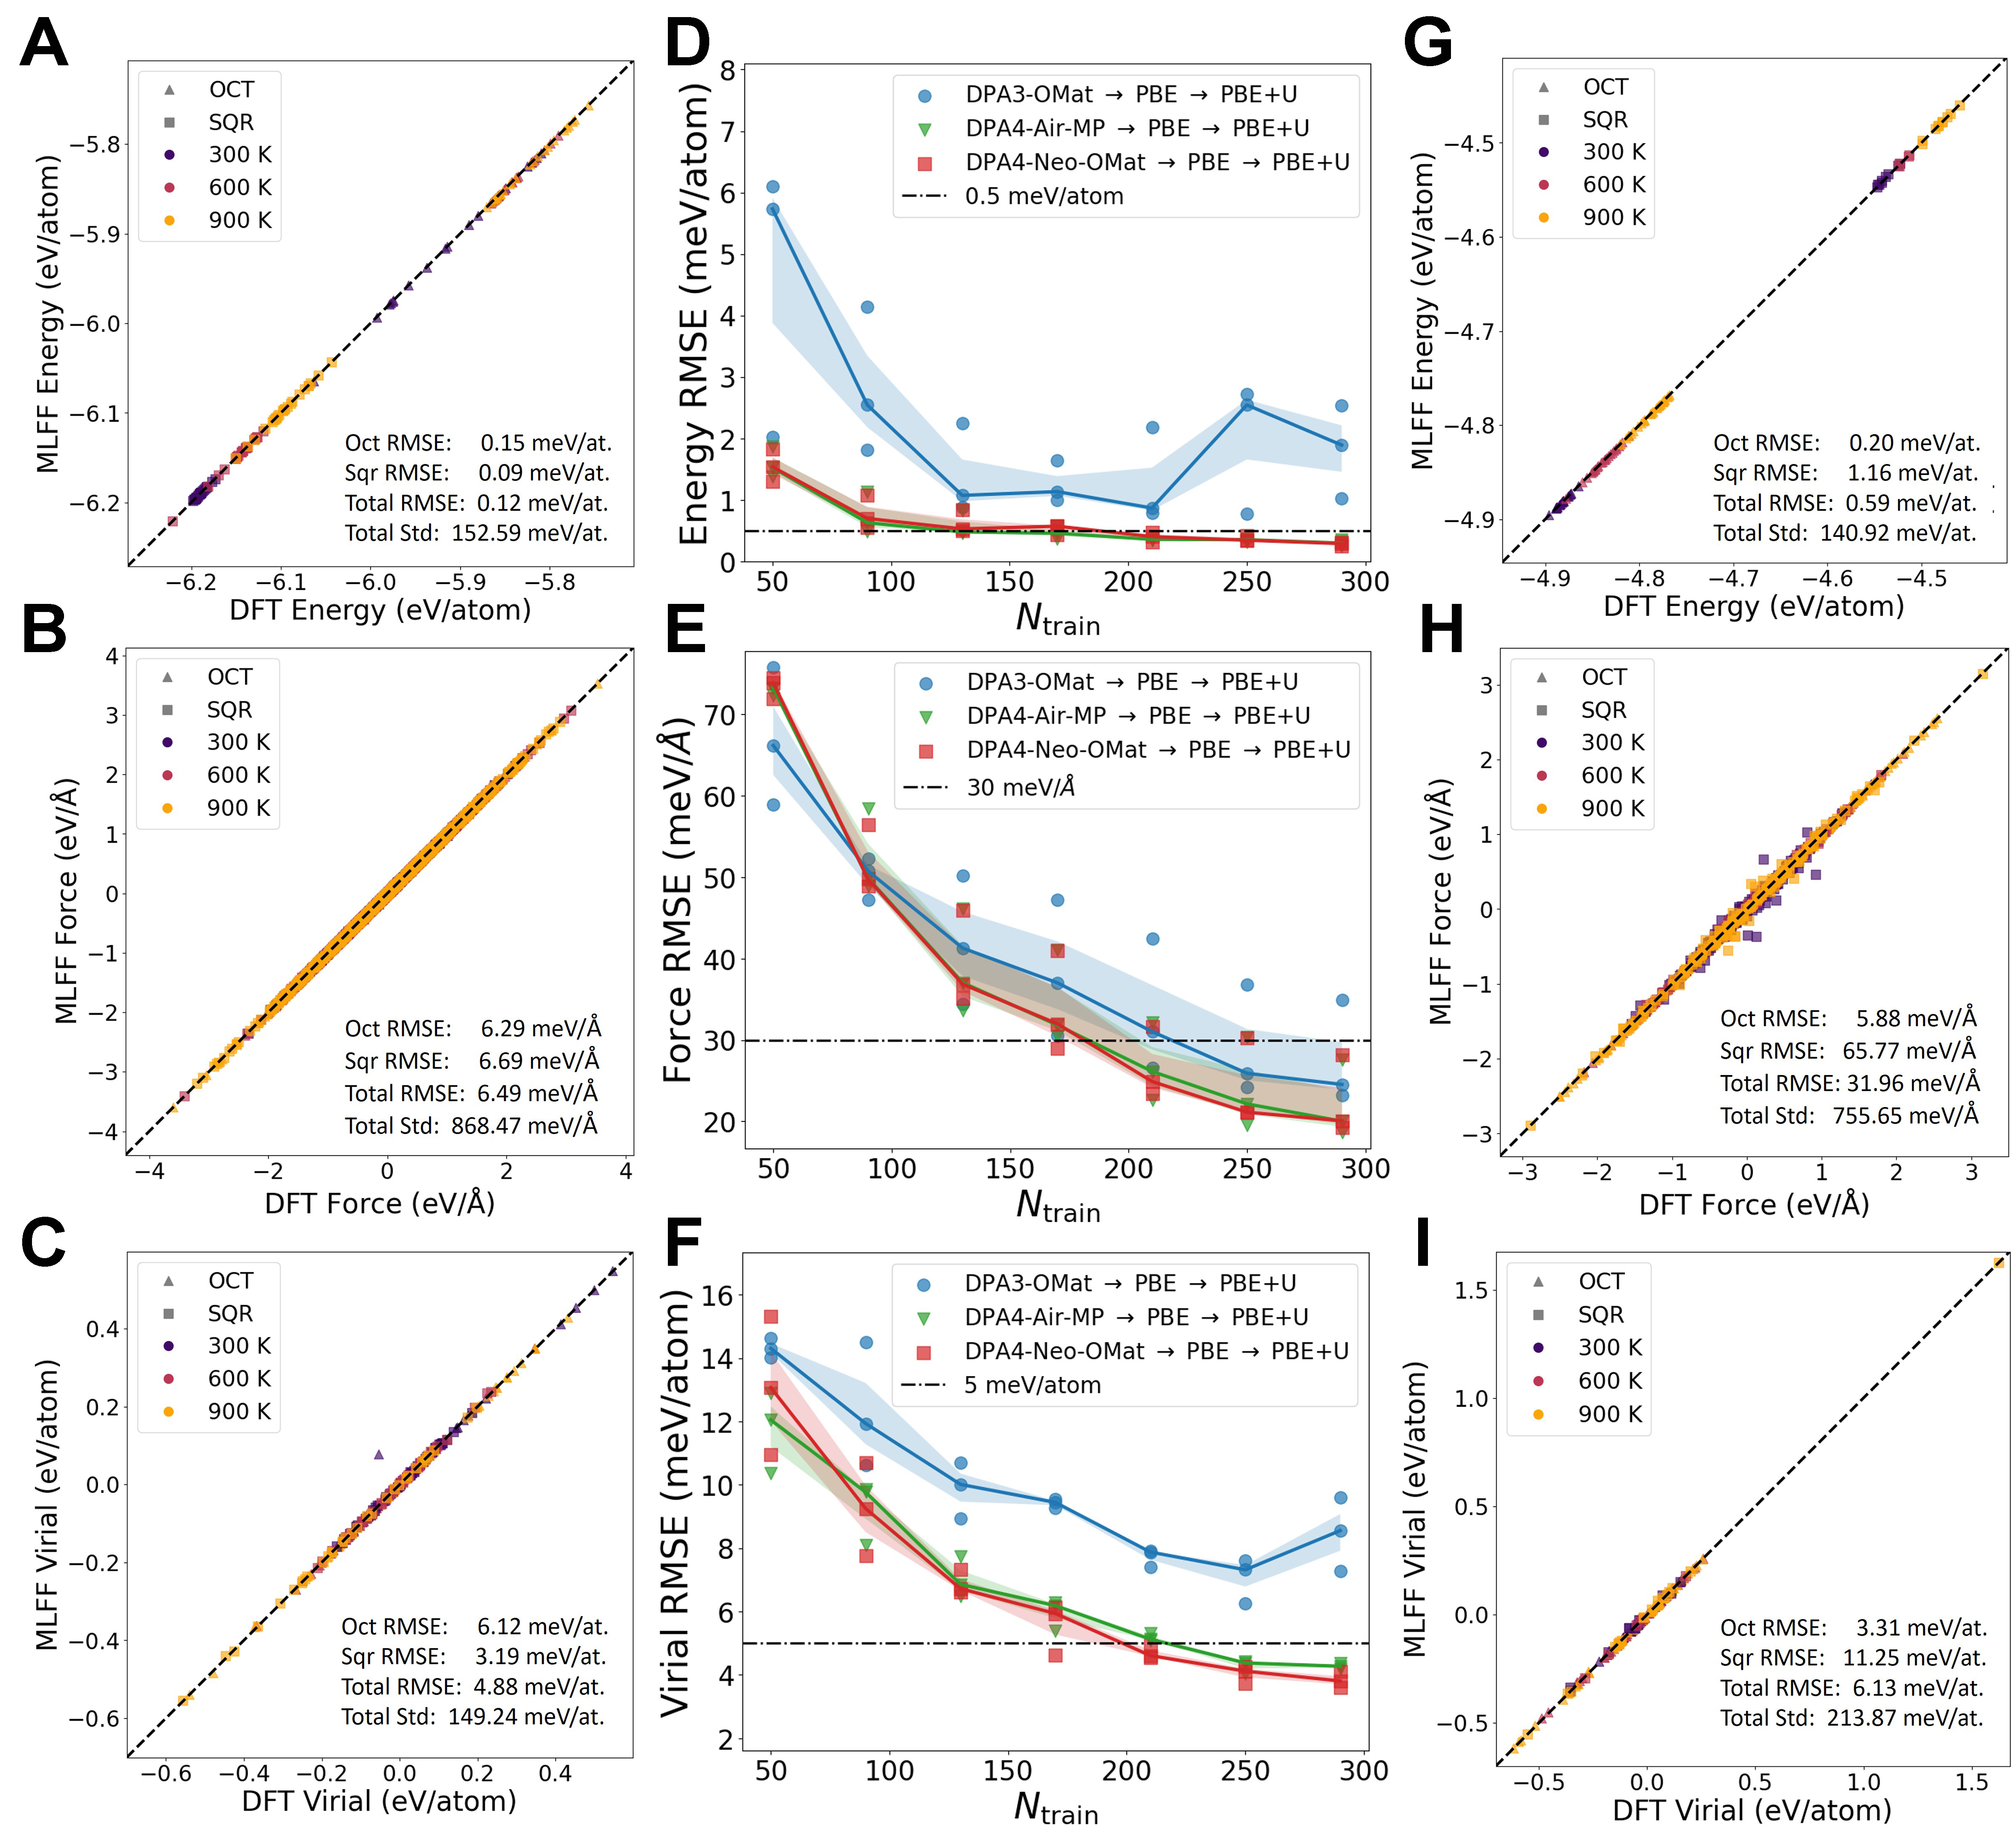
Figure 3. Second-stage adaptation from the non-spin-polarized PBE surface without U to the FM-initialized PBE+U target surface. (A-C) Parity plots of MLFF predictions against the corresponding DFT labels for DPA4-Neo-OMat after the first-stage fine-tuning on 660 non-spin-polarized PBE configurations without U: (A) energy, (B) force, and (C) virial. The dashed diagonal lines indicate ideal agreement; (D-F) Test-set RMSEs for (D) energies, (E) forces, and (F) virials as functions of the number of FM-initialized PBE+U training configurations, Ntrain, used in the second fine-tuning stage. Before this stage, each model was first fine-tuned on non-spin-polarized NiO PBE data without U. Symbols denote results from independent train–test splits. Blue circles, green triangles, and red squares denote DPA3-OMat, DPA4-Air-MP, and DPA4-Neo-OMat models, respectively, each first fine-tuned on 660 non-spin-polarized PBE configurations without U and subsequently fine-tuned on FM-initialized PBE+U configurations; solid lines show the corresponding trends. Shaded regions indicate the interquartile range across independent train–test splits at each Ntrain. The horizontal dash-dotted lines mark RMSEs of 0.5 meV/atom in (D), 30 meV/Å in (E), and 5 meV/atom in (F); (G-I) Parity plots of MLFF predictions against the corresponding DFT labels for DPA4-Neo-OMat after the second-stage fine-tuning on 170 FM-initialized PBE+U configurations for data split 0: (G) energy, (H) force, and (I) virial. The dashed diagonal lines indicate ideal agreement. The parity panels report phase-resolved and total RMSEs together with the standard deviation of the corresponding DFT reference quantity. Split 0 is shown as a representative split; statistics across all three splits are reported in Supplementary Section 5.1. PBE: Perdew–Burke–Ernzerhof; FM: ferromagnetically; MLFF: machine-learned force field; DFT: density-functional theory; RMSEs: root-mean-square errors.