
fig1
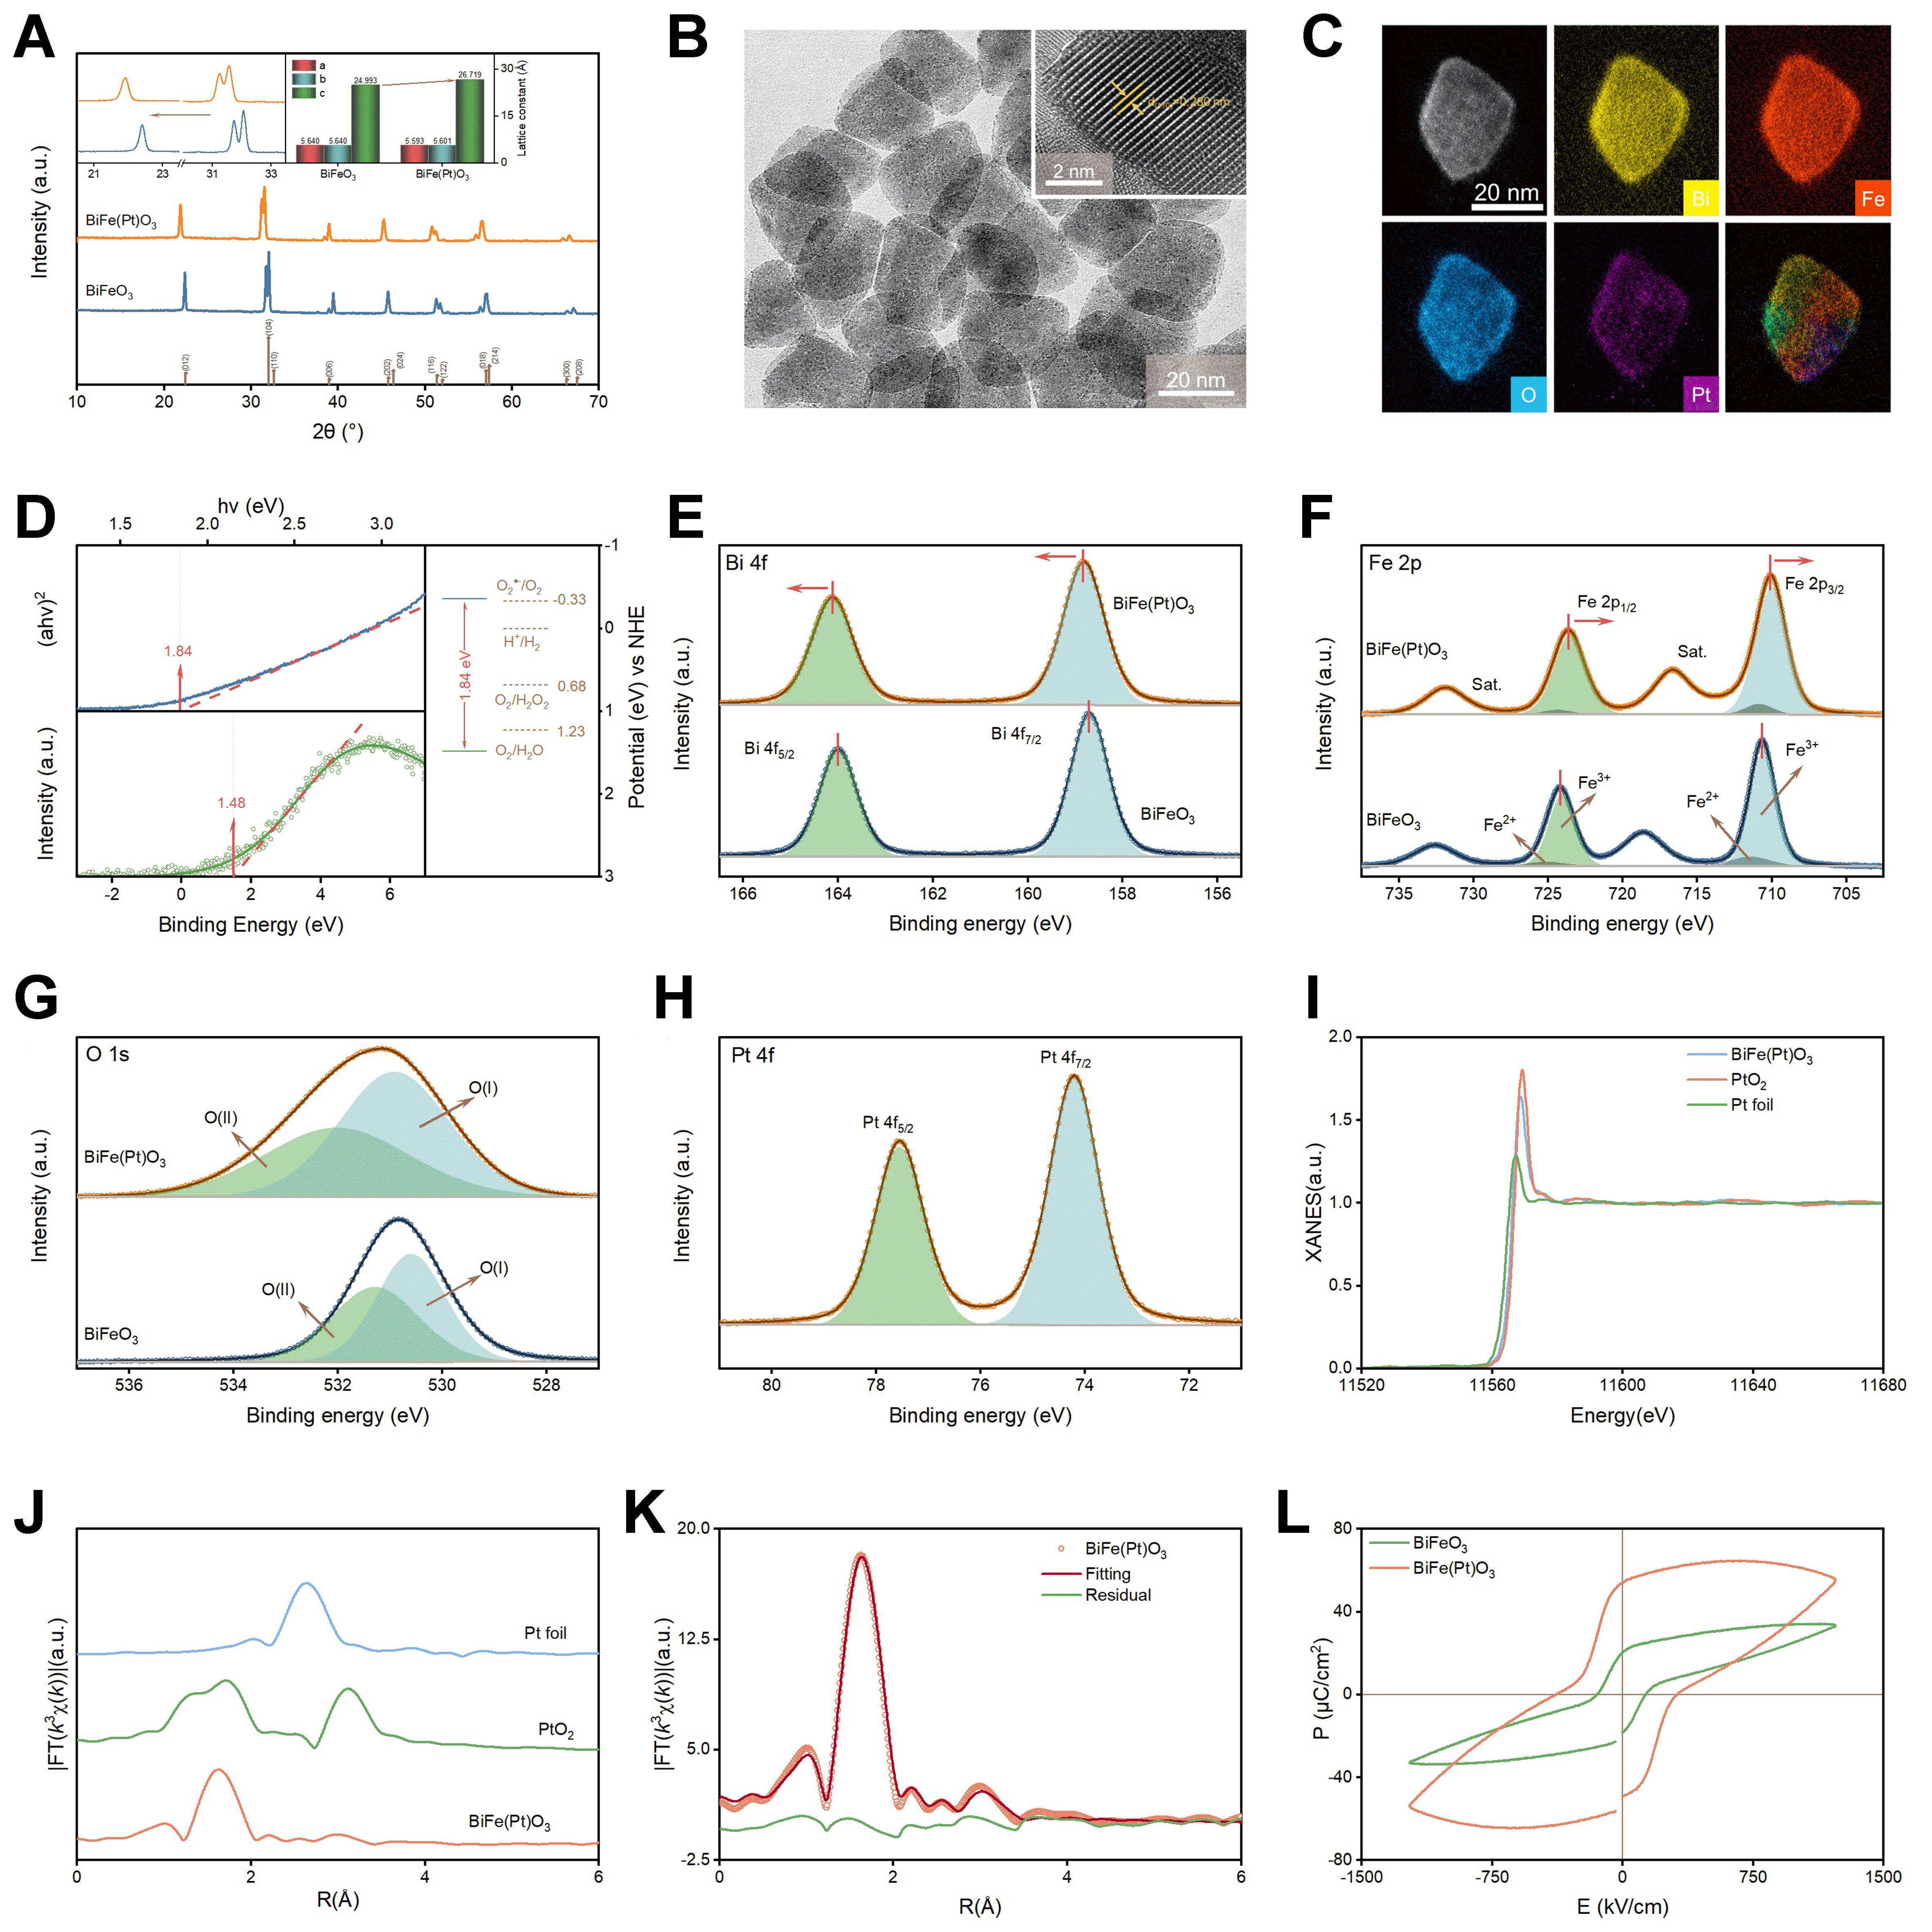
Figure 1. Experimental characterization of pristine BiFeO3 and BiFe(Pt)O3 photocatalysts: (A) XRD patterns with enlarged diffraction peaks and corresponding lattice parameters; (B) TEM image and HRTEM image of the BiFe(Pt)O3 sample; (C) HAADF-STEM elemental mapping images of Bi, Fe, O, and Pt; (D) UV–Vis diffuse reflectance spectra and corresponding Tauc plots together with the calculated band-edge positions; (E) High-resolution XPS spectra of Bi 4f; (F) High-resolution XPS spectra of Fe 2p; (G) High-resolution XPS spectra of O 1s; (H) High-resolution XPS spectra of Pt 4f; (I) Pt L3-edge XANES spectra of BiFe(Pt)O3 together with PtO2 and Pt foil references; (J) Pt L3-edge FT-EXAFS spectra of Pt-modified BiFeO3, PtO2, and Pt foil; (K) R-space EXAFS fitting of Pt-modified BiFeO3; (L) Ferroelectric hysteresis (P–E) loops of pristine BiFeO3 and BiFe(Pt)O3. XRD: X-ray diffraction; TEM: transmission electron microscopy; HRTEM: high-resolution transmission electron microscopy; HAADF-STEM: high-angle annular dark-field scanning transmission electron microscopy; UV–Vis: ultraviolet–visible; XPS: X-ray photoelectron spectroscopy; XANES: X-ray absorption near-edge structure; FT-EXAFS: Fourier-transform extended X-ray absorption fine structure.