fig4
From: Chemical similarity description of liquid kinetics across composition space in magnesium alloys
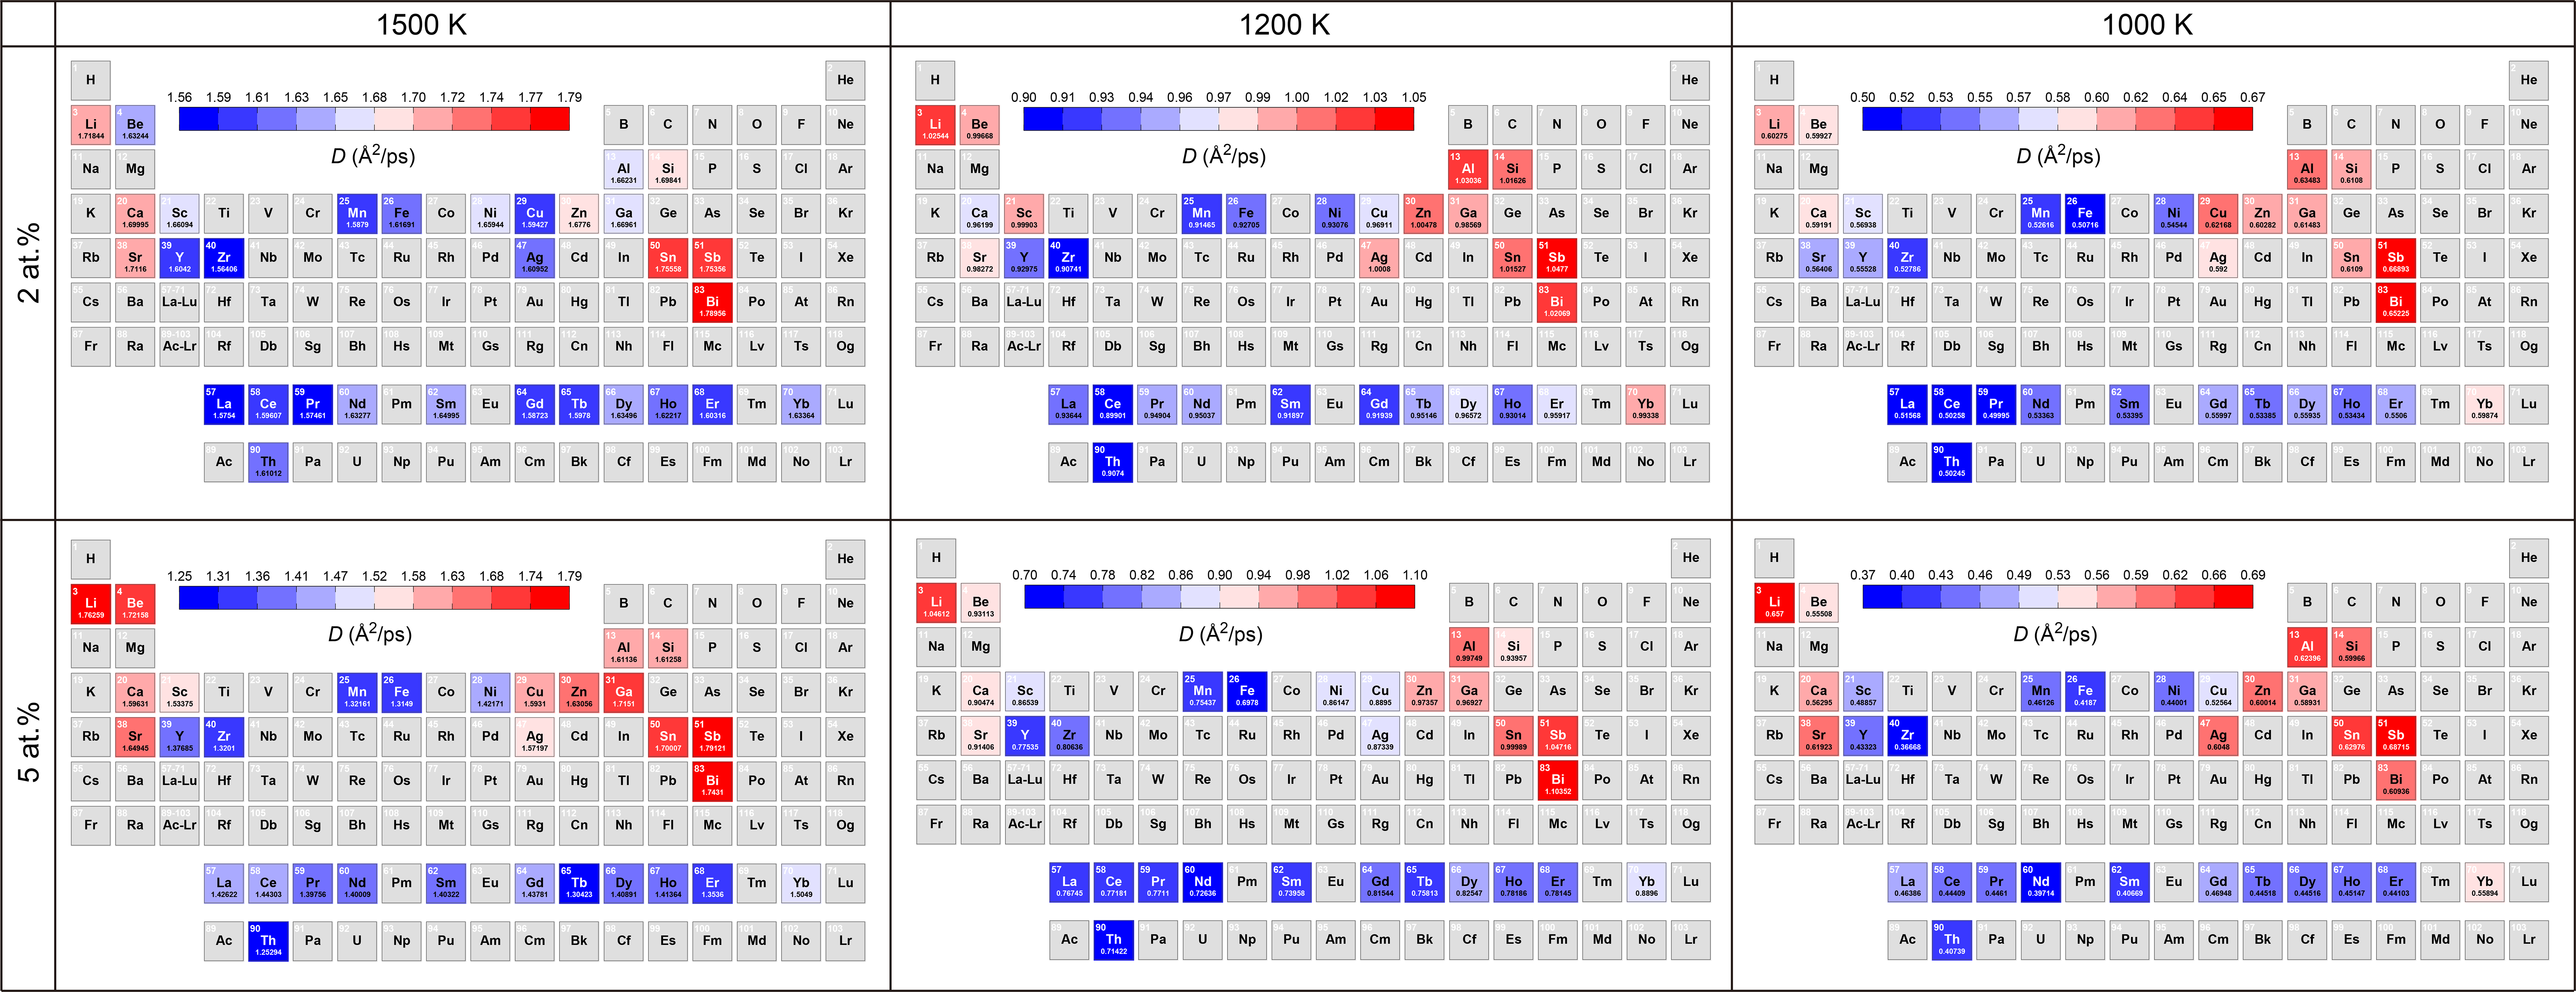
Figure 4. Periodic-table mapping of the diffusion coefficients for binary Mg liquid alloys at solute concentrations of 2 at.% (top row) and 5 at.% (bottom row) and temperatures of 1,500, 1,200, and 1,000 K. The color scale ranges from blue (low diffusivity) to red (high diffusivity).