

fig5
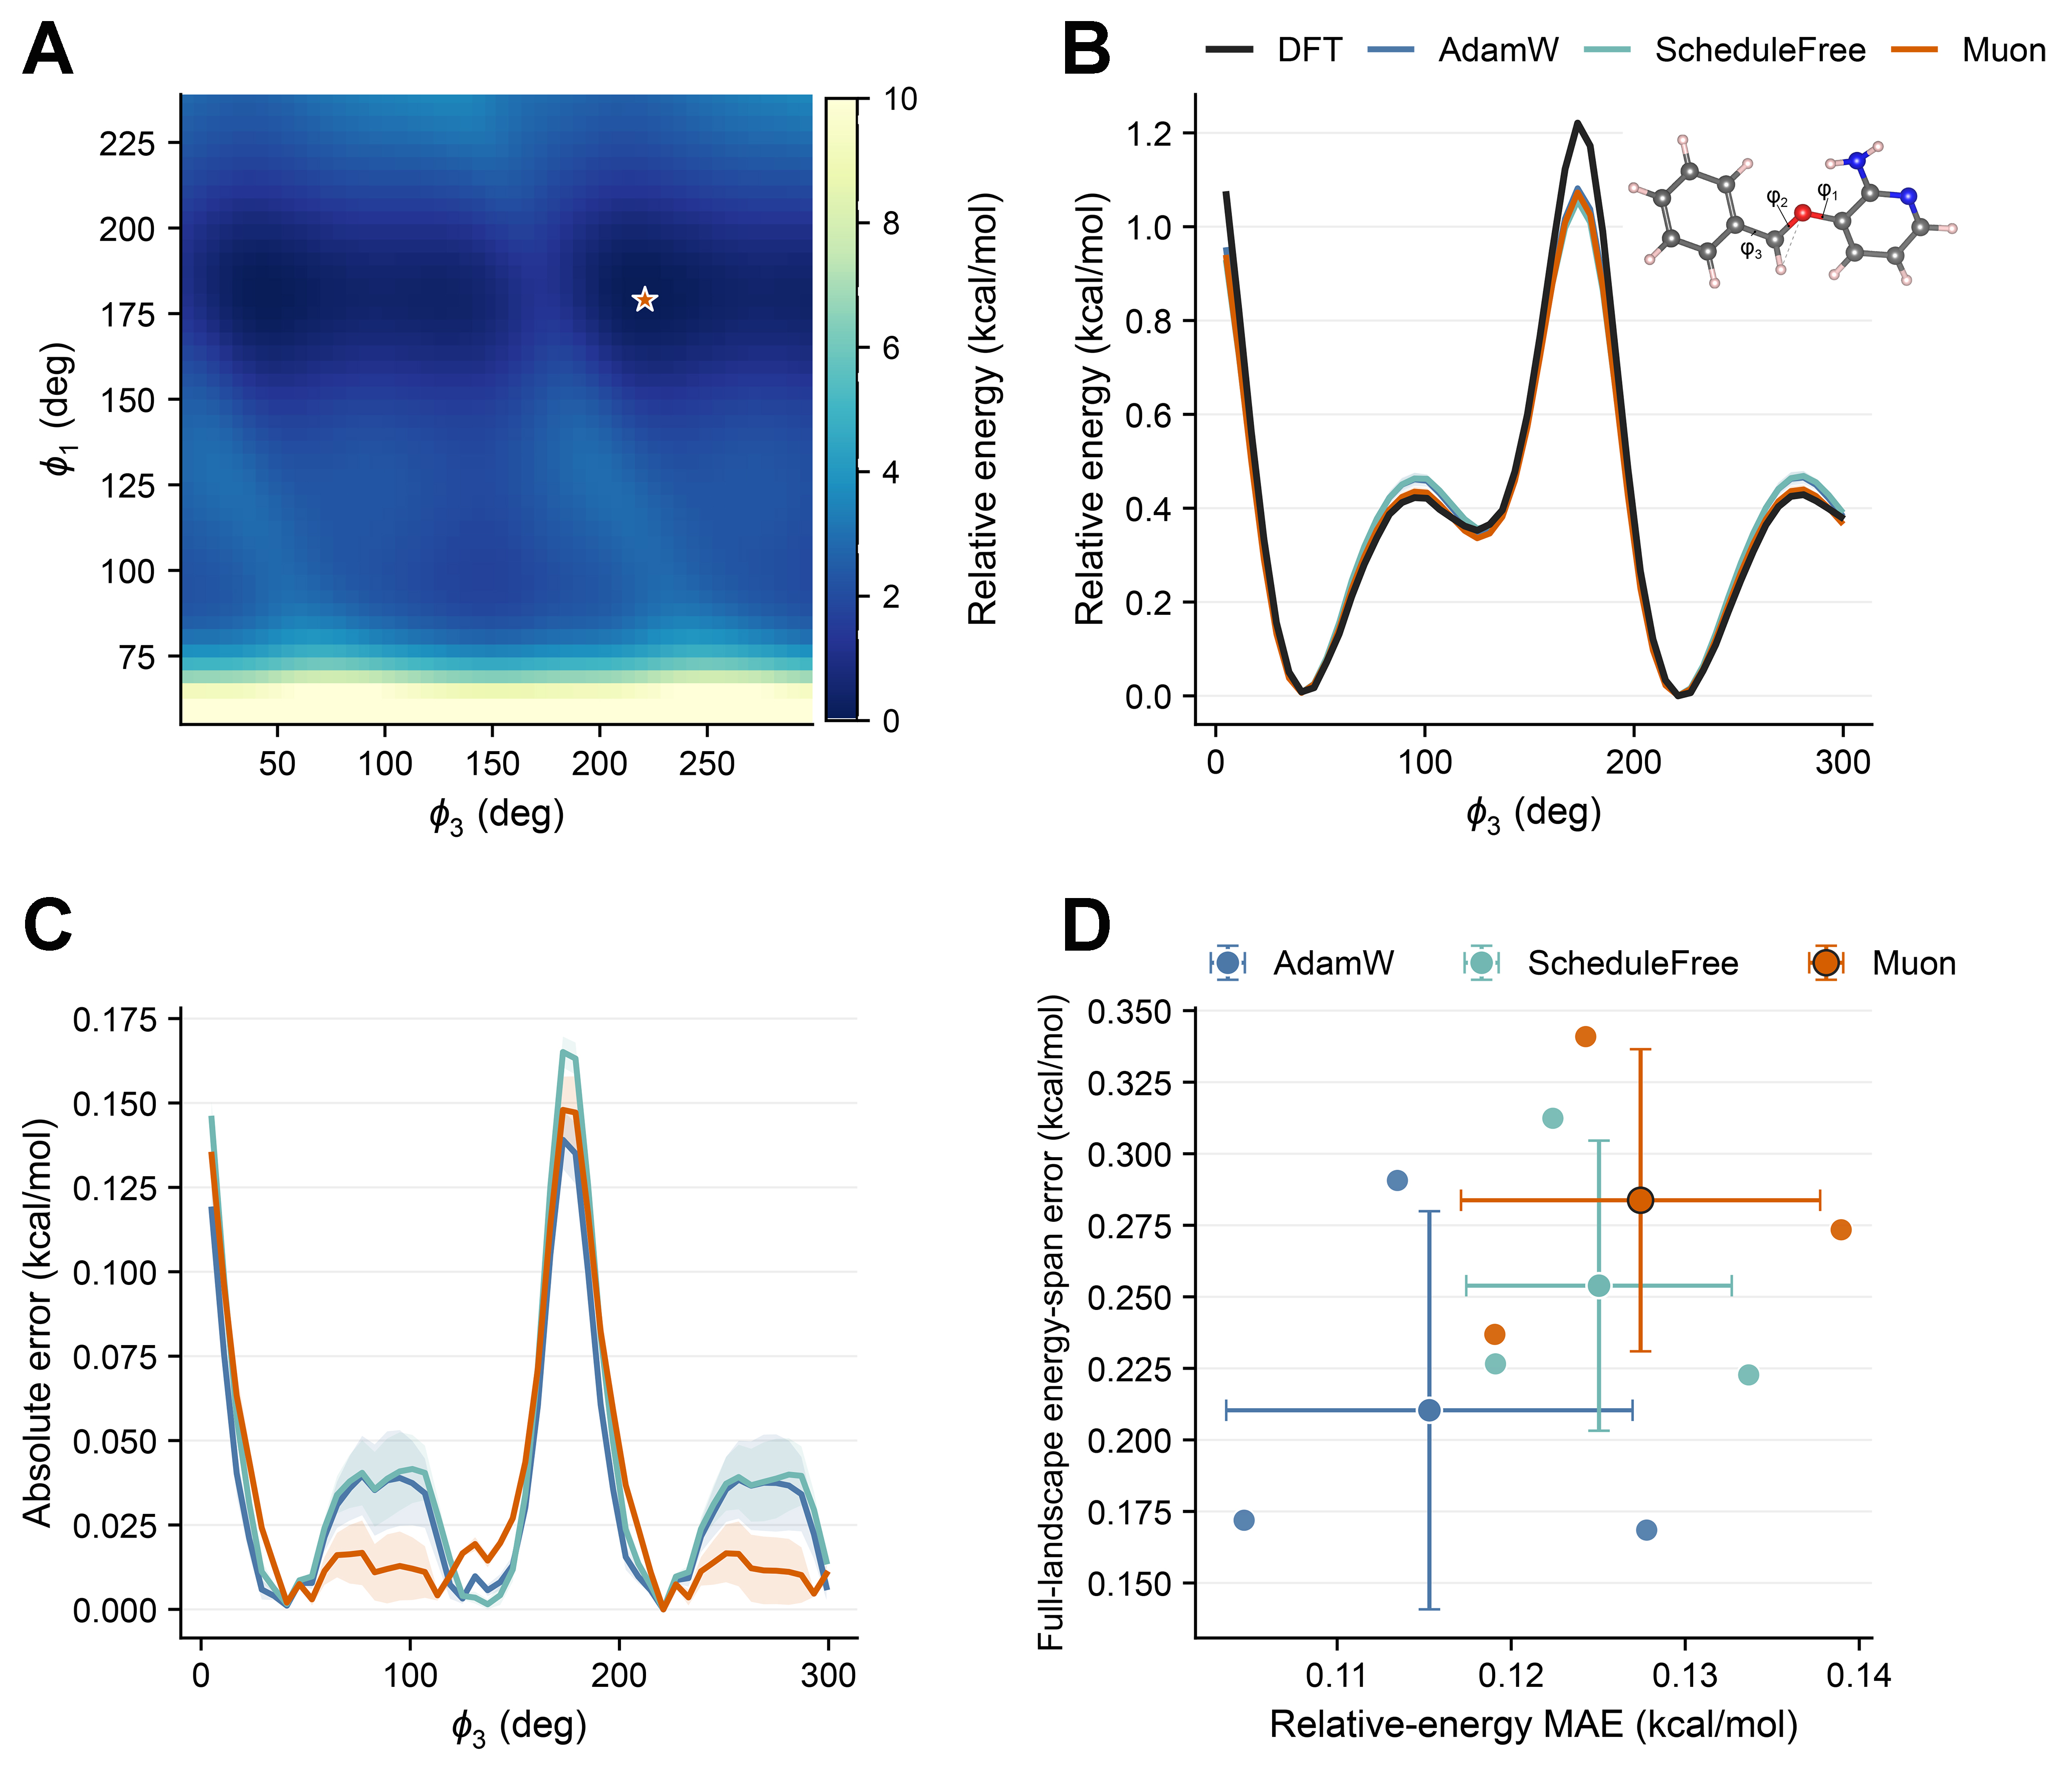
Figure 5. Conformational transfer evaluation of the optimizer configurations on the 3BPA dihedral extrapolation set (7,047 conformers). (A) shows the DFT relative-energy landscape on the ϕ2 = 180° slice, with the DFT minimum marked by a star. Values above 10 kcal/mol are shown in the color used for 10 kcal/mol; (B) compares the DFT and model-predicted profiles as ϕ3 varies through the DFT minimum at ϕ1 = 179° and ϕ2 = 180°. Its inset shows the 3BPA structure with the three torsions labeled; (C) reports the absolute errors along the same ϕ3 profile. Lines and shading in (B) and (C) denote means and standard deviations over three runs; (D) summarizes full-landscape relative-energy MAE and full-landscape energy-span error, showing individual runs and mean ± standard deviation over three runs; AdamW achieves the lowest error on both landscape metrics. Energies are reported in kcal/mol after anchoring at the DFT-minimum conformer. DFT: Density functional theory; MAE: mean absolute error.