
fig3
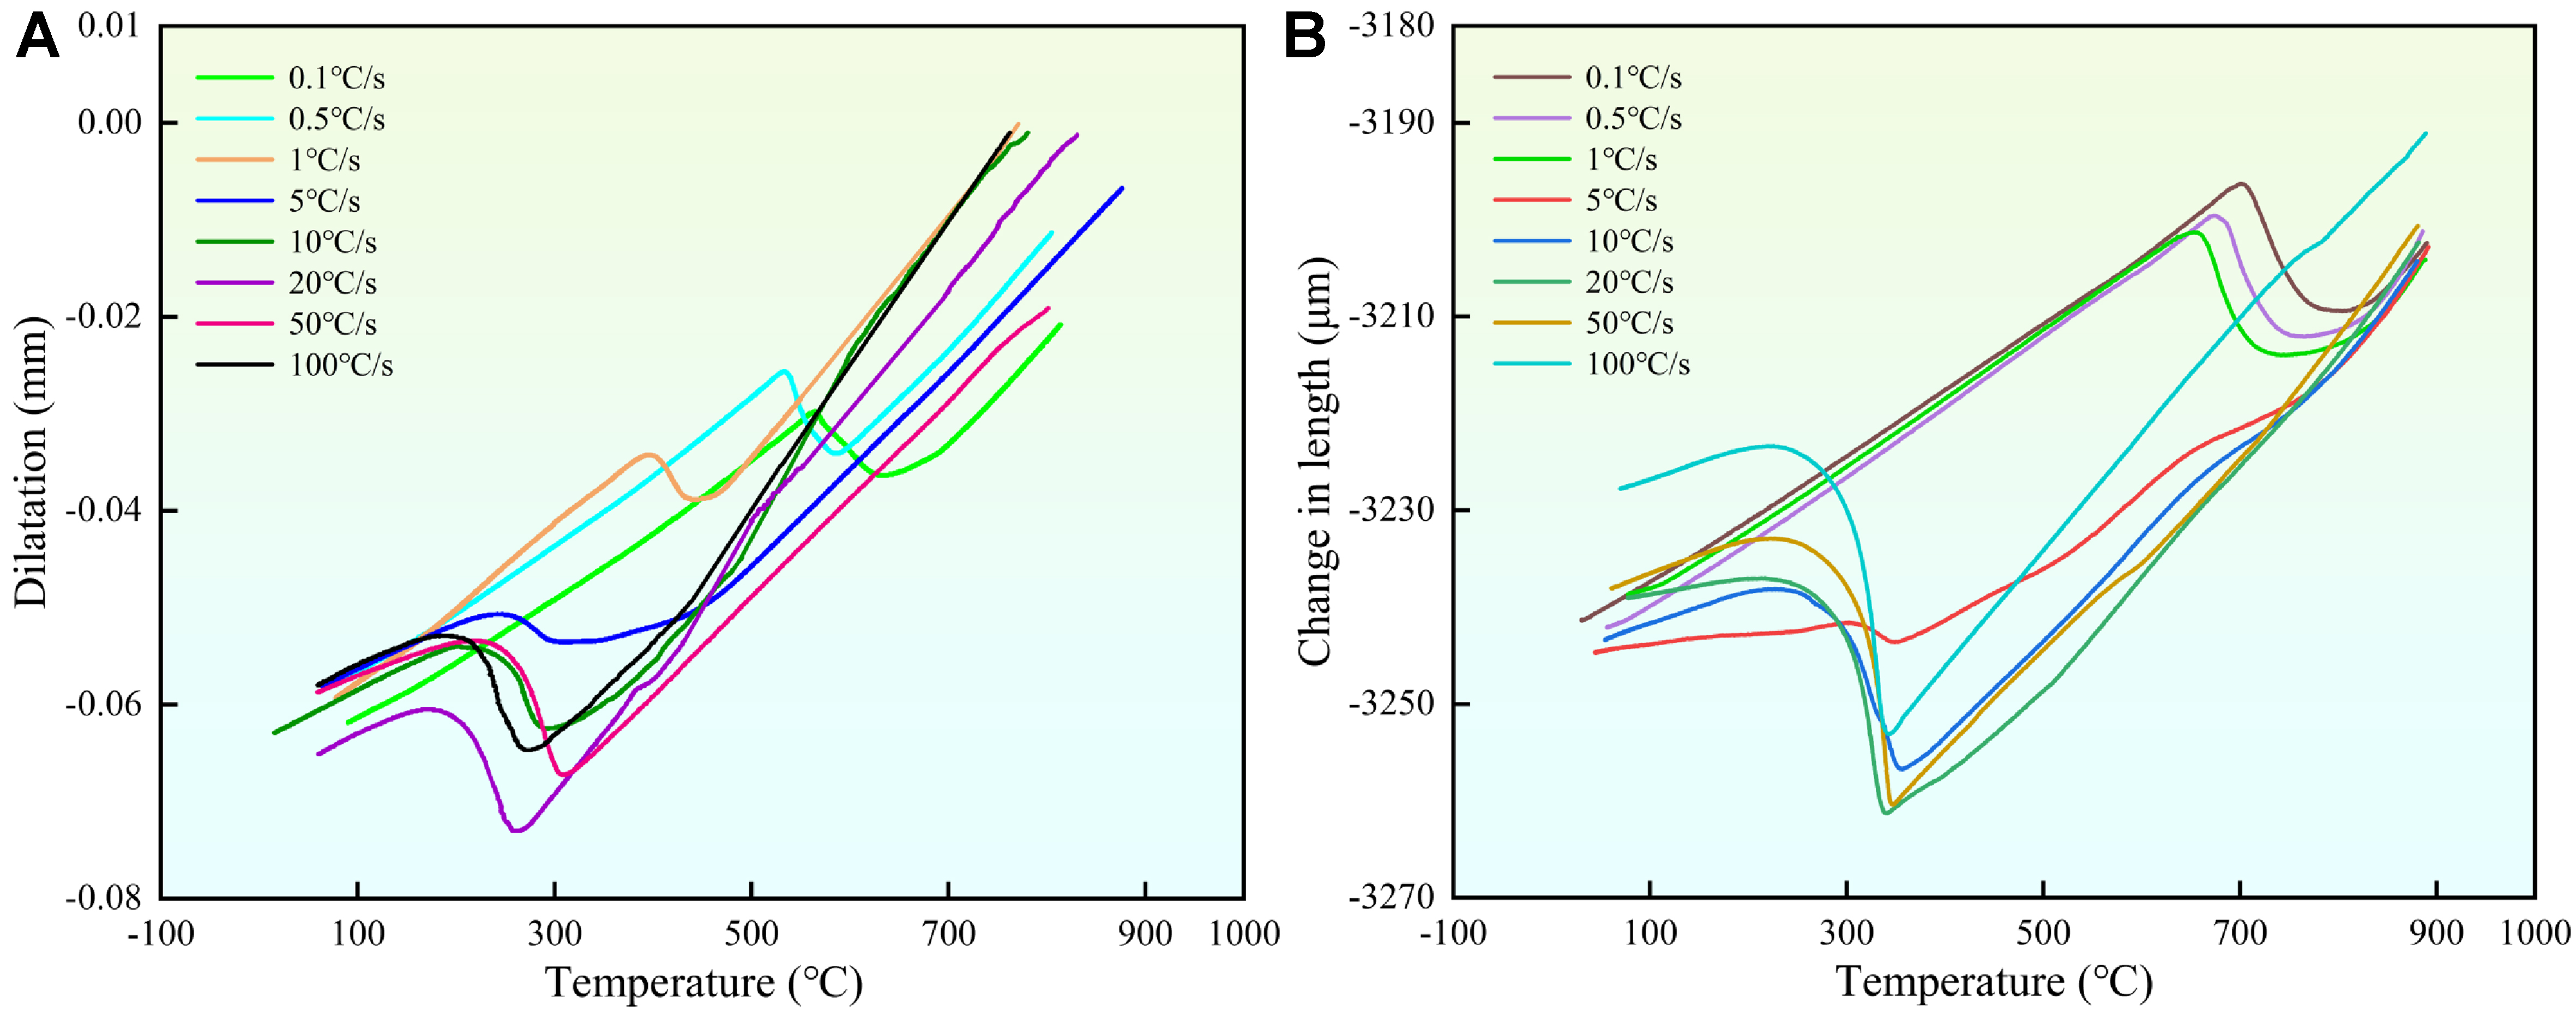
Figure 3. Dilatation curves of 30CrMnSi steel at different cooling rates. (A) Static experiment; (B) Dynamic experiment. Different colors and line styles represent different cooling rates as indicated in the legend.
Figure 3. Dilatation curves of 30CrMnSi steel at different cooling rates. (A) Static experiment; (B) Dynamic experiment. Different colors and line styles represent different cooling rates as indicated in the legend.


All published articles are preserved here permanently:
https://www.portico.org/publishers/oae/