
fig5
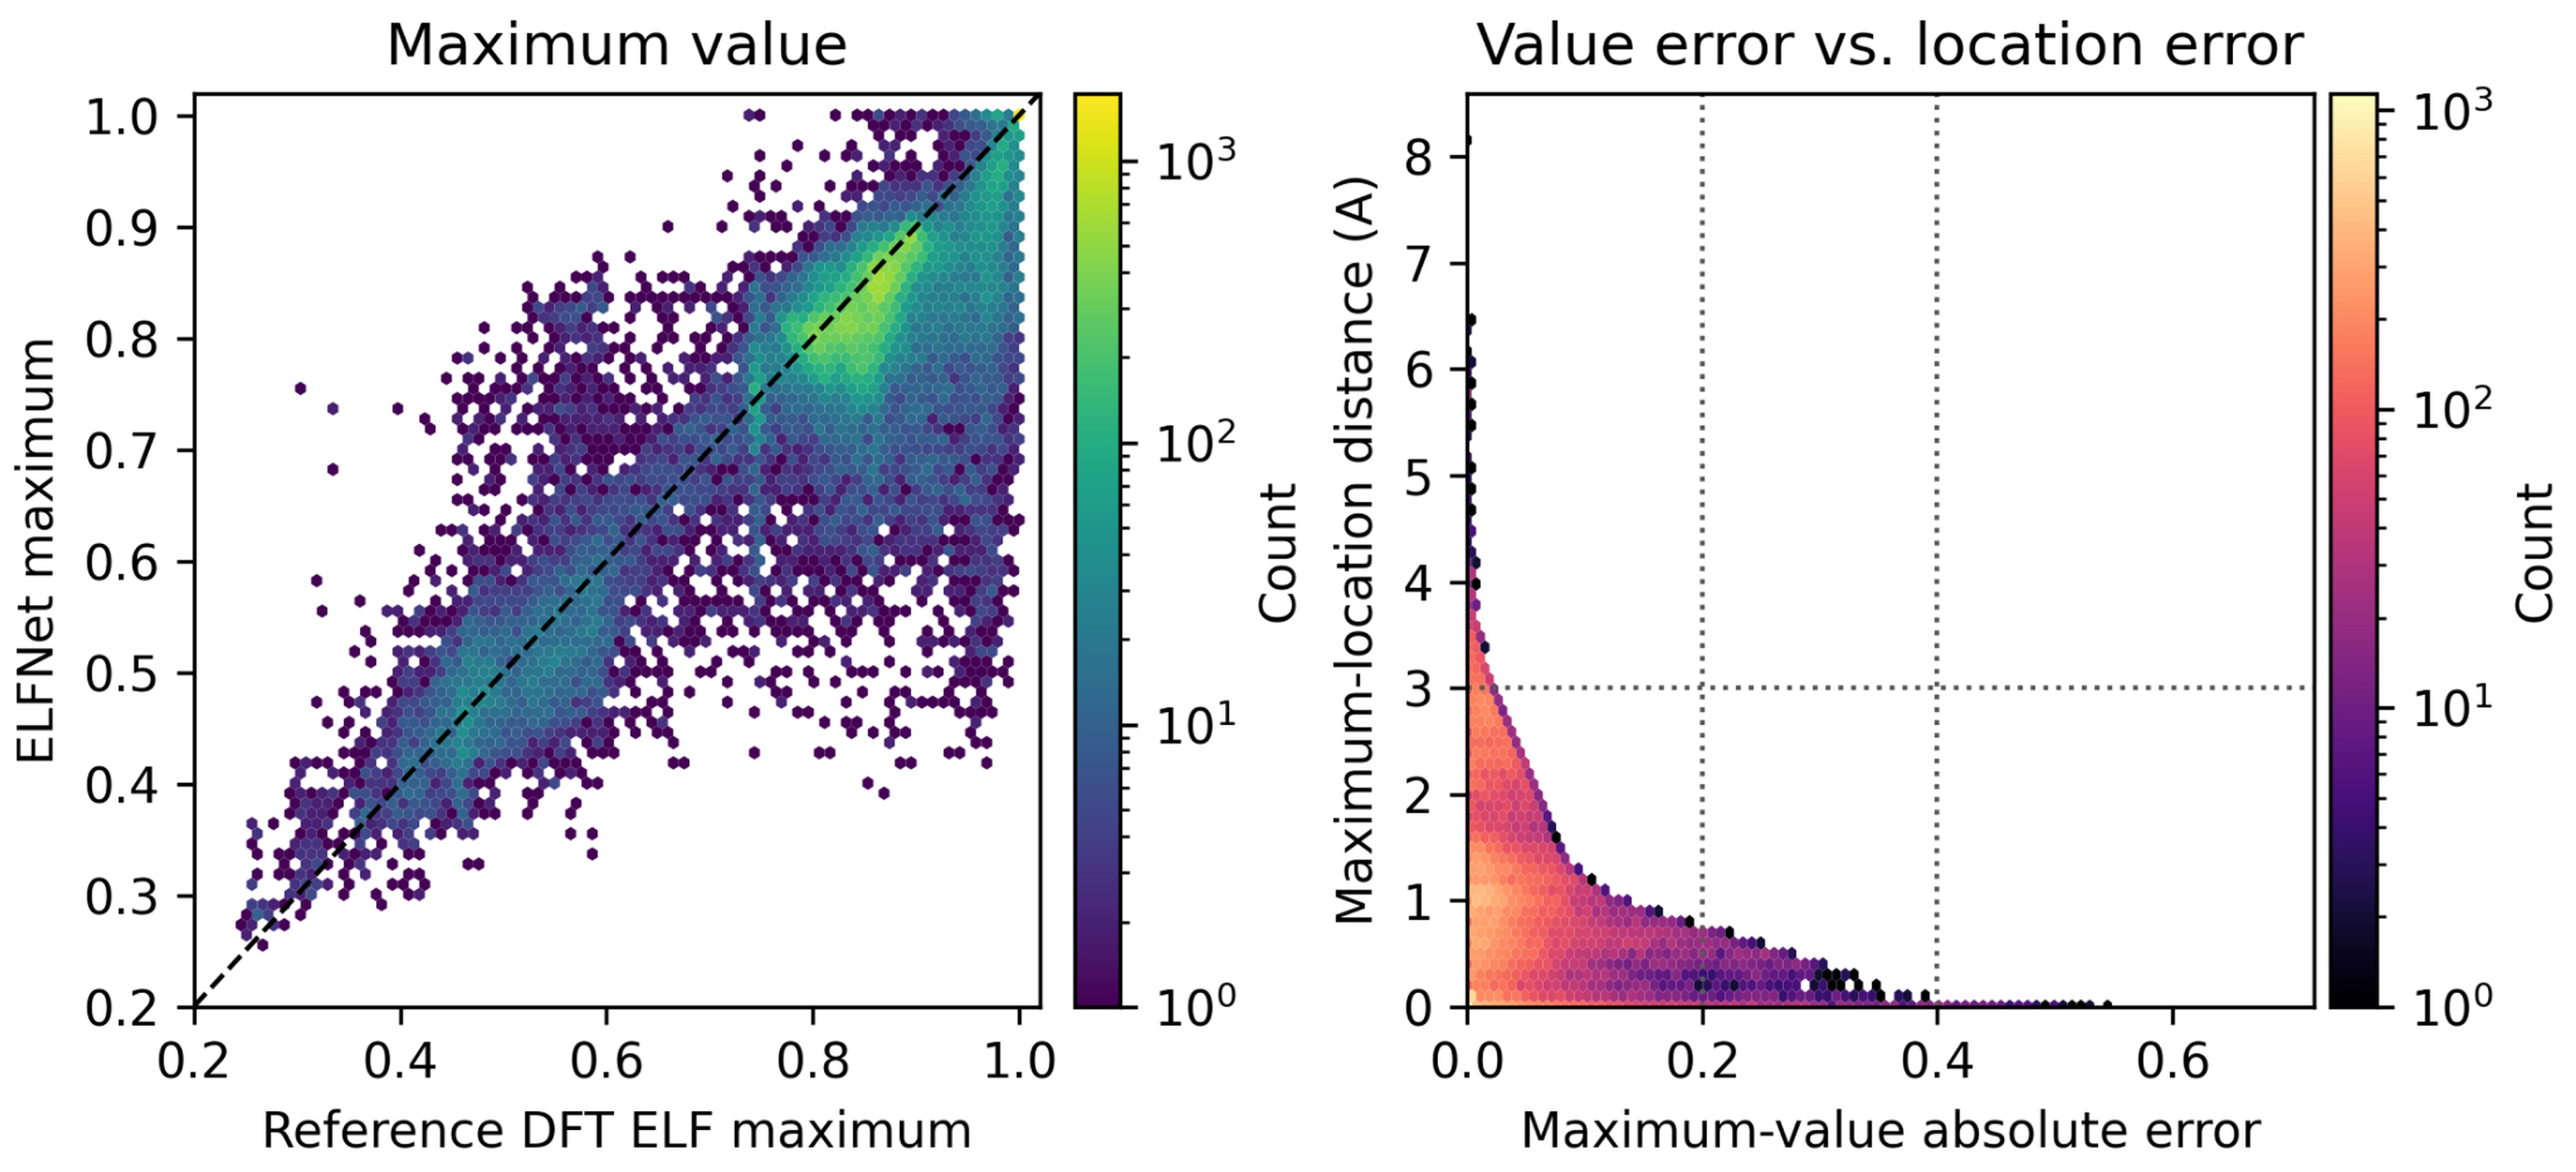
Figure 5. Maximum-value and maximum-location performance over the 50,000-structure hydride-derived template set. Left: parity plot comparing predicted and DFT reference global ELF maxima; the dashed line indicates perfect agreement. Right: absolute error in the maximum ELF value versus the real-space distance between predicted and DFT maximum locations. Both panels use logarithmic color density to indicate the number of structures in each bin. DFT: Density functional theory; ELF: electron localization function.