
fig6
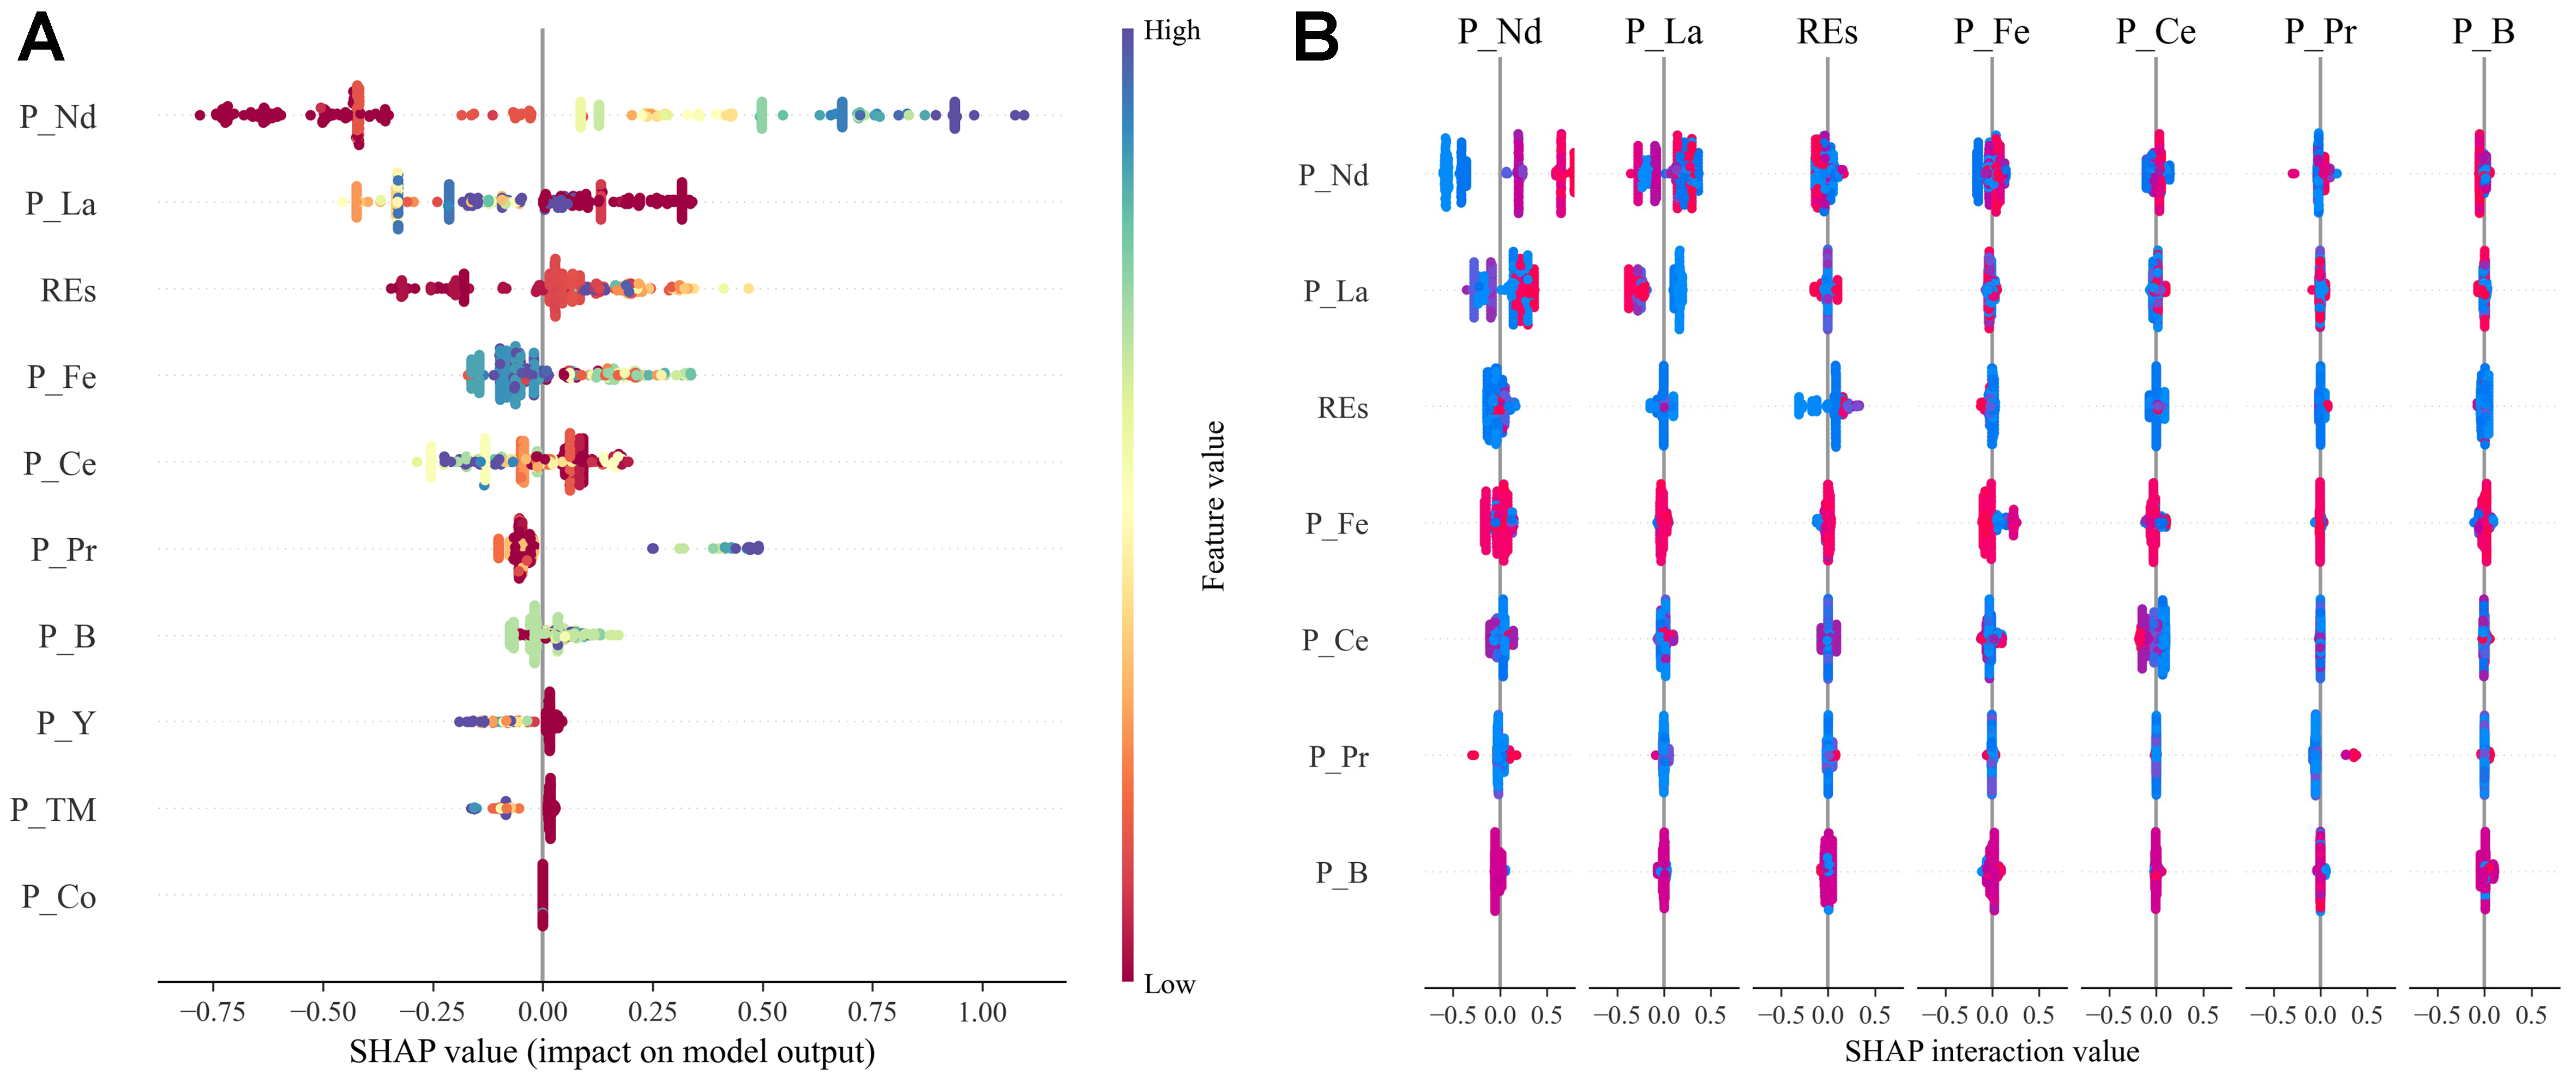
Figure 6. SHAP-based interpretation of the optimized MLP model. (A) Feature importance ranking showing the contribution of elemental composition variables to magnetic property prediction. (B) SHAP dependence plots illustrating nonlinear relationships and interaction effects between composition variables and model outputs. SHAP: SHapley Additive exPlanations analysis; MLP: multi-layer perceptron.