
fig6
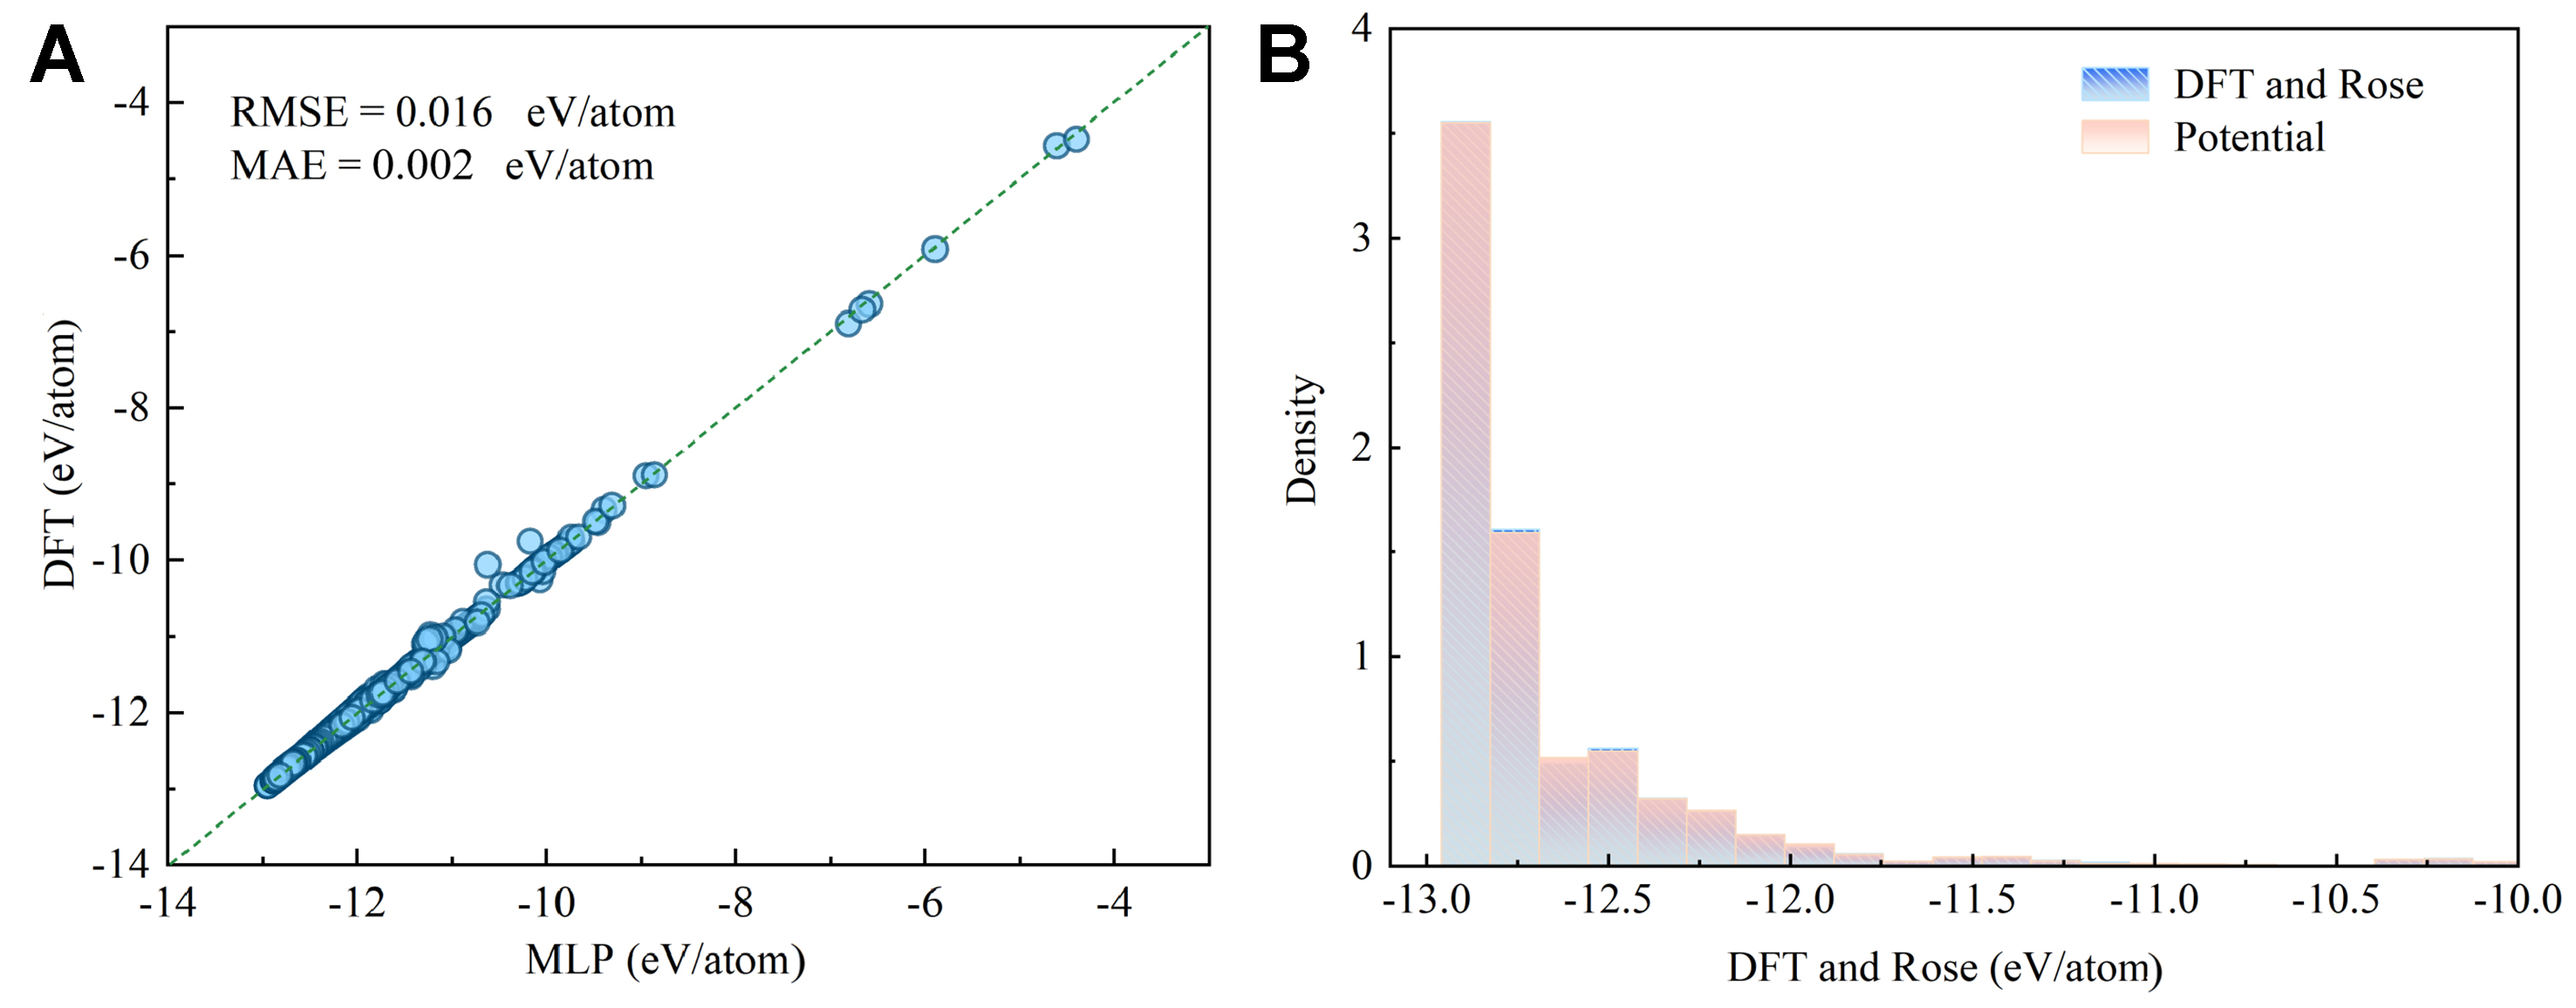
Figure 6. Quantitative validation of the energy predictions made by the trained MLP against the reference dataset (comprising DFT and Rose equation data). (A) Scatter plot comparing the MLP-predicted energies (horizontal axis) with the reference DFT calculations (vertical axis). The dashed diagonal line represents perfect agreement. The inset provides the quantitative prediction accuracy metrics, with a RMSE of 0.016 eV/atom and MAE of 0.002 eV/atom; (B) Probability density distribution histogram of the structural energies in the dataset. The horizontal axis represents the energy range (eV/atom), and the vertical axis represents the density of the configurations, demonstrating that the energetic predictions of the MLP closely map the structural distribution of the original DFT and Rose reference data. MLP: Machine-learning potential; DFT: density functional theory; RMSE: root-mean-square error; MAE: mean absolute error.