


fig7
From: Deciphering the strength-ductility trade-off in (CuNiMn)-X alloys via interpretable machine learning
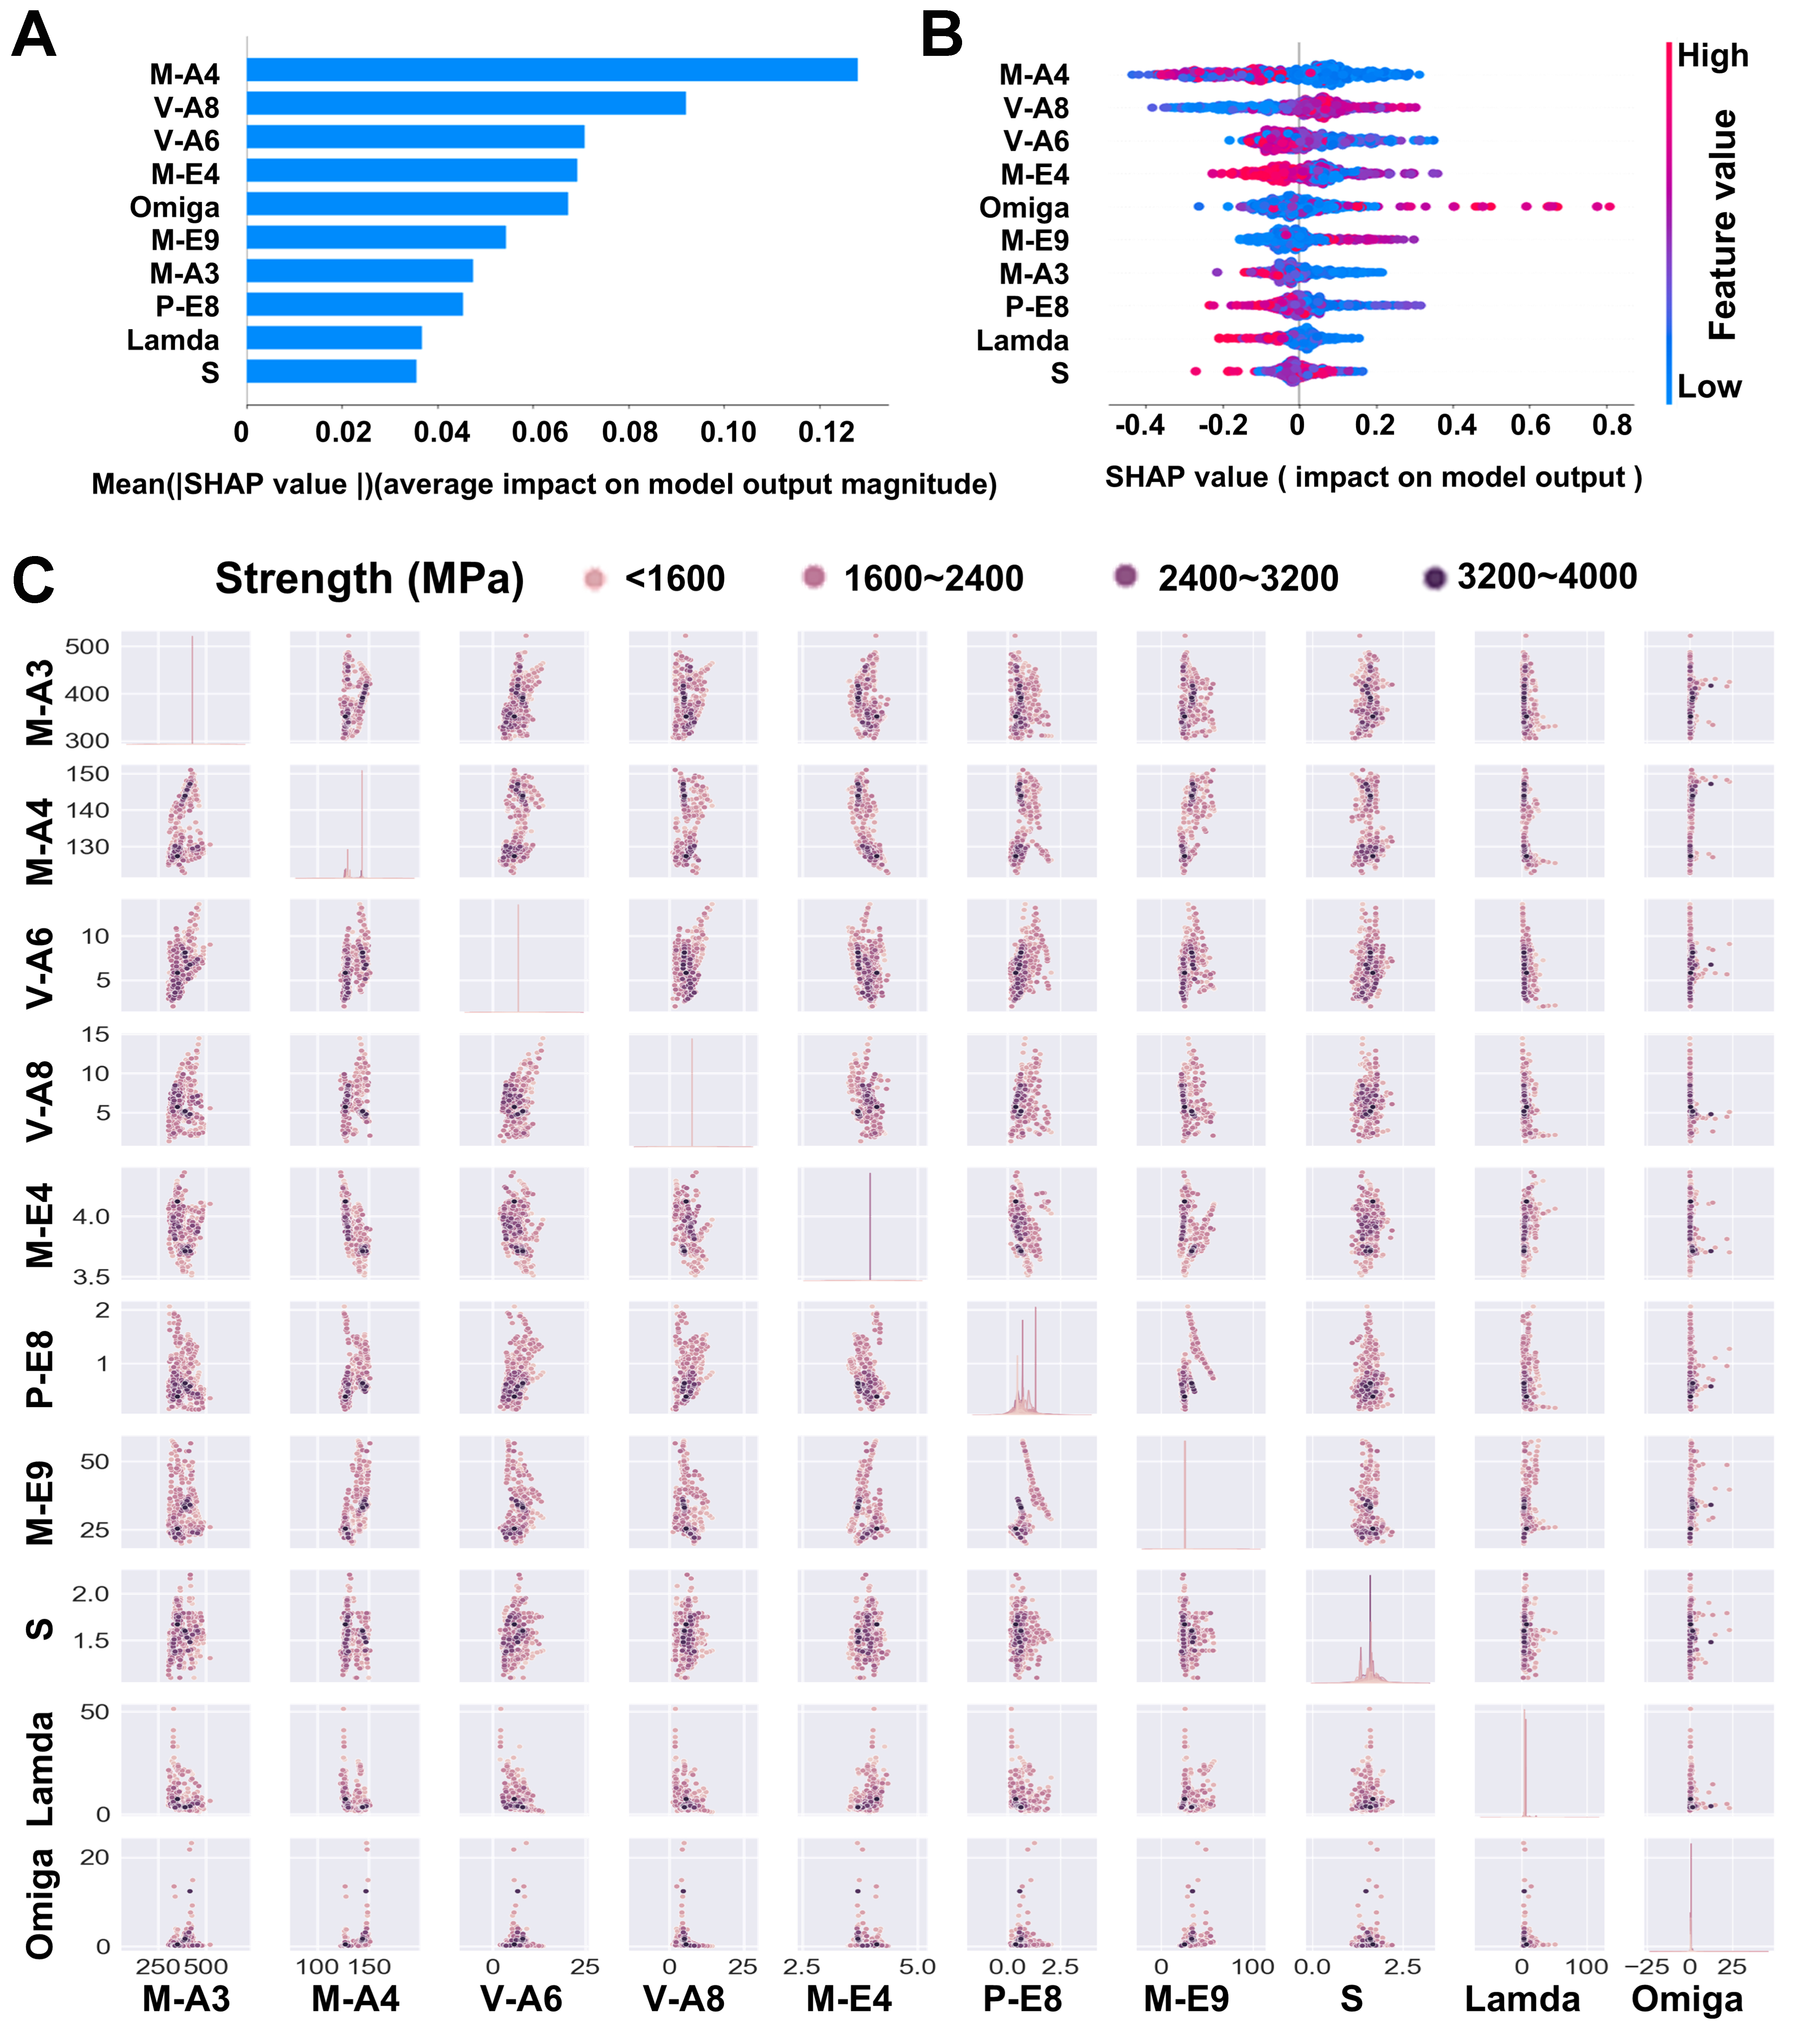
Figure 7. The relationship between compressive strength and feature factors: (A) assessment chart of importance; (B) SHAP influence diagram; and (C) scatter distribution diagram. SHAP: SHapley Additive exPlanations.


