


fig6
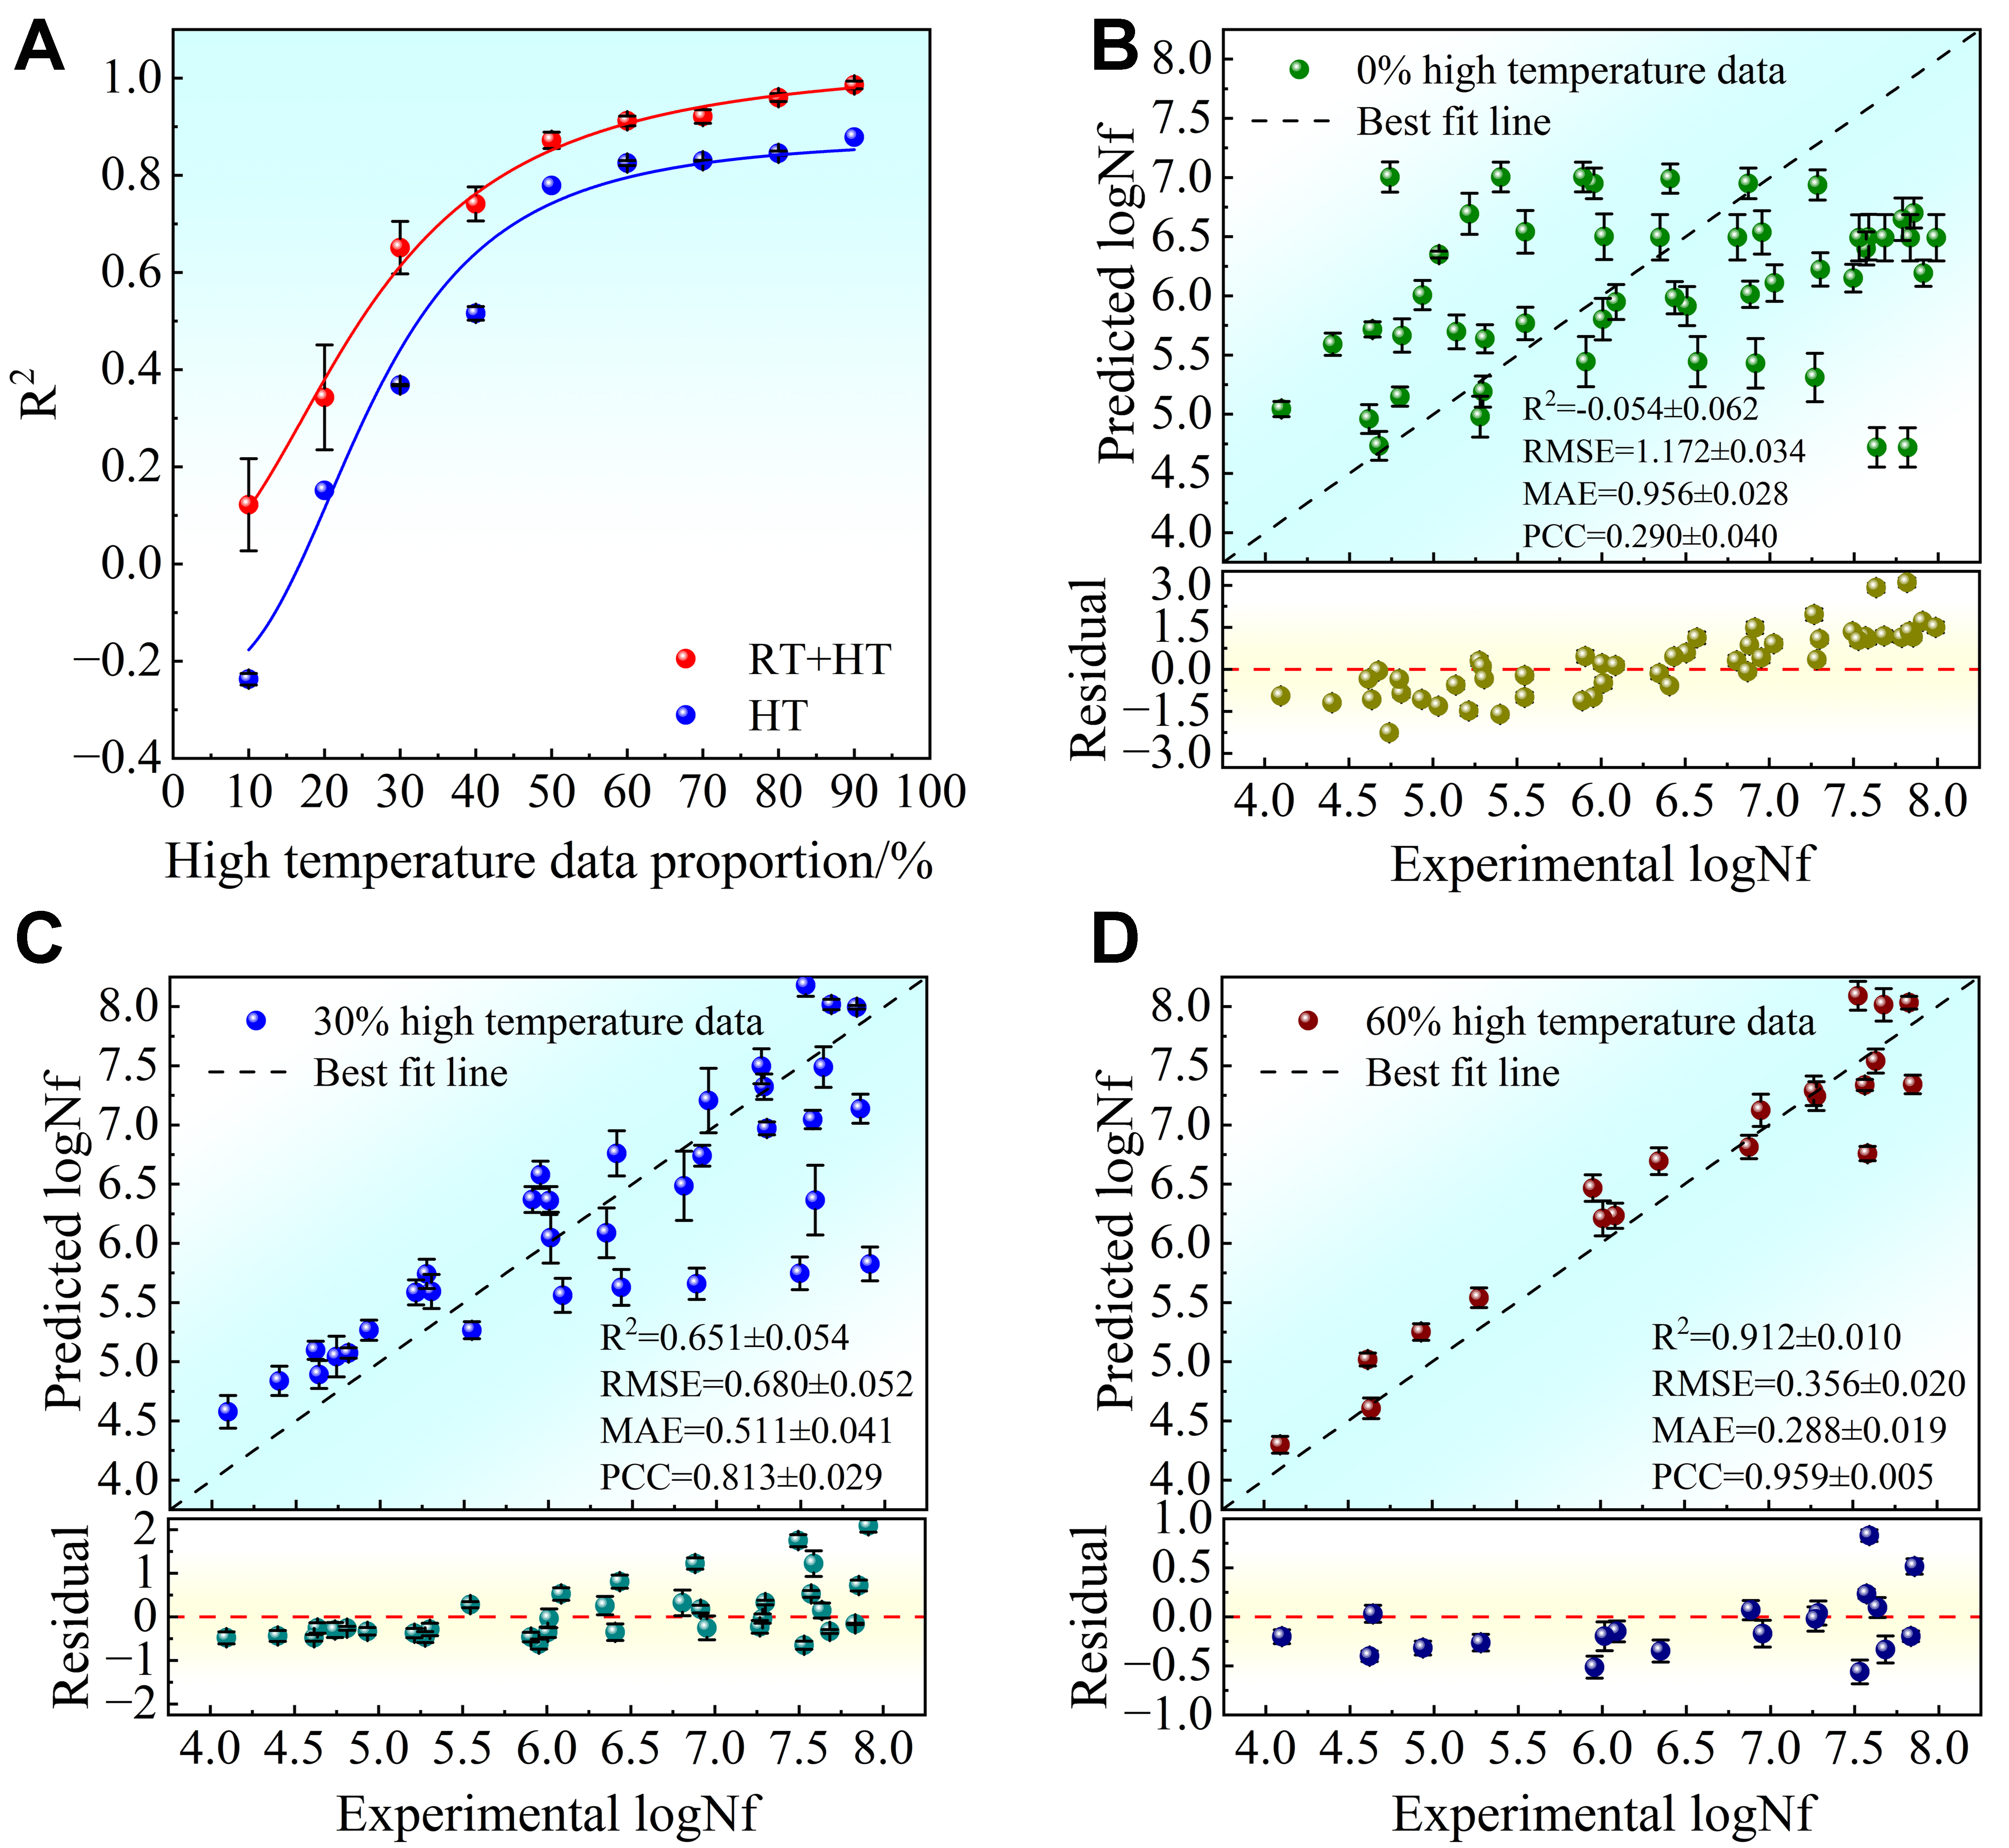
Figure 6. The influence of HT data proportion on the fatigue life prediction precision of the GBDT model, with error bars representing the standard deviation. (A) Comparison of R2 values for GBDT models trained on mixed vs. HT only data; (B-D) Prediction performance on the remaining HT test set when 0%, 30%, and 60% of HT data are incorporated into the training set, respectively. Test set sample size (N): 0% HT = 50, 30% HT = 35, 60% HT = 20. Error bars represent the standard deviation of 50 independent replicates. HT: High-temperature; GBDT: gradient boosting decision tree; R2: the coefficient of determination; RT: room-temperature; logNf: target life; RMSE: root mean square error; MAE: mean absolute error; PCC: Pearson correlation coefficient.


