


fig5
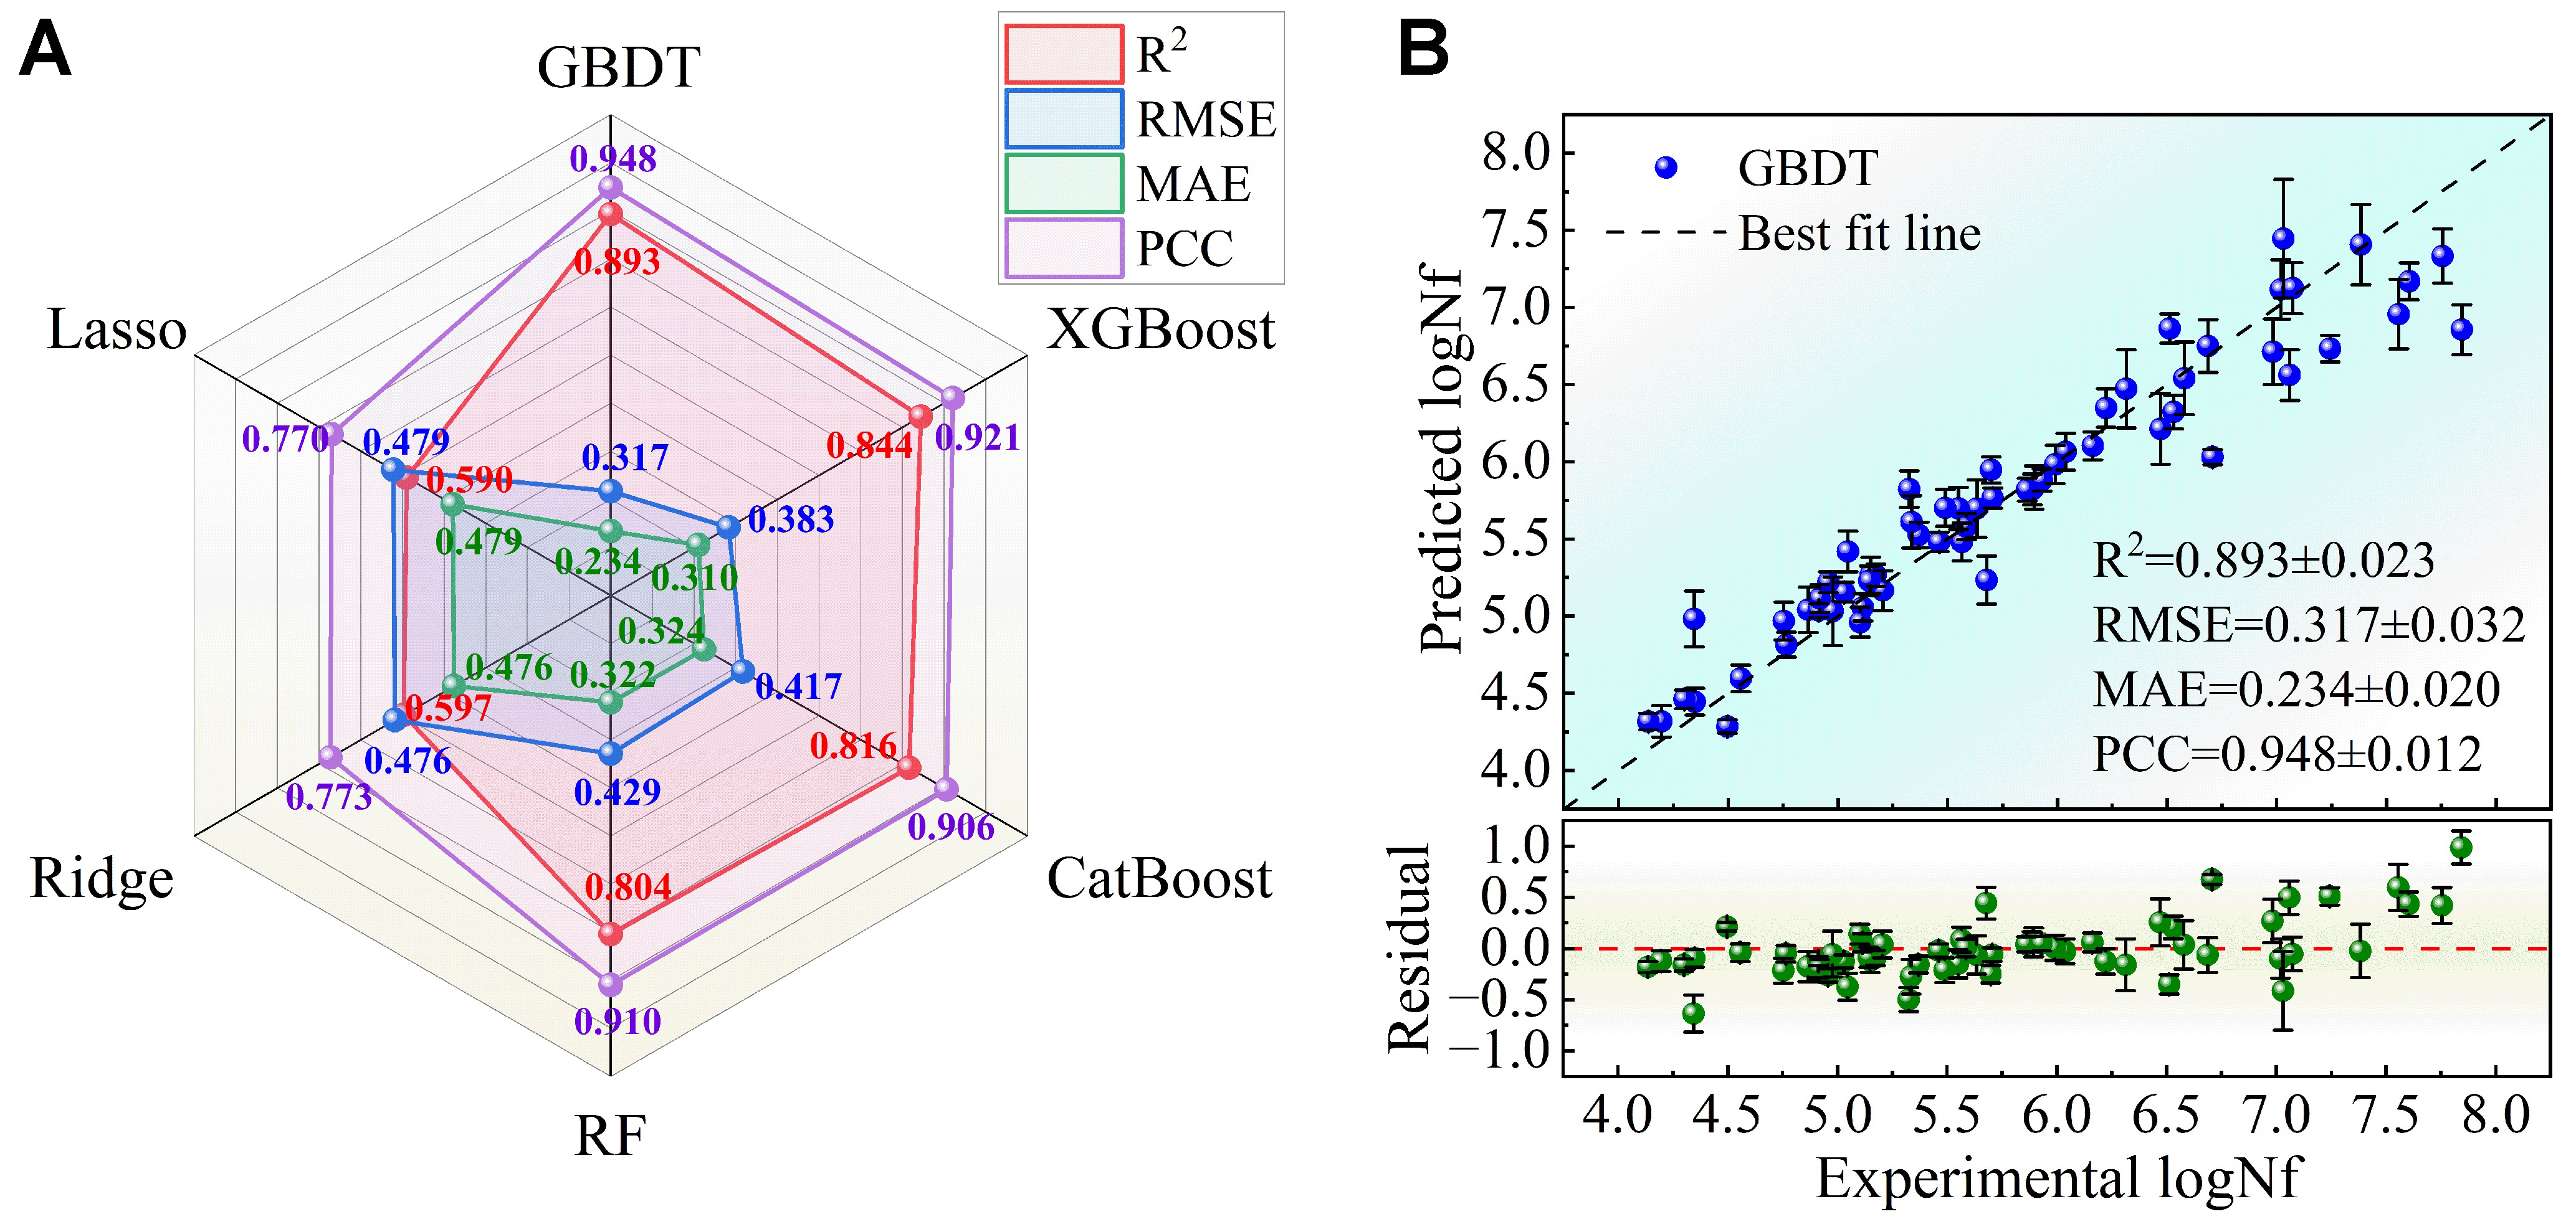
Figure 5. Comparison of model performance after feature selection, with error bars representing the standard deviation. (A) Radar chart for the performance comparison; (B) The relationship between the experimental values and the predicted values for the GBDT model, along with the corresponding residual plot (including the mean results from 50 runs with different random seeds). Test set sample size (N) = 60. Error bars represent the standard deviation of 50 independent replicates. GBDT: Gradient boosting decision tree; XGBoost: extreme gradient boosting; CatBoost: categorical boosting; RF: random forest; R2: the coefficient of determination; RMSE: root mean square error; MAE: mean absolute error; PCC: Pearson correlation coefficient; logNf: target life.


