


fig3
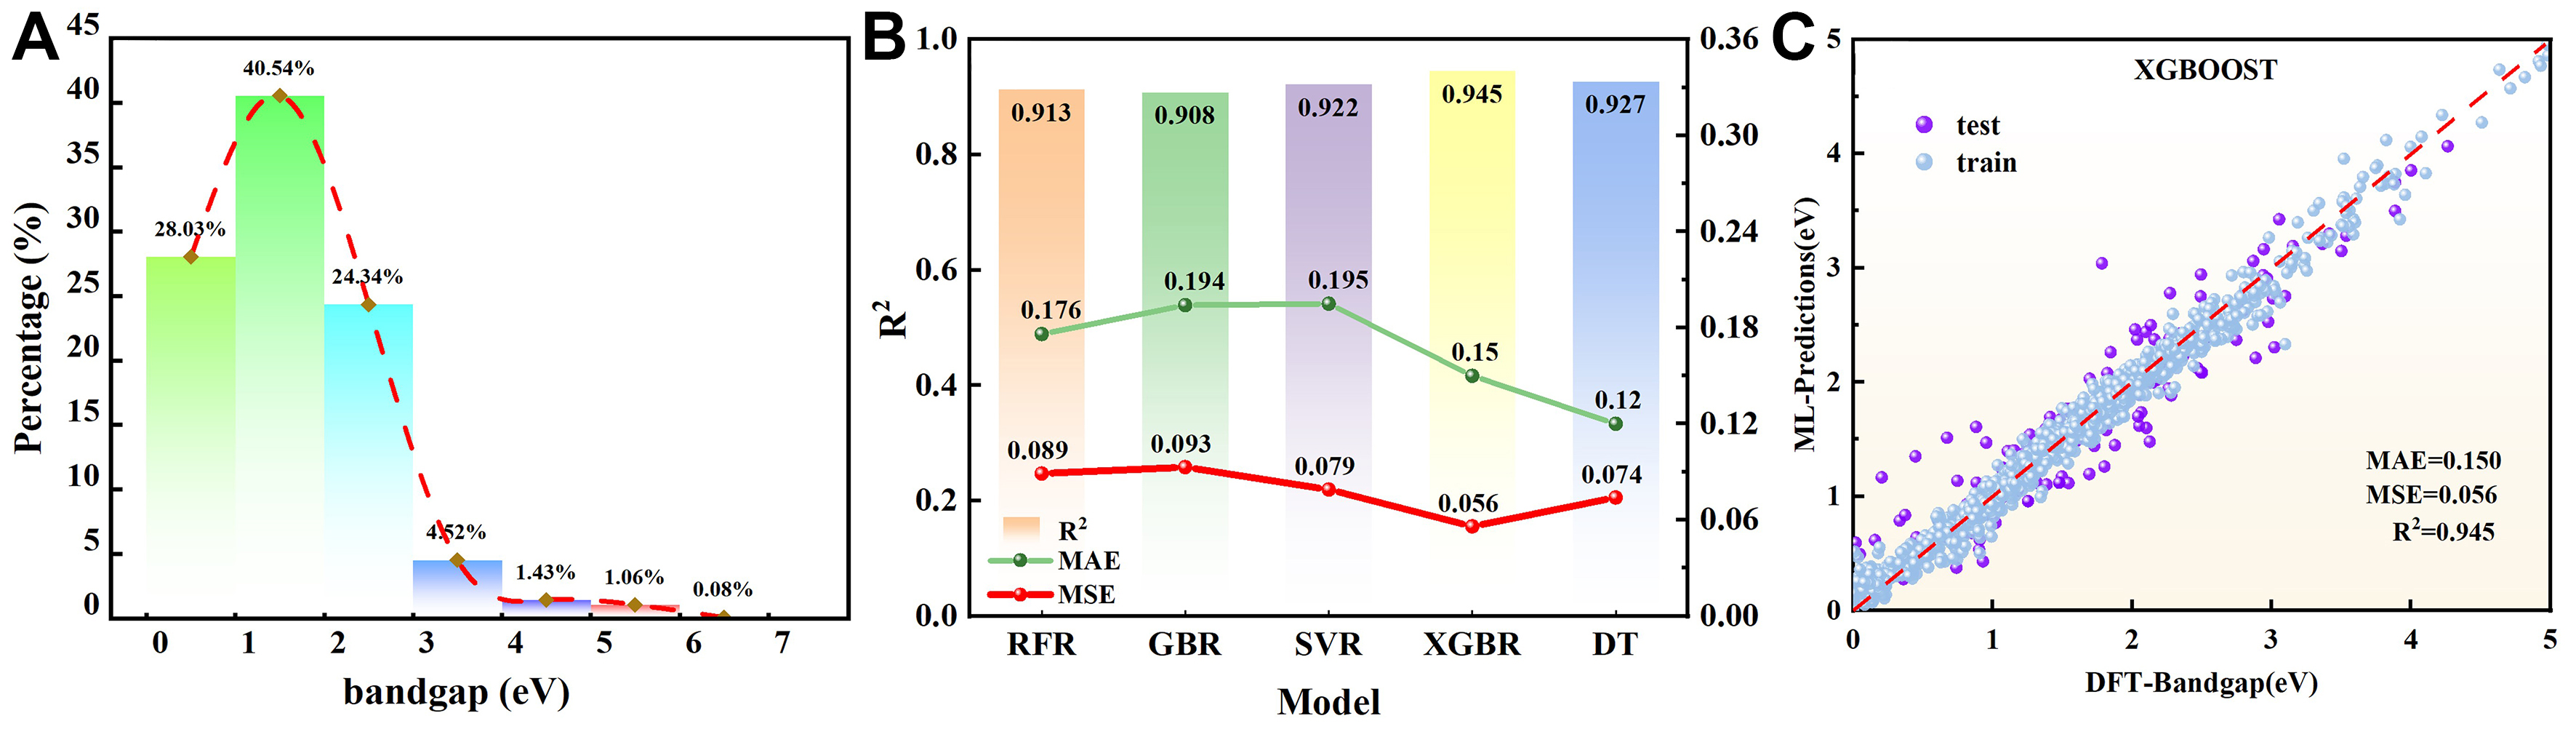
Figure 3. ML model training and prediction results. (A) The bandgap distribution of the 1,327 materials; (B) Test set performance (R2, MAE, MSE) for the five base ML models; (C) Fitting plot of the training and test set. prediction results for the best model, XGBR. ML: Machine learning; R2: coefficient of determination; MAE: mean absolute error; MSE: mean squared error; XGBR: extreme gradient boosting regressor.


