


fig2
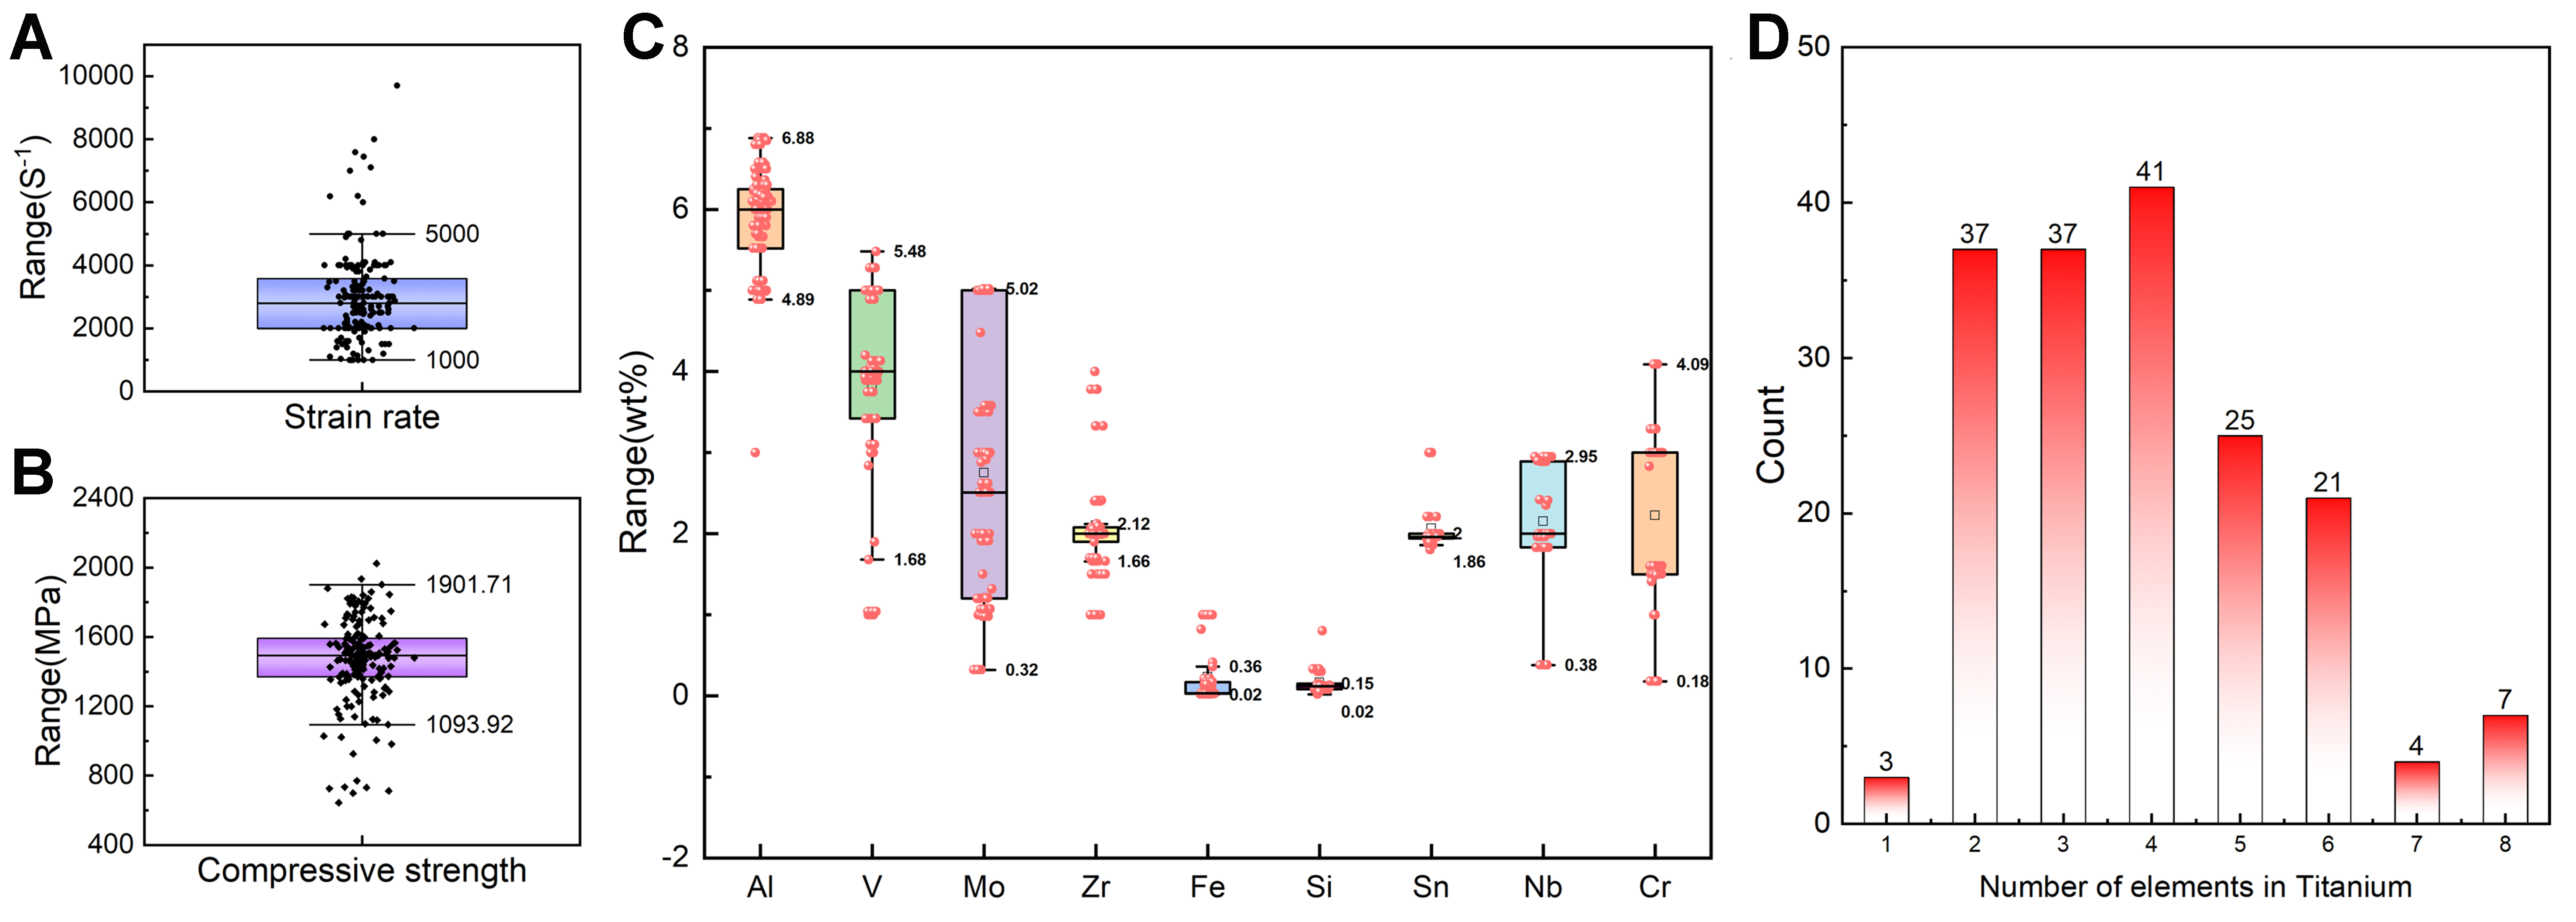
Figure 2. The distribution of the strength dataset. The box plot distributions of flow strength, fracture strain and non-Ti alloying element characteristics in the datasets. (A-C) all show many outliers in terms of characteristics and target values; (D) The distribution of element quantities in titanium alloys indicates that most of the alloys in the dataset contain 4 to 6 elements.


